Biomagnification of mercury in mollusks from coastal areas of the Chinese Bohai Sea

Mei Menga, Jian-bo Shi*ab, Cheng-bin Liua, Na-li Zhua, Jun-juan Shaoa, Bin Hea, Yong Caibc and Gui-bin Jianga
aState Key Laboratory of Environmental Chemistry and Ecotoxicology, Research Center for Eco-Environmental Sciences, Chinese Academy of Sciences, Beijing 100085, China. E-mail: jbshi@rcees.ac.cn; Fax: +86-10-62849129; Tel: +86-10-62849129
bInstitute of Environment and Health, Jianghan University, Wuhan 430056, China
cDepartment of Chemistry & Biochemistry and Southeast Environmental Research Center, Florida International University, Miami, Florida 33199, USA

Received 15th February 2015 , Accepted 27th April 2015

First published on 27th April 2015


Abstract

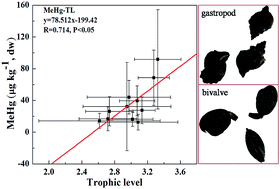
The multiple recognized mollusk species are usually regarded as one group lying at the second trophic level in the marine ecosystem. As a result, the virtual resolution of Hg uptake and transfer processes that occur in different mollusks would be overlooked. In this work, the concentrations of total mercury (THg) and methylmercury (MeHg), δ15N, δ13C and lipid contents were comprehensively analyzed in 11 mollusk species collected from the Chinese Bohai Sea during 2007–2012. The contents of THg and MeHg were in the range 27.2–461.1 and 2.1–295.5 μg kg−1, respectively. The trophic levels (TLs) were in the range 1.99–4.02. The biomagnification of Hg was evident from the significant positive correlations between Hg contents and TLs, and from the trophic magnification factors (TMFs). MeHg is the main species of Hg magnification in mollusks, while growth dilution occurs in the trophic transfer of inorganic mercury (IHg). TLs showed a greater effect on Hg levels in mollusks than lipid contents.
1. Introduction

The bioaccumulation of mercury (Hg) in low trophic level aquatic organisms, such as mollusks and zooplankton, provides the entry point of Hg from water and sediment to marine food webs through subsequent trophic transfer, finally leading to significant accumulation in top predators and humans. The efficiency of this water/sediment-to-food web transfer of Hg and the subsequent biomagnification within low trophic levels governs the regional exposure of marine organisms.1,2 However, the present research is mostly focused on Hg levels in fish and corresponding exposure to humans,3–5 and the accumulation and magnification of Hg in low trophic level mollusks are largely ignored.

Along with fish, mollusks are a high-consumption seafood and an important part of Chinese diet, especially for the coastal residents. Because of their long life cycle and restricted ability to move, mollusks can accumulate a wide range and high levels of pollutants in proportion to the degree of pollution.6 There are multiple recognized mollusk species, with highly diverse structure, composition and feeding habit. However, mollusk species are usually regarded as one group lying at the second trophic level in the marine ecosystem.7 When numerous mollusk species are grouped in the large-scale marine food web analyses, the virtual resolution of Hg uptake and transfer processes that occur at the low trophic level organisms would be overlooked. A recent study has revealed significant Hg biomagnification in marine zooplankton food webs collected from Hudson Bay, Canada.8 It still remains unknown whether the biomagnification of Hg occurs in low trophic level mollusks. Therefore, it is imperative to investigate the trophic transfer of Hg in mollusk food webs.

Bioaccumulation and biomagnification of Hg in marine organisms have drawn scientists' attention for several decades. WHO (1976 and 1990) reported concentrations of methylmercury (MeHg) in predatory fish species reaching up to 106 times higher than concentrations of Hg in ambient water.9,10 MeHg was noted to be the dominant form of Hg accumulated by organisms at higher trophic levels (TLs), accounting for 85–95% of total mercury (THg).11–13 Studies on mechanisms found that lipophilic MeHg passed easily through intestinal membrane into blood, and the efficient assimilation of MeHg to fat and muscle and the lack of elimination leaded to increasing MeHg levels with age and size of fish.14 Biomagnification of Hg along food chains has been or is still widely investigated from different aspects and in different regions.15–18 Trophic magnification factors (TMFs) are usually used as approved evidence for biomagnification in a food web.19 Recently, TMFs are suggested to be calculated separately for poikilotherms (including mollusks) and homeotherms due to their different biomagnification rates resulted from differences in energy requirements and abilities to biotransform pollutants.20

The long-term study on the fishery ecosystem structure of Chinese Bohai Sea showed that the dominant large-size and high economic value fishes have been replaced by the short-lived and small-sized pelagic fishes since the 1980s, which have been recently replaced by invertebrates.21 Current fishery community in Bohai Sea are characterized as smaller, younger, low-biomass, low-quality and low-value varieties, with crustaceans, shellfish and jellyfish as the main fishing species.22 According to the statistics on the fishing structure of the Bohai Sea and Yellow Sea in China, the total catch of shellfish was 403[thin space (1/6-em)]100 tons in the year 2009, accounting for about 10% of total fishing output from this area.22 The reduced biomass of large-sized fish has shortened the food chain in the Bohai Sea. The mean trophic level has declined from 4.06 in 1959–1960 to 3.41 in 1998–1999, and this decline was faster than that of the global catch.21 As a result, mollusks are taking up an increasingly important proportion in the large-scale marine food webs of this area, and have gradually constituted an important seafood source of human Hg exposure. Using mollusks as bioindicators would not only help to reflect the contamination status and estimate the human Hg exposure, but also provide information for coastal management and fishery adjustment. Moreover, perched on the bottom of the coastal waters and lying in the low trophic level of marine food webs, mollusks have great potential in connecting the land-based river discharges of Hg with top predators. Thus, mollusks play essential roles in the biogeochemical cycling of Hg in coastal regions, especially in the Chinese Bohai Sea.

The aim of this work was to study the accumulation and magnification of Hg in marine mollusk food webs through the detection of δ15N and δ13C. The effects of trophic level and lipid contents on the levels and species of Hg in mollusks were discussed in detail. The possibility of using mollusk as bioindicators for Hg monitoring was also evaluated through the calculation of bioaccumulation factors (BAFs).

2. Materials and methods

2.1. Sample collection and preparation

The Bohai Sea, surrounded by highly industrialized cities, consists of the Liaodong, Bohai, and Laizhou bays and the inner region. It receives a large amount of fresh water from over 40 rivers, among which the Liaohe, Luanhe, Haihe and Yellow Rivers are the four major ones. With an average water depth of 18 m and coastal line of nearly 3800 km, the Bohai Sea is the largest semi-enclosed inner shelf sea in China and the water change is very slow. Once contaminated, the Bohai Sea needs a long time to resume the water quality. Fig. 1 shows the map of the 9 coastal cities along Bohai Sea, including Beidaihe, Dalian, Huludao, Penglai, Shouguang, Tianjin, Weihai, Yantai and Yingkou. The mollusk samples were collected from the coastal areas near these nine cities. The sampling sites involve the near-shore areas of four provinces in the Bohai Sea Rim Economic Zone.
image file: c5ra02919h-f1.tif
Fig. 1 Map of the sampling area.

The sampling activities were carried out annually from July to August during 2007–2012, except for the year 2008 when the sampling was not conducted. Eleven species of mollusks, including nine species of bivalves, Amusium veneriformis (Amu), Chlamys farreri (Chl), Cyclina sinensis (Cyc), Mactra veneriformis (Mac), Meretix meretrix (Mer), Mya arenaria (Mya), Mytilus edulis (Myt), Crassostrea talienwhanensis (Ost) and Scapharca subcrenata (Sca), and two species of gastropods, Neverita didyma (Nev) and Rapana venosa (Rap), were selected (Table S1). The collected mollusks were transported to the laboratory on ice and cleaned by tap water and ultrapure water (18.2 MΩ) in the laboratory. The soft tissue of the mollusks was excised with stainless steel scalpel blades and thoroughly rinsed with ultrapure water to remove extraneous impurities. For each sample, about 500–1000 g of wet soft tissue, consisting of 3–30 individuals, was homogenized in a blender to guarantee enough sample mass. Since these individuals of each sample were collected from the same place at the same time and were similar in size, the contents of total mercury (THg), methylmercury (MeHg) and inorganic mercury (IHg) could be regarded as the same. The homogenized samples were then freeze-dried at −50 °C (Alpha 1-2 LD plus, Christ, Germany) and ground to powder. The samples were stored at −20 °C for further analysis. A total of 431 soft tissue samples were obtained and analyzed.

2.2. Hg analysis

For total mercury (THg) analysis, a Hydra-C mercury analyzer (Teledyne Leeman Labs, USA) following USEPA method 7473 (ref. 23) was used. For MeHg analysis, the MERX Automatic Methylmercury System (Brooks Rand Laboratories, USA) following USEPA method 1630 (ref. 24) was adopted. Concentrations of inorganic mercury (IHg) were calculated as the concentration of THg minus that of MeHg. The detailed information for Hg analysis is provided in ESI.

2.3. Stable nitrogen and carbon isotope analysis

δ15N and δ13C were determined with a Thermo DELTA V Advantage isotope ratio mass spectrometer interfaced to a Flash EA1112 HT elemental analyzer (Thermo Fisher, USA). Atmospheric nitrogen (N2) and Pee Dee Belemnite (PDB) were used as standards for the calculations of δ15N and δ13C, respectively. The variations of 15N versus 14N and 13C versus 12C are expressed as ‰ deviations relative to the reference standards in δ unit according to:
δ15N (‰) = [(Rsample/Rstandard) − 1] × 1000

δ13C (‰) = [(Rsample/Rstandard) − 1] × 1000
where R is the corresponding ratio of 15N/14N or 13C/12C. The analytical precisions for δ15N and δ13C were ±0.2‰ (n = 5) and ±0.1‰ (n = 5), respectively.

2.4. TL and TMF calculations

Trophic levels (TLs) were calculated for mollusk samples based on the measured nitrogen isotope ratios using the following equation:19,25
TL = (δ15Nconsumer − δ15Nzooplankton)/3.8 + 2

Trophic magnification factors (TMFs) were computed based on the regression of Hg concentration versus TL according to the following equations:19

log[Hg concentration] = b × TL + constant;

TMF = 10b

2.5. Quality control and statistical analysis

For the analytical quality control, certified reference materials (CRMs), sample replicates and reagent and method blanks were conducted in the whole procedure. The detailed information of the CRMs and the obtained results are shown in Table S2. The relative standard deviations (RSDs) for triplicate samples analysis were in the range 0.6–11.8% and 3.2–10.6% for THg and MeHg, respectively.

The map of sampling sites was drawn using software ArcGIS 10. Statistical analysis of the data was accomplished with Origin 8.0 and SPSS 20.0 software. A Kolmogorov–Smirnov test was used to check the normality of the obtained data. One-way ANOVA, t-test and hierarchical cluster analysis were conducted to assess the significant differences of Hg accumulation in mollusks.

3. Results and discussion

3.1. Comparisons among years, locations and mollusk species

Concentrations of THg, MeHg and percentages of MeHg in THg (%MeHg) in all mollusk samples (n = 431) are summarized in Table S3. Overall, the concentrations of THg and MeHg were in the ranges 27.2–461.1 and 2.1–295.5 μg kg−1, with a mean of 99.4 and 45.1 μg kg−1, respectively. The median values for both THg and MeHg were less than the mean values, indicating that most of the concentrations were distributed at the lower level of the range. The concentrations of both THg and MeHg in mollusks were below the maximum permissible limit in China of 500 μg kg−1 for MeHg in seafood.26 As shown in Table S4, the mean THg and MeHg levels in mollusks from Chinese Bohai Sea were obviously lower than those reported for mollusks in USA, Mexico, French, Italy and Cuba, while similar to those found in Brazil, Adriatic Sea, Ionian Sea, Baltic Sea and Mediterranean Sea, and a bit higher than those in West Greenland, Turkey, Iran and Korea. These results suggest a relatively low level of Hg contamination in mollusks from Chinese Bohai Sea, which could possibly be attributed to the short growing and accumulation period of mollusks resulted from frequent fishing. Studies have found an increasing pattern of Hg accumulation with size in mollusks from highly contaminated areas.27,28 According to our previous study in 2002, Rapana venosa (Rap) collected from Huludao also showed uplifted trends with size, and mollusks collected in this study are comparatively smaller in size.29 However, comparing with other regions in China, concentrations of Hg in this study were obviously higher than those in mollusks from coastal areas of Guangdong and east coasts of Hong Kong (Table S4). Our previous study in 2002 also found Cd, Cu and Zn contents in some gastropods and oysters exceeding the maximum permissible levels recommended by WHO.7 These results indicated a certain degree of heavy metal contamination in Bohai Sea area. The concentrations of THg and MeHg in all mollusk samples showed a significantly positive correlation (R = 0.776, P < 0.001, Fig. S1).

The boxplots for the temporal and spatial variations of THg and MeHg in mollusks are shown in Fig. S2 and S3, respectively. Except for a slight fluctuation, no significant time trends were found in both THg and MeHg levels during this period of six years (Fig. S2), indicating a relatively stable contamination situation in this region. As for the sampling sites, the mollusks collected from Penglai showed slightly higher concentrations of THg than those from Beidaihe, Weihai, Yantai and Yingkou (one-way ANOVA, P < 0.05), and higher levels of MeHg than those from Yingkou (P < 0.01) (Fig. S3). This is probably attributed to the paper mill industry and the gold mines located in the adjacent area of Penglai.29 Wastewater from the paper mill is discharged into Bohai Sea with no disposal, and gold extracting activities using gold–mercury amalgam method in the gold mines lead to the local Hg contamination in air, river and soil, with Hg finally converging into Bohai Sea.29

Fig. 2 compares the concentrations of THg and MeHg in the 11 mollusk species. Obviously, the gastropod species (Nev and Rap) contained significantly higher levels of THg and MeHg than the bivalve species (t-test, P < 0.01). In order to further compare the accumulation ability for MeHg of the different mollusk species, the percentages of MeHg in THg (%MeHg) were then calculated. As shown in Table S3 and Fig. S4, the mean %MeHg was the highest in Rap (65.8%) and the next higher in Nev (57.3%), being significantly different comparing to the nine bivalve species (one-way ANOVA, P < 0.05). The mean %MeHg in Ost (49.5%) was slightly lower than that in Rap (P < 0.05), but significantly higher than those in Myt (21.3%) and Sca (21.1%) (P < 0.05). These results indicate that the gastropod species had higher ability in the accumulation of MeHg than the bivalve species, and Rap was the highest among the selected species. Among the bivalve species, Ost had a relatively higher ability to accumulate MeHg.


image file: c5ra02919h-f2.tif
Fig. 2 Boxplots of THg and MeHg in 11 mollusk species during 2007–2012.

3.2. Biomagnification of Hg in mollusk food webs

Nitrogen isotope ratios (δ15N) are often determined to identify trophic position of biota in aquatic environment and have been widely used in studying the biomagnification of pollutants through food chain.8,30 In this work, δ15N and δ13C in mollusk samples collected in 2009 and 2012 (n = 175) ranged from 4.23–11.94‰ and −24.40 to −16.66‰, respectively. The calculated TLs for all mollusks were in the range 1.99–4.02 (Table S1), which is consistent with the literature.31 Among the 11 species, the predatory gastropods Rap (3.33 ± 0.28) and Nev (3.28 ± 0.19) showed higher TLs than the bivalve species, and the concentrations of THg and MeHg in both Rap and Nev were also higher than in bivalves (Table S1). Mer had the lowest average concentrations of THg and MeHg, as well as the lowest TL (2.61 ± 0.74).

In order to explore whether the biomagnification of Hg occurred in the marine mollusk food web, the correlations between Hg concentration (including THg, MeHg, IHg and %MeHg) and TL were performed (Fig. 3). Significant positive linear relationships were found between THg and TL (R = 0.646, P < 0.05), MeHg and TL (R = 0.714, P < 0.05), and %MeHg and TL (R = 0.677, P < 0.05), indicating potential trophic transfer and biomagnification of Hg in mollusk food webs. This relationship is different from that of some persistent organic pollutants (POPs) in mollusks collected from the same area, in which negative correlations were found, implying potential trophic dilution rather than magnification.25,32–34 The correlation between IHg and TL was not statistically significant (R = 0.162, P = 0.635), although the concentration of IHg was slightly decreased with TL (Fig. 3).


image file: c5ra02919h-f3.tif
Fig. 3 Relations between concentrations of THg, MeHg, IHg and %MeHg and trophic level (TL).

Trophic magnification factors (TMFs), which are usually used as approved evidence for biomagnification in a food web, were further calculated from the slope of the regression of Hg concentration vs. trophic level. The relations between log[Hg] and TL and the results of calculated TMFs are shown in Fig. S5 and Table 1, respectively. The TMFs for both THg (1.20) and MeHg (1.85) were greater than 1, demonstrating the biomagnification of THg and MeHg in the mollusk food web. Moreover, the TMFs for MeHg were much higher than those for THg, suggesting that MeHg is the main form of Hg magnifying in mollusks. This conclusion is further confirmed with the low TMFs for IHg (0.78). This result is in agreement with other studies on mercury magnification in marine zooplankton food webs, such as the recent study in Hudson Bay.8

Table 1 Trophic magnification factors (TMF) of THg, MeHg and IHg in mollusks
Hg species ba p-valuea TMFb
a log[Hg concentration] = b × TL + constant.b TMF = 10b.
THg 0.080 0.042 1.20
MeHg 0.266 1.25 × 10⁻⁴ 1.85
IHg −0.108 0.025 0.78


Fig. 4 shows the relationships between MeHg and IHg contents and δ15N. The concentrations of IHg decreased significantly (β = −3.2, R = 0.176, P < 0.05; β: slope) over the range of δ15N represented by the mollusks in the entire data set, while the concentrations of MeHg increased significantly (β = 7.9, R = 0.294, P < 0.001). As shown in Fig. S6, the concentrations of THg increased with δ15N (β = 4.7, R = 0.145, P = 0.055), but not so significantly as MeHg. Not surprisingly, %MeHg increased with δ15N (β = 4.7, R = 0.336, P < 0.001). All of these results indicate that the concentrations and percentages of MeHg increased more significantly with the increasing of mollusk TLs, accompanied by the decreased uptake and/or retention of IHg. Therefore, MeHg appears to be an efficiently retained form of Hg in mollusks with progression up the food web, while IHg seems to be more readily cleared from the mollusks. It should be noted that the body size of mollusks may also increase with δ15N and the process of growing up of mollusks could show distinct effects on the uptake and retention of different Hg species. Growth dilution could occur with increasing TLs in the trophic transfer of IHg in mollusks, which would then influence the accumulation trends of THg. It was shown that δ15N in zooplanktons increased with body size, in a study of investigating the trophic transfer of POPs where zooplanktons were fractionated by size.35


image file: c5ra02919h-f4.tif
Fig. 4 Relations between concentrations of MeHg and IHg and δ15N.

Over the range of δ13C represented by the collected mollusks, the concentrations of THg were observed to increase (β = 4.6, R = 0.116, P = 0.268), and MeHg concentrations increased more significantly (β = 6.5, R = 0.211, P < 0.05) in comparison to THg. Differently, the concentrations of IHg were found to decrease with δ13C (β = −1.9, R = 0.080, P = 0.446). The correlation between MeHg concentration and δ13C (P < 0.05) was more significant than those between THg concentration and δ13C (P = 0.268) and between IHg concentration and δ13C (P = 0.446). In other words, MeHg in mollusks had significantly positive correlations with enriched δ13C values, and IHg had great relationship with depleted δ13C values. Enriched δ13C values in marine organisms have been found to correlate with marine organic carbon, while the depleted values were associated with terrigenous organic carbon (via river discharges; inferred from δ13C).36 It could thus be speculated that the higher MeHg concentrations in mollusks were largely related to the methylation/demethylation process associated with dissolved marine organic carbon, while the IHg concentrations could be attributed to the influence of terrigenous organic carbon. Previous studies have found that the dissolved organic carbon (DOC) could bring about the photo-induced methylation of Hg2+ in water,37 and the photo-demethylation rate and extent of MeHg was also affected by DOC.38 Hence, DOC may play an important role in the accumulation of MeHg in mollusks, although microbial methylation of Hg2+ in sediment by microorganisms such as sulfate-reducing bacteria (SRB) was the commonly regarded source of MeHg to aquatic organisms. Due to the complex equilibrium between MeHg and IHg in natural aquatic ecosystems, more research is needed to identify the source and accumulation pathway of MeHg in mollusks and the carbon source may provide useful information.

Depleted δ13C, resulted from land-based river inputs, has been found at some coastal regions.39 The δ13C values in the surface sediments from Chinese Bohai Sea were in the range −26.00 to −22.10‰, with a mean of −23.10‰, reflecting a significant effect of terrigenous organic carbon.40 The land-based organic carbon source accounted for 30.7–85.7% (mean: 43.7%) of the total terrigenous organic carbon in recent years, with Yellow River input as the largest contributor.40 Since increased terrigenous organic carbon has been reported to associate with increased anthropogenic fluxes of Hg into some coastal area,41 the input of terrigenous organic carbon is expected to be correlated with the anthropogenic Hg discharge into the Chinese Bohai Sea area. It could be further speculated that IHg accumulated in mollusks are probably associated with the land-based anthropogenic fluxes of Hg into this region.

3.3. Influence of lipid contents

As an organic compound, MeHg has the potential of being accumulated in lipids. In this work, the lipid contents in all 92 mollusk samples collected in the year 2009 were determined (Table S1). The lipid contents of selected mollusks were in the range 1.98–18.8% (d.w.). Ost, having the highest levels of THg and MeHg among bivalve species, contained the highest lipid contents (15.71 ± 2.22%, d.w.). On the contrary, the two gastropods Rap and Nev, showing the highest levels of THg and MeHg, contained the lowest lipid content (6.99 ± 1.76% and 6.18 ± 1.72%, respectively).

The correlations between concentrations of Hg (including THg, MeHg and IHg) and lipid contents are shown in Fig. 5. Surprisingly, both THg and MeHg levels in mollusks were observed to slightly decrease with lipid contents, although both correlations were not significant (THg–lipid, R = 0.105, P = 0.759; MeHg–lipids, R = 0.456, P = 0.159). Differently, the concentrations of IHg had a significantly positive correlation with lipid contents (R = 0.656, P < 0.05). These results were obviously different from the previous report on the bioaccumulation of MeHg in fish, in which the levels of organic mercury were found to be significantly correlated with lipid contents.42 In order to find out the possible reasons for this, polynomial regression was further conducted between concentrations of THg and MeHg and lipid contents (Fig. 5 and S7). It was found that the polynomial correlations between both MeHg (R = 0.734, P < 0.05, Fig. 5) and THg (R = 0.629, P = 0.133, Fig. S7) concentrations and lipid contents were much more significant than the linear regression. This could be explained by the differences in mollusk species used in this study. As shown in Table S1, the two gastropods were obviously different from the bivalve species, containing the lowest lipid contents, but the highest concentrations of THg and MeHg. Mac had relatively lower lipid contents but relatively higher Hg concentrations as well. Including these three species (Rap, Nev and Mac) in the calculation dismissed the significant positive linear relationship between concentrations of THg and MeHg and lipid contents.


image file: c5ra02919h-f5.tif
Fig. 5 Relations between concentrations of Hg (THg, MeHg and IHg) and lipid content.

According to the above discussion, the gastropods had the highest TLs, as well as the highest THg and MeHg concentrations. This indicates that trophic transfer plays the dominant role in the accumulation of Hg among different mollusk species, while lipid contents contribute to the dissolution of MeHg in mollusks. The significant positive linear correlations between Hg concentrations and lipid contents could not be found in different TLs of mollusks, although they have been confirmed in the same or similar species of fish.42 It needs to be mentioned that the differences in the strength of interactions between Hg species and proteins via sulfhydryl groups may also contribute to the capability of Hg accumulation in these mollusk species. Hence, protein content in mollusks could have an effect on the accumulation of Hg, particularly MeHg since MeHg is known to have the highest ability of binding with proteins.43 As reported, MeHg is bound to myofibrillar proteins in fish muscles and correlated with muscle protein levels.44,45 In addition, the effect of selenium on MeHg accumulation could be another possible factor, because recent studies have found that selenium can reduce the accumulation of MeHg and enhance the elimination of MeHg in fish by decomposing MeHg into inorganic mercury selenide.46,47

3.4. Potential application for Hg monitoring

Since mollusks are widespread filter-feeding organisms and easily identified and collected, they have been employed for almost 30 years in the Mussel Watch Program (MWP) in the USA to monitor the contamination of trace metals and organic pollutants. Expensive and complex off-shore sampling design could be avoided using mollusks as indicators.48 The program has now been extended to other countries including China in the Asia-Pacific Mussel Watch Program (APMWP).48–50 Unfortunately, mollusks were seldom used to elucidate the spatial and temporal variations of Hg contamination, especially for Chinese Sea areas.

Numerous recognized species of mollusks that are highly diverse in body size, structure and feeding habit, have different abilities to accumulate Hg. Mollusks are widespread in the coastal regions of China, including the Chinese Bohai Sea area. Therefore, it is practicable to investigate whether mollusks could be applied as potential bioindicator for long-term monitoring of Hg pollution in Chinese coastal regions. Ost and Myt have been found to be more suitable indicators for contamination of some POPs than other mollusk species.25,33,34 Mya was most sensitive to organotin, in particular tributyltin, and was therefore an appropriate indicator for the contamination of organotin compounds.51 The possibility of using these mollusk species as bioindicators for Hg pollution in the Chinese Bohai Sea was evaluated in this study.

Among the 11 mollusk species, the two gastropods Nev and Rap contained the highest levels of THg and MeHg, the highest TLs, and the lowest lipid contents. The bivalve Ost had the next highest concentrations of THg and MeHg, the mid-level TLs, and the highest lipid contents. Referring to the reported concentration of Hg in the Bohai Sea water52,53 and the average concentration of THg in 29 surface sediments collected from the Bohai Sea, the bioaccumulation factors (BAFs) for THg and MeHg in each mollusk species were calculated (Table 2). The BAFs from water to mollusks (BAFs-W) were found to be in the ranges of 10[thin space (1/6-em)]100–170[thin space (1/6-em)]800 for THg and 31[thin space (1/6-em)]800–4[thin space (1/6-em)]477[thin space (1/6-em)]300 for MeHg. The BAFs from sediment to mollusks (BAFs-S) were in the range 0.7–11.9 for THg. Obviously, the BAFs were the highest in Rap, with BAFs-W ranging from 20[thin space (1/6-em)]000 to 170[thin space (1/6-em)]800 for THg and from 216[thin space (1/6-em)]700 to 4[thin space (1/6-em)]477[thin space (1/6-em)]300 for MeHg and BAFs-S ranging from 1.4 to 11.9 for THg. Therefore, Rap had relatively high abilities in accumulating Hg from seawater and sediment and would have sufficient sensitivity to reflect the extent of Hg contamination.

Table 2 Bioaccumulation factors (BAFs) for THg and MeHg in the 11 mollusks species collected during 2007–2012a
  Amu Chl Cyc Mac Mer Mya Myt Ost Sca Nev Rap Total
a BAFs-W, BAFs from water to mollusks; BAFs-S, BAFs from sediment to mollusks.b Data from ref. 52.c Data from ref. 53.
n 38 33 32 25 56 16 30 40 43 35 83 431
[thin space (1/6-em)]
BAFs-W (×103) for THg (THg concentration in seawater: 2.7 × 10⁻³ μg L−1)b
Mean 33.2 40.3 23.3 32.1 22.0 35.7 37.3 39.2 32.6 33.9 55.9 36.8
Median 33.2 34.7 22.0 22.9 20.0 30.2 29.9 38.3 28.3 29.5 46.4 29.9
Min 16.5 13.3 11.8 13.2 10.1 15.6 10.3 12.0 13.6 13.5 20.0 10.1
Max 83.9 90.5 49.1 75.5 52.0 80.6 101.7 89.7 78.4 96.7 170.8 170.8
[thin space (1/6-em)]
BAFs-W (×103) for MeHg (MeHg concentration in seawater: 6.6 × 10⁻⁵ μg L−1)c
Mean 542.4 586.4 307.6 493.9 337.9 516.7 303.0 698.5 290.9 760.6 1554.5 683.3
Median 456.1 521.2 290.9 256.1 263.6 387.9 218.2 647.0 231.8 668.2 1266.7 445.5
Min 137.9 145.5 83.3 83.3 53.0 112.1 39.4 192.4 31.8 187.9 216.7 31.8
Max 1836.4 1372.7 863.6 2572.7 904.5 1445.5 975.8 1477.3 1583.3 2101.5 4477.3 4477.3
[thin space (1/6-em)]
BAFs-S for THg (THg concentration in sediment: 38.7 μg L−1)
Mean 2.3 2.8 1.6 2.2 1.5 2.5 2.6 2.7 2.3 2.4 3.9 2.6
Median 2.3 2.4 1.5 1.6 1.4 2.1 2.1 2.7 2.0 2.1 3.2 2.1
Min 1.2 0.9 0.8 0.9 0.7 1.1 0.7 0.8 1.0 0.9 1.4 0.7
Max 5.9 6.3 3.4 5.3 3.6 5.6 7.1 6.3 5.5 6.7 11.9 11.9


The one-way ANOVA and hierarchical cluster analysis were adopted to assess the data set of both THg and MeHg. The results showed that Rap was significantly different from other mollusk species in the bioaccumulation of both THg and MeHg (P < 0.01, one-way ANOVA; Fig. S8). Moreover, Rap was widespread gastropod specie around Chinese Bohai Sea area, had strong reproducibility under natural conditions and was easily collected from coastal waters every year. Therefore, Rap could be used as a potential bioindicator for Hg monitoring in the Chinese Bohai Sea. In addition, our previous studies in 2002 found that Rap also showed the highest capacity of accumulating Cd (ref. 7) and significant correlations existed among concentrations of Cu, Zn Cd and Hg in mollusks.54 Accumulation of Cd in mollusks of the coastal US were found to be linked to salinity and upwelling phenomenon in coastal waters.55 Therefore, Rap may be used to investigate the accumulation of other heavy metals, such as Cd, and provide more information of heavy metal contamination.

4. Conclusion

This study found significant positive correlations between THg and MeHg contents and trophic levels (TLs), and demonstrated the biomagnification of MeHg and growth dilution of IHg in the trophic transfer of low trophic level mollusks. Although lipid contents were reported to have significant correlations with Hg concentrations in the same or similar species of fish, TLs showed more effect on Hg levels in mollusks than lipid contents. Rapana venosa (Rap) had relatively high abilities in accumulating Hg (MeHg in particular) from seawater and sediment and showed sufficient sensitivity to reflect the extent of Hg contamination. Therefore, Rap could be applied as a potential bioindicator for Hg pollution monitoring in the coastal regions of China. The results could help us to better understand the Hg uptake and transfer within marine food webs. However, laboratory culture and exposure test will be needed to identify the source and accumulation pathway of MeHg in mollusks and also to further investigate the fundamental reasons why Rap had high accumulation abilities for Hg, such as genetic constitution.

Acknowledgements

This work was supported by the National Basic Research Program of China (2013CB430004), the National Natural Science Foundation of China (41422306 and 21120102040), the Strategic Priority Research Program of the Chinese Academy of Sciences (XDB14010400), and the Young Scientists Fund of RCEES (RCEES-QN-20130007F).

References

  1. V. L. S. Louis, A. E. Derocher, I. Stirling, J. A. Graydon, C. Lee, E. Jocksch, E. Richardson, S. Ghorpade, A. K. Kwan, J. L. Kirk, I. Lehnherr and H. K. Swanson, Environ. Sci. Technol., 2011, 45, 5922–5928 CrossRef PubMed.
  2. G. Stern and R. Macdonald, Environ. Sci. Technol., 2005, 39, 4707–4713 CrossRef CAS.
  3. J. P. Cheng, L. L. Gao, W. C. Zhao, X. J. Liu, M. Sakamoto and W. H. Wang, Sci. Total Environ., 2009, 407, 2625–2630 CrossRef CAS PubMed.
  4. Y. Lin, R. Vogt and T. Larssen, Environ. Toxicol. Chem., 2012, 31, 2431–2444 CrossRef CAS PubMed.
  5. K. Pan and W. X. Wang, Sci. Total Environ., 2012, 421–422, 3–16 CrossRef CAS PubMed.
  6. J. W. Farrington, E. D. Goldberg, R. W. Risebrough, J. H. Martin and V. T. U. S. Bowen, Environ. Sci. Technol., 1983, 17, 490–496 CrossRef CAS PubMed.
  7. L. N. Liang, B. He, G. B. Jiang, Y. D. Chen and Z. W. Yao, Sci. Total Environ., 2004, 324, 105–113 CrossRef CAS PubMed.
  8. K. L. Foster, G. A. Stern, M. A. Pazerniuk, B. Hickie, W. Walkusz, F. Y. Wang and R. W. Macdonald, Environ. Sci. Technol., 2012, 46, 12952–12959 CrossRef CAS PubMed.
  9. WHO (World Health Organization), Environmental Health Criteria #1: Mercury, Geneva, 1976 Search PubMed.
  10. WHO (World Health Organization), Environmental Health Criteria #101: Methylmercury, Geneva, 1990 Search PubMed.
  11. E. D. Stein, Y. Cohen and A. M. Winer, Crit. Rev. Environ. Sci. Technol., 1996, 26, 1–43 CrossRef CAS PubMed.
  12. I. Andersson, H. Parkman and A. Jernelov, Limnologica, 1990, 20, 347 CAS.
  13. R. E. Farrell, J. J. Germida and P. M. Huang, Appl. Environ. Microbiol., 1990, 56, 3006 CAS.
  14. H. U. Riisgard and S. Hansen, Mar. Ecol.: Prog. Ser., 1990, 62, 259 CrossRef.
  15. T. G. Seixas, I. Moreira, S. Siciliano, O. Malm and H. A. Kehrig, Bull. Environ. Contam. Toxicol., 2014, 92, 274–278 CrossRef CAS PubMed.
  16. G. L. Lescord, K. A. Kidd, J. L. Kirk, N. J. O'Driscoll, X. Wang and D. C. G. Muir, Sci. Total Environ., 2015, 509–510, 195–205 CrossRef CAS PubMed.
  17. M. G. Clayden, L. M. Arsenault, K. A. Kidd, N. J. O'Driscoll and M. L. Mallory, Sci. Total Environ., 2015, 509–510, 206–215 CrossRef CAS PubMed.
  18. E. Kim, H. Kim, K. Shin, M. Kim, S. R. Kundu, B. Lee and S. Han, Environ. Toxicol. Chem., 2012, 31, 1254–1263 CrossRef CAS PubMed.
  19. A. T. Fisk, K. A. Hobson and R. J. Norstrom, Environ. Sci. Technol., 2001, 35, 732–738 CrossRef CAS.
  20. H. Hop, K. Borgå, G. W. Gabrielsen, L. Kleivane and J. U. Skaare, Environ. Sci. Technol., 2002, 36, 2589–2597 CrossRef CAS.
  21. X. S. Jin, X. J. Shan, X. S. Li, J. Wang, Y. Cui and T. Zuo, Earth Sci., 2013, 56, 366–374 Search PubMed.
  22. Z. Z. Sun, J. Zhou, Z. L. Zhao, Y. F. Xu, W. B. Gao, S. Zhuang, B. Chen, J. Wang, W. Yan and C. H. Wang, Mar. Sci., 2012, 36, 44–53 Search PubMed.
  23. USEPA, Method 7473: Mercury in Solids and Solutions by Thermal Decomposition Amalgamation, and Atomic Absorption Spectrophotometry, 2007 Search PubMed.
  24. USEPA, Method 1630: Methyl Mercury in Water by Distillation, Aqueous Ethylation, Purge and Trap, and CVAFS. Draft January 2001, U.S. Environmental Protection Agency, Office of Water, Office of Science and Technology Engineering and Analysis Division (4303), Washington, DC 20460, 2001, pp. 1–41 Search PubMed.
  25. B. Yuan, T. Wang, N. L. Zhu, K. G. Zhang, L. X. Zeng, J. J. Fu, Y. W. Wang and G. B. Jiang, Environ. Sci. Technol., 2012, 46, 6489–6496 CrossRef CAS PubMed.
  26. CNSA (Chinese National Standard Agency), Maximum levels of contaminants in foods (in Chinese), GB 2762–2012, 2012.
  27. J. P. Coelho, M. Rosa, E. Pereira, A. Duarte and M. A. Pardal, Estuarine, Coastal Shelf Sci., 2006, 69, 629–635 CrossRef PubMed.
  28. J. P. Coelho, A. C. Duarte, M. A. Pardal and M. E. Pereira, Ecol. Indic., 2014, 46, 447–453 CrossRef CAS PubMed.
  29. L. N. Liang, J. B. Shi, B. He, G. B. Jiang and C. G. Yuan, J. Agric. Food Chem., 2003, 51, 7373–7378 CrossRef CAS PubMed.
  30. Y. W. Wang, X. M. Li, A. Li, T. Wang, Q. H. Zhang, P. Wang, J. J. Fu and G. B. Jiang, Environ. Sci. Technol., 2007, 41, 6026–6032 CrossRef CAS.
  31. Y. Wan, J. Y. Hu, L. H. An, W. An, M. Yang, M. Itoh, T. Hattori and S. Tao, Chin. Sci. Bull., 2005, 50, 1021–1025 CrossRef CAS.
  32. Y. Wan, J. Y. Hu, M. Yang, L. H. An, W. An, X. H. Jin, T. Hattori, S. Masunaga and M. Itoh, Environ. Sci. Technol., 2005, 39, 2417–2425 CrossRef CAS.
  33. Y. W. Wang, T. Wang, A. Li, J. J. Fu, P. Wang, Q. H. Zhang and G. B. Jiang, Environ. Sci. Technol., 2008, 42, 7159–7165 CrossRef CAS.
  34. N. L. Zhu, A. Li, T. Wang, P. Wang, G. B. Qu, T. Ruan, J. J. Fu, B. Yuan, L. X. Zeng, Y. W. Wang and G. B. Jiang, Environ. Sci. Technol., 2012, 46, 7174–7181 CrossRef CAS PubMed.
  35. A. Sobek, G. Cornelissen, P. Tiselius and O. Gustafsson, Environ. Sci. Technol., 2006, 40, 6703–6708 CrossRef CAS.
  36. D. M. Schell, B. A. Barnett and K. A. Vinette, Mar. Ecol.: Prog. Ser., 1998, 162, 11–23 CrossRef CAS.
  37. S. D. Siciliano, N. J. O′Driscoll and R. Tordon, et al., Environ. Sci. Technol., 2005, 39, 1071–1077 CrossRef CAS.
  38. V. Perrot, M. V. Pastukhov, V. N. Epov, S. Husted, O. F. X. Donard and D. Amouroux, Environ. Sci. Technol., 2012, 46, 5902–5911 CrossRef CAS PubMed.
  39. Z. Z. A. Kuzyk, R. W. Macdonald, J.-É. Tremblay and G. A. Stern, Cont. Shelf Res., 2010, 30, 163–176 CrossRef PubMed.
  40. S. W. Sun, M.S. Thesis, Ocean University of China, 2012.
  41. A. Hare, G. A. Stern, Z. Z. A. Kuzyk, R. Macdonald, S. C. Johannessen and F. Wang, Environ. Sci. Technol., 2010, 44, 5805–5811 CrossRef CAS PubMed.
  42. M. Pal and M. Ghosh, Environ. Monit. Assess., 2013, 185, 31–37 CrossRef CAS PubMed.
  43. M. Xu, X. W. Yan, Q. Q. Xie, L. M. Yang and Q. Q. Wang, Anal. Chem., 2010, 82, 1616–1620 CrossRef CAS PubMed.
  44. Y. S. Gong, D. P. Krabbenhoft, L. P. Ren, B. Egelandsdal and M. P. Richards, J. Agric. Food Chem., 2011, 59, 11050–11057 CrossRef CAS PubMed.
  45. D. J. Kutscher, A. Sanz-Medel and J. Bettmer, Metallomics, 2012, 4, 807–813 RSC.
  46. D. Y. Yang, Y. W. Chen, J. M. Gunn and N. Belzile, Environ. Rev., 2008, 16, 71–92 CrossRef CAS PubMed.
  47. H. Amlund, A. Lundebye, D. Boyle and S. Ellingsen, Aquat. Toxicol., 2015, 158, 211–217 CrossRef CAS PubMed.
  48. E. D. Goldberg, Mar. Pollut. Bull., 1975, 6, 111 CrossRef.
  49. K. L. Kimbrough, W. E. Johnson, G. G. Lauenstein, J. D. Christensen and D. A. Apeti, MDNOAA technical memorandum NOS NCCOS, Silver Spring, 2008, vol. 74, p. 105 Search PubMed.
  50. I. Monirith, D. Ueno, S. Takahashi, H. Nakata, A. Sudaryanto and A. Subramanian, et al., Mar. Pollut. Bull., 2003, 46, 281–300 CrossRef CAS.
  51. Q. F. Zhou, J. B. Zhang, J. J. Fu, J. B. Shi and G. B. Jiang, Anal. Chim. Acta, 2008, 606, 135–150 CrossRef CAS PubMed.
  52. Z. J. Ci, X. S. Zhang, Z. W. Wang and Z. C. Niu, Mar. Chem., 2011, 126, 250–255 CrossRef CAS PubMed.
  53. S. F. Wang, Y. F. Jia, S. Y. Wang, X. Wang, H. Wang, Z. X. Zhao and B. Z. Liu, Appl. Geochem., 2009, 24, 1702–1711 CrossRef CAS PubMed.
  54. Y. W. Wang, L. N. Liang, J. B. Shi and G. B. Jiang, Environ. Int., 2005, 31, 1103–1113 CrossRef CAS PubMed.
  55. D. A. Apeti, G. G. Lauenstein and G. F. Riedel, Mar. Pollut. Bull., 2009, 58, 1016–1024 CrossRef CAS PubMed.

Footnote

Electronic supplementary information (ESI) available: Detailed experimental procedure and supporting data. See DOI: 10.1039/c5ra02919h

This journal is © The Royal Society of Chemistry 2015