Influence of hollow carbon microspheres of micro and nano-scale on the physical and mechanical properties of epoxy syntactic foams†
Xiudi Li,
Ming Zhu,
Xuemei Tang,
Qingjie Zhang,
Xiaoping Yang and
Gang Sui*
State Key Laboratory of Organic-Inorganic Composites, Beijing University of Chemical Technology, Beijing 100029, China. E-mail: suigang@mail.buct.edu.cn; Fax: +86 10 64412084; Tel: +86 10 64427698
First published on 29th May 2015
Abstract
Epoxy syntactic foams were prepared by introducing hollow carbon microspheres (HCMs) of micro and nano-scale. Based on the surface structure analysis of the HCMs, the effects of HCM content and particle size on the mechanical properties, dimensional stability, thermal conductivity, thermal stability and dielectric properties of the epoxy foam were investigated. The density of the epoxy foam gradually declined with the increase of the micro-scale HCM (M-HCM) content up to 9 wt%, and the compression strength of the epoxy foam just decreased slightly, while the compression modulus and flexural modulus were enhanced continuously. When 0.5 wt% and 1 wt% of HCMs were involved, the reinforcing effect of nano-scale HCMs (N-HCMs) was superior to the M-HCMs. The compression strength of the N-HCM/epoxy foams was almost equivalent to the neat epoxy, while the flexural strength of the N-HCM samples exhibited an obvious superiority. The dimensional stability and thermal stability of the epoxy foams were also improved with the addition of HCMs. Besides, the introduction of the M-HCMs and N-HCMs gave rise to different effects on the thermal conductivity, electrical conductivity and dielectric constant of the resulting epoxy foams due to the diversity in the interfacial interactions and microstructure. These results indicate that the HCM/epoxy syntactic foams show potential for application in multifunctional materials that are lightweight and of high rigidity.
Introduction
Syntactic foam is a kind of composite material consisting of hollow fillers and a polymer matrix. In general, the hollow fillers can be made of glass, carbon, ceramics, polymers, and even metals.1,2 Dispersion of the hollow fillers in a matrix can create a porous material system with a closed cell. By changing the amount of hollow particles, different densities and thus microstructure of the syntactic foam can be produced.1–3 Syntactic foam has a variety of material features, including low density, high specific strength, high specific modulus, low moisture absorption, and superior dielectric properties, which makes it more suitable for application in aviation, marine, energy, construction and electronics industries compared to solid particle-filled composites, open cell structured foams, and other low density materials.4–7In recent years, many researchers have been concerned with the investigation of syntactic foam. The thermal properties and electrical properties are important for syntactic foam used as circuit substrates and packaging materials. Yung8 and Park9 studied the thermal stabilities and dielectric properties of hollow glass microsphere (HGM) filled epoxy composites. The results showed that the dielectric constant, dielectric loss and coefficient of thermal expansion (CTE) of the composites decreased simultaneously with increasing HGM content. However, the thermal conductivity of the composites decreased due to the addition of HGMs with an inner gas structure. Heat transfer in a timely manner is very critical for electronic materials. The vital issue of preparing syntactic foam with a good heat dissipation function ensures the high thermal conductivity of the hollow particle fillers. Good mechanical properties are also essential to the application of syntactic foam. Gupta et al.10–15 studied the mechanical properties of different kinds of hollow glass particle filled vinyl ester resins. The results suggested that the mechanical properties of the syntactic foam were dependent on the type of the hollow particles, and decreased with the increasing volume fraction of the hollow fillers. Wouterson2 studied the fracture toughness of syntactic foam produced by mechanical dispersion of three different types of microspheres, Scotchlite™ K15 and K46 glass bubbles, and Phenoset BJO-093 hollow phenolic microspheres. The studies also revealed that the tensile, flexural and compressive strength of the syntactic foam decreased with the increase of hollow particle content. Due to the inferior mechanical properties and low thermal conductivity, the application scope of the syntactic foam is limited.
Hollow carbon microspheres (HCMs) consist of outer stiff carbon and inner gas, and possess some common characteristics of hollow particles such as light weight, low dielectric constant and excellent sound insulation. In addition, different from HGMs, HCMs have high thermal conductivity and a high specific modulus. Zhang et al. reported the mechanical properties of epoxy syntactic foams containing 30 vol% HCMs with sizes ranging from 10–50 μm lately.16 The flexural strength and compressive yield strength of the epoxy syntactic foams were comparable to that of the neat epoxy by adopting polydopamine-coated HCMs. In the previous research, most of the syntactic foams were prepared by introducing micron-scale hollow particles. The mechanical properties of the polymer syntactic foams usually declined with the decreased material density, even when complicated procedures were involved to prepare and treat the fillers. If nano-scale gas pores are introduced into the polymer matrix, the pore size is smaller than the critical dimension of cracks, which already exist in the polymer matrix, and then the material density could be reduced while maintaining the essential mechanical properties.17–19 Although the polymer foams with nano-scale pores have a lot of superior performances and could be widely applied, the preparation technologies are very limited.19–21
In this work, micro and nano-scale HCMs were fabricated using a template method and HCM/epoxy syntactic foams with different HCM content and particle sizes were prepared. The variety in the particle size and content of HCMs brought about different impacts on the mechanical properties, dimensional stability, thermal conductivity, thermal stability and dielectric properties of the resulting epoxy foam. These studies suggest that the HCM/epoxy syntactic foams may find promising applications in lightweight and high rigidity materials for advanced electronic devices.
Experimental
Materials
The diglycidyl ether of bisphenol A (DGEBA, Shell EPON® 828) was used as the epoxy matrix. Aromatic amine curing agents, including 3,3′-dimethyl-4,4′-diamino dicyclohexyl methane (DMDC) and diethyl methyl benzene diamine (DETDA), were obtained from the Tianjin Synthetic Material Research Institute, China. The mixed ratio of DMDC and DETDA by weight was 1![[thin space (1/6-em)]](https://www.rsc.org/images/entities/char_2009.gif) :
:![[thin space (1/6-em)]](https://www.rsc.org/images/entities/char_2009.gif) 2. The amounts of epoxy/amine in each system were of equivalent stoichiometry to form completely cured epoxide-amine cross-linking networks. Styrene, concentrated sulfuric acid and absolute ethyl alcohol of AR grade were purchased from Beijing Chemicals Co., China. All chemicals were used without further purification. A-stage phenol-formaldehyde resin (PF) was provided by the Beijing FRP research and design institute, China.
2. The amounts of epoxy/amine in each system were of equivalent stoichiometry to form completely cured epoxide-amine cross-linking networks. Styrene, concentrated sulfuric acid and absolute ethyl alcohol of AR grade were purchased from Beijing Chemicals Co., China. All chemicals were used without further purification. A-stage phenol-formaldehyde resin (PF) was provided by the Beijing FRP research and design institute, China.
Preparation of the HCMs
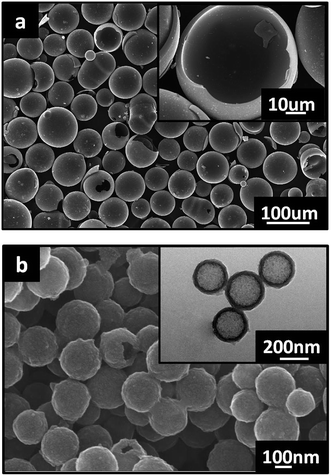
The HCMs were fabricated using a template method.22 The polystyrene (PS) spheres used as templates were synthesized using emulsifier-free emulsion polymerization according to the procedure described in the literature.23 The dry PS particles (2 g) were then dispersed in 60 mL of concentrated sulfuric acid by stirring at 40 °C for 4 h, in which PS particles were modified by sulfonation, leading to the formation of sulfonic acid groups on the surface of the PS particles. After centrifugation and washing processes, 1 g of sulfonated PS particles was dispersed in 200 mL of absolute ethyl alcohol. Subsequently, 3 g of PF was diluted in 20 ml absolute ethyl alcohol, and then the solution of PF was slowly dropped into the above PS mixture for 4 h of polymerization. The obtained PS@PF core–shell product was put into a tubular furnace, heated to 450 °C at a rate of 1 °C min−1 and held at this temperature for 30 min to remove the PS core completely, and then heated to 800 °C at a rate of 2 °C min−1 and held at this temperature for 2 h to turn the PF shells into carbon shells. In order to investigate the influence of particle size on the physical and mechanical properties of the composite, two kinds of hollow carbon microspheres with a different particle size were produced, M-HCM (the particle diameter range of M-HCM is 20–100um) and N-HCM (the particle diameter range of N-HCM is about 300–500 nm), as shown in Fig. 1. To avoid the effects of the chemical reagents on the analysis results, the purified and dried hollow carbon microspheres were used, and no other surface treatments were carried out in the experiments.Preparation of the HCM/epoxy foams
For preparation of the HCM/epoxy foams, HCMs of different loading were added into the epoxy resin and the mixture was stirred at 60 °C for 3 h. Then the curing agent was added and further mixed with the HCM/epoxy system at room temperature for 2 h. The uniform mixture was degassed for about 15 min under vacuum conditions at 80 °C. Finally, the mixture was poured into a mold, and cured via a thermal cycle (100 °C for 1 h, 120 °C for 3 h, 150 °C for 2 h). In this work, 0.5–9 wt% of M-HCMs was added into the epoxy matrix. Considering the potential aggregation of nanoparticles in the polymer matrix, only 0.5 wt% and 1 wt% N-HCM/epoxy samples were prepared and used for performance analysis. As a comparison, the neat epoxy samples without HCMs were cured under the same thermal cycle as that of the HCM/epoxy foams.Analysis and characterization
The morphology and surface chemical characteristics of the HCMs were analyzed using scanning electron microscopy (SEM, Hitachi S4700, Japan), transmission electron microscopy (TEM, H-800-1, Japan), Fourier transform infrared spectroscopy (FT-IR, Nexus 670, USA), Raman spectroscopy (JY-HR 800, French) and X-ray photoelectron spectroscopy (XPS, ESCALAB 250Xi, USA). The density of the epoxy resin and HCM/epoxy foams was measured using an electronic densimeter (DH-300, China). The flexural properties of the epoxy resin and HCM/epoxy foams were investigated using a tensile testing machine (Instron 1121, UK), according to ASTM D790. The speed of the crosshead was 1 mm min−1. The compression properties of the epoxy resin and HCM/epoxy foams were investigated using a mechanical testing machine (Instron 5567, UK), according to ASTM D695. The speed of the crosshead was 1.5 mm min−1. Ten specimens were measured in each case, and the average and standard deviation values were calculated. The fracture surfaces of the epoxy resin and HCM/epoxy foams were observed by SEM (Hitachi S4700, Japan). All samples were sputter-coated with gold to avoid the electric charge. The CTE value of the epoxy resin and HCM/epoxy foams was measured using a thermomechanical analyzer (TMA, TA Q400, USA) with an expansion mode at a heating rate of 5 °C min−1 under a nitrogen purge. The thermal conductivity of the epoxy resin and HCM/epoxy foams was detected using a thermal conductivity analyzer (EKO HC-74, USA). The samples were cylindrical shaped, 60 mm in diameter, and 5 mm in thickness. The AC resistivity and dielectric properties of the epoxy resin and HCM/epoxy foams were measured in an Aligent 4294A impedance analyzer with a frequency range of 102 to 107 Hz at room temperature. For these measurements, silver paste was sputtered onto both sides of the disc-shaped samples, and the diameter of the samples was 4 mm and the thickness was 0.5 mm.Results and discussion
Surface structure analysis of the HCMs
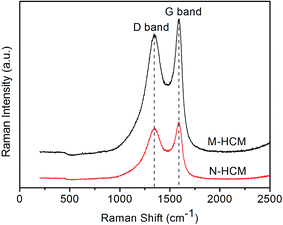
The Raman spectra of the M-HCMs and N-HCMs are exhibited in Fig. 2. Both the M-HCMs and N-HCMs display two characteristic peaks. The absorption peak near 1350 cm−1 (D band) can be assigned to the disordered graphite structures, and the absorption peak around 1580 cm−1 (G band) is derived from concentric cylinders of graphite layers. Although the Raman spectrum of the M-HCMs showed remarkable intensification of the D and G bands, there was no pronounced variation of peak form or location in the D and G bands between the M-HCMs and N-HCMs. Furthermore, the ratio of the intensity of the D band to that of the G band (R value, the ratio of the integral area of the corresponding peaks) can be regarded as a reasonable index to provide quantitative information about the microstructure of carbon materials. A lower R value denotes a better graphitic structure in HCMs.27 The Raman data analysis results are presented in Table 1. The R values of the M-HCMs and N-HCMs were very similar, which indicated that there were no significant differences between the graphitic structures in the two kinds of carbon microspheres.| The integral area of the D band | The integral area of the G band | R | |
|---|---|---|---|
| M-HCMs | 3.23 × 10⁶ | 1.35 × 10⁶ | 2.39 |
| N-HCMs | 1.38 × 10⁶ | 5.63 × 10⁵ | 2.45 |
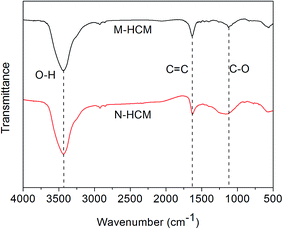
FT-IR spectra of the M-HCMs and N-HCMs are illustrated in Fig. 3. As shown in Fig. 3, three characteristic bands appeared at 3445 cm−1, 1630 cm−1, and 1120 cm−1, corresponding to the O–H, C![[double bond, length as m-dash]](https://www.rsc.org/images/entities/char_e001.gif) C, and C–O stretching vibrations on the surface of both the M-HCMs and N-HCMs, respectively.6 This suggests that there exists many O–H, C
C, and C–O stretching vibrations on the surface of both the M-HCMs and N-HCMs, respectively.6 This suggests that there exists many O–H, C![[double bond, length as m-dash]](https://www.rsc.org/images/entities/char_e001.gif) C and C–O groups on the surface of the HCMs which is beneficial for good interface bonding in the HCM/epoxy foams. In order to further prove the existence of O–H, C
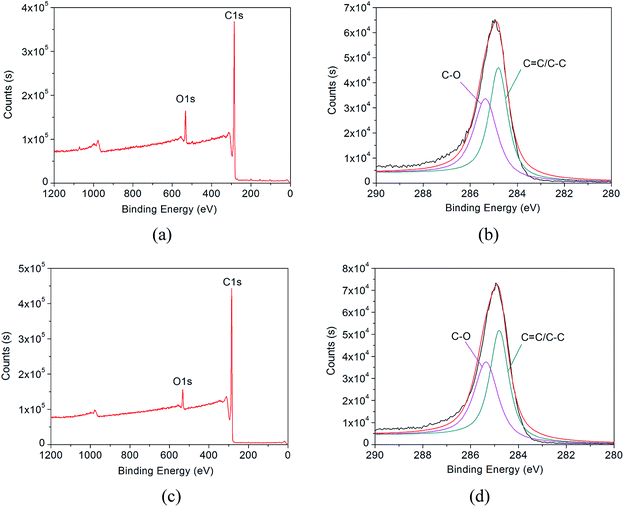
C and C–O groups on the surface of the HCMs which is beneficial for good interface bonding in the HCM/epoxy foams. In order to further prove the existence of O–H, C![[double bond, length as m-dash]](https://www.rsc.org/images/entities/char_e001.gif) C and C–O groups, the M-HCMs and N-HCMs were also examined using XPS analysis as shown in Fig. 4. Both the M-HCMs and N-HCMs showed C1s and O1s peaks (Fig. 4(a) and (c)). The C1s XPS spectrum of the M-HCMs and N-HCMs can be deconvoluted into two peaks with binding energies of 284.86 eV (corresponding to sp2 and sp3 hybridized carbon components (C
C and C–O groups, the M-HCMs and N-HCMs were also examined using XPS analysis as shown in Fig. 4. Both the M-HCMs and N-HCMs showed C1s and O1s peaks (Fig. 4(a) and (c)). The C1s XPS spectrum of the M-HCMs and N-HCMs can be deconvoluted into two peaks with binding energies of 284.86 eV (corresponding to sp2 and sp3 hybridized carbon components (C![[double bond, length as m-dash]](https://www.rsc.org/images/entities/char_e001.gif) C/C–C)) and 285.35 eV (corresponding to C–O component) (Fig. 4(b) and (d)),24 which agreed with the results of FT-IR spectroscopy.
C/C–C)) and 285.35 eV (corresponding to C–O component) (Fig. 4(b) and (d)),24 which agreed with the results of FT-IR spectroscopy.
The surface analysis of the carbon microspheres indicated that there were no significant differences in the graphitic structure or chemical groups between the two kinds of carbon microspheres.
Mechanical properties of the HCM/epoxy foams
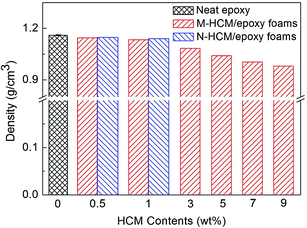
The density of the neat epoxy and HCM/epoxy foams was measured and the results are shown in Fig. 5. It can be seen that the density of the epoxy foams gradually declined with the increase of HCM content, due to the introduction of a large number of closed pores. Therefore, the utilization of HCMs in epoxy resins can lead to lightweight foams. When 0.5 wt% and 1 wt% of HCMs were added into the epoxy matrix, the densities of the M-HCM/epoxy foams with a higher volume fraction of gas pores were slightly lower than those of the N-HCM filled samples.Fig. 6 shows the compression properties of the neat epoxy and HCM/epoxy foams. Although the addition of hollow fillers introduced some voids and weakened the structure in the polymer matrix, the circular pores can slow down the cracking damage and a rigid carbon shell may also reinforce the epoxy resin. As a result, the compression strength of the M-HCM/epoxy foams just decreased slightly with the increase of M-HCM content. Compared to the neat epoxy samples, the compression strength of the epoxy foams varied from 134.7 MPa to 126.4 MPa when the M-HCM content reached 9 wt%. At the loadings of 0.5 wt% and 1 wt% HCMs, the compression strength of the N-HCM/epoxy foams was higher than that of the M-HCM-filled samples, almost equivalent to the neat epoxy. At the same time, the compression modulus of the M-HCM/epoxy foams was enhanced continuously with the increasing of M-HCM content. After adding 9 wt% of M-HCMs, the compression modulus of the epoxy foams increased from 1499 MPa to 1780 MPa, exhibiting an enhancement of 18.7%. The HCMs in the epoxy networks can effectively enhance the stiffness of the foams, leading to the increased compression modulus. When the same loading of HCMs were involved, a better reinforcement effect and stiffer epoxy foams were achieved by adding N-HCMs. This result can be attributed to the smaller particle size of the N-HCMs, which resulted in a greater interfacial area and nano-level interaction between the HCMs and polymer chains.
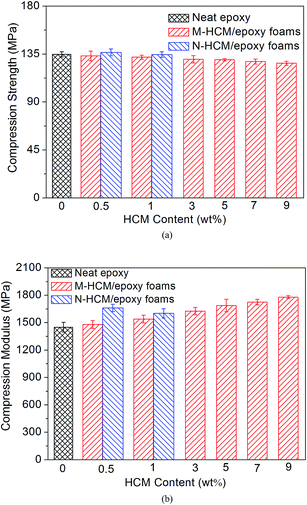 | ||
| Fig. 6 The compression properties of the neat epoxy and HCM/epoxy foams: (a) compression strength; (b) compression modulus. | ||
The flexural properties of the neat epoxy and HCM/epoxy foams are demonstrated in Fig. 7. Like the compression modulus, the flexural modulus of the M-HCM/epoxy foams was enhanced continuously with the increased loading of the M-HCMs, which indicated a stiffness effect of the rigid HCM particles in the resulting foams.2,10 Compared to the neat epoxy samples, the flexural modulus of the 9 wt% M-HCM/epoxy foams exhibited an enhancement from 2290 MPa to 2675 MPa, an improvement of 16.8%. But at the same time the flexural strength of the epoxy foams showed a downward trend with the increased M-HCM content. This phenomenon could be explained by the fact that the increased HCM amount results in a higher void content and less effective dispersion of the particles without any chemical treatment involved. However, when 0.5 wt% and 1 wt% of N-HCMs were introduced into the epoxy matrix, the flexural strength of the resulting foams increased to 115.9 MPa and 92.3 MPa, respectively, even higher than that of the neat epoxy samples. The overall interaction between the HCMs and the matrix largely depends on the surface area of the fillers. With the decrease of particle size, the relative interface area between the HCMs and polymer chains increases. The nanoscale circular pores will not become weak spots in the material structure, but also can restrain the crack propagation. Therefore, the N-HCMs can have an effective reinforcement function in the epoxy matrix.
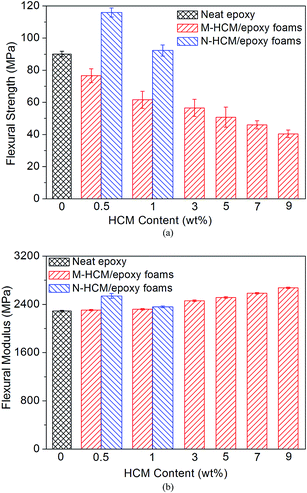 | ||
| Fig. 7 The flexural properties of the neat epoxy and HCM/epoxy foams: (a) flexural strength; (b) flexural modulus. | ||
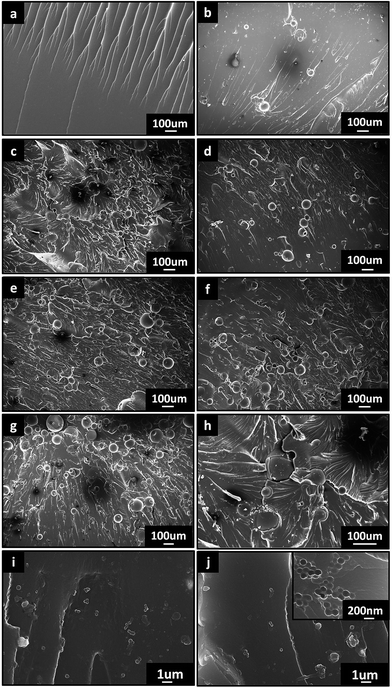
Fig. 8 shows the fracture surface of the neat epoxy and HCM/epoxy foams after three-point bending tests. There were some regular river patterns and branches on the fracture surface of the neat epoxy material (Fig. 8(a)). For the M-HCM/epoxy foams, many micron-scale spheres can be observed on the fracture surface. The patterns and branches became more sophisticated and cluttered on the fracture surface with the increased loading of HCMs (Fig. 8(b)–(f)), which can provide the resistance to crack propagation. The fracture mode belongs to that of rigid particle reinforced-materials instead of the rupture and collapse of pores in the traditional foam plastics. As illustrated in Fig. 8(g), when a crack propagated through the matrix and encountered a HCM, the crack detoured around the blockage and deflection of the crack tip occurred after passing multiple particles. This led to a zigzag propagation path of the crack and improved the ability of the polymer matrix to resist crack damage. Therefore, the introduction of HCMs can reduce the material density, and also maintain or even improve the mechanical properties of the polymer matrix. However, it can be seen that the carbon spheres exposed at the fracture surface are clean and smooth which denotes weak interfacial bonding between the M-HCMs and epoxy matrix. When the content of the M-HCMs was higher than 5 wt%, some carbon spheres began to touch each other (Fig. 8(e) and (f)), and formed local aggregations which would diminish the reinforcement function of the M-HCMs. In the 0.5 wt% N-HCM/epoxy foams, most of the carbon spheres were dispersed uniformly in the fracture surface of the epoxy matrix (Fig. 8(i)), while there was a small amount of aggregation in the 1 wt% N-HCM/epoxy samples (Fig. 8(j)). As shown in the inset image of Fig. 8(j), it can be noticed that there exists some broken N-HCMs on the fracture surface, which means that the nano-level interfacial bonding was stronger than that in the M-HCM/epoxy foams. Compared to the 1 wt% N-HCM samples, a better reinforcement effect was achieved by adding 0.5 wt% N-HCMs due to the better dispersion of the nanoparticles in the polymer matrix. It is expected that further enhancement of the strength and modulus of the HCM/epoxy foams would occur by adopting more effective dispersing methods and pretreatment technology for the HCMs.
Dimensional stability of the HCM/epoxy foams
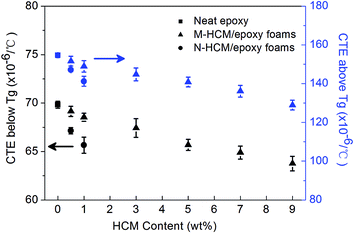
The dimensional stability of the neat epoxy and HCM/epoxy foams was tested and the results are shown in Fig. 9. The CTE value of the neat epoxy was 69.83 × 10⁻⁶/°C and 154.68 × 10⁻⁶/°C below and above Tg, respectively. After the HCM particles have been dispersed in the epoxy matrix, these rigid additives can retard the thermal motion of the epoxy macromolecules with the rising temperature. Therefore, the addition of the HCMs contributed to the decreasing thermal expansion of the epoxy foams, which led to the thermally dimensional-stable structures. With increased HCM loading, the volume fraction of epoxy resin in the foams decreased accordingly, and thus, it is reasonable to observe that the CTE values of the epoxy foams decreased slightly with the increase of HCM loading. When 9 wt% of M-HCMs was involved, the CTE values below and above Tg for the epoxy foams fell to 63.76 × 10⁻⁶/°C and 128.96 × 10⁻⁶/°C, respectively. At the same time, the epoxy foams containing 0.5 wt% and 1 wt% N-HCMs exhibited a lower CTE value both below and above Tg compared to that of the samples with the same loading of M-HCMs. This phenomenon can also be attributed to the smaller particle size of the N-HCMs, which results in stronger interfacial interactions between the N-HCMs and the epoxy matrix.Thermal conductivity of the HCM/epoxy foams
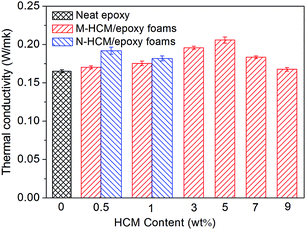
Fig. 10 reveals the thermal conductivity of the HCM/epoxy foams. It can be observed that the thermal conductivity of the epoxy foams shows a generally increasing trend with the increasing content of M-HCMs up to 5 wt%. As shown Fig. 10, the thermal conductivity of the neat epoxy is 0.165 W mK−1, and then this increased for the foams to 0.206 W mK−1 for the 5 wt% M-HCM/epoxy samples. Because the HCMs consist of inner gas and a stiff carbon shell, the increase of the thermal conductivity of the M-HCM/epoxy foams can be attributed to the high thermal conductivity of the carbon shell around the HCMs.25,26 When the content of the M-HCMs was beyond 5 wt%, the thermal conductivity of the epoxy foams began to decline. The main reason is likely due to the increased inner gas content and degraded dispersion of the HCMs in the epoxy foams which affected the formation of the effective heat transport channel.27,28 Moreover, the scattering of phonons by interaction with the surrounding material also caused the loss of thermal conduction.29 Compared to the M-HCM/epoxy foams, the thermal conductivity of the N-HCM/epoxy foams is higher at the same loading of HCMs. When the same content of the fillers was involved, the N-HCMs can provide the larger interface area with the epoxy resin and transferred heat more effectively. This reflected that the size and physical characteristics of additives do have an impact on the thermal conduction of the polymer foams.Thermal stability of the HCM/epoxy foams
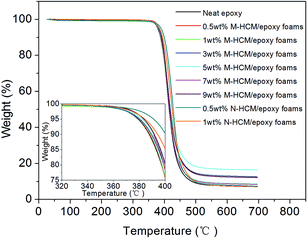
The thermogravimetric analysis (TGA) of the HCM/epoxy foams with various HCM content and particle sizes was conducted in a nitrogen atmosphere. Fig. 11 shows the TGA curves of the neat epoxy and HCM/epoxy foams. By comparing the weight loss as a function of temperature, the effect of the HCMs on the thermal stability of the epoxy matrix was analyzed. The TGA curves indicate that the thermal degradation of all samples consisted of only a single weight loss step between 300 and 500 °C, which is in accordance with the random chain scission mechanism. It can be seen from the inset image in Fig. 11 that the onset temperature of the rapid degradation region for the HCM/epoxy foams was elevated slightly, compared to the neat epoxy. At the same temperature, the thermal stability of the epoxy matrix can be improved by adding HCMs. The HCMs dispersed in the epoxy matrix can impose a restriction on the motion of the polymer chains, and conduct heat homogeneously and avoid heat concentration. Therefore, the thermal stability of the epoxy matrix was improved by adding the HCMs. Moreover, when the particle size of the HCMs decreased to nanoscale, the relative interface area between the HCMs and polymer chains increased. The N-HCMs in the epoxy resin can exert a greater restriction on the motion of the polymer chains, resulting in a more effective retardation of the thermal decomposition in the foams.30 The dispersion of the nanoscale particles in the 0.5 wt% N-HCM/epoxy foams was better than that in the 1 wt% N-HCM samples, and can more obviously improve the thermal stability of the resulting epoxy foams.Dielectric properties of the HCM/epoxy foams
In Fig. 12, the AC conductivity, dielectric constant and dielectric loss factor of the HCM/epoxy foams with different particle sizes and content of HCMs under various applied sweep frequencies are shown.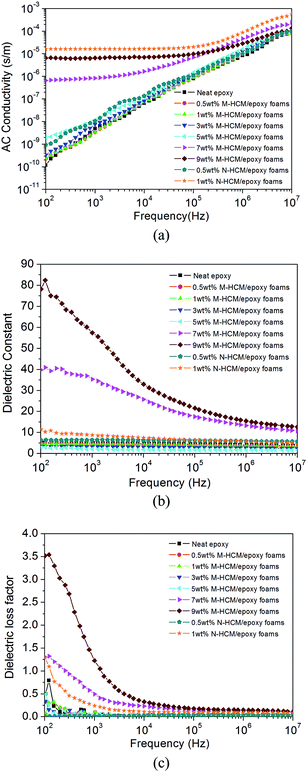 | ||
| Fig. 12 Dielectric properties of the neat epoxy and HCM/epoxy foams: (a) AC conductivity; (b) dielectric constant; (c) dielectric loss factor. | ||
As revealed in Fig. 12(a), the AC conductivity of the M-HCM/epoxy foams rose with the increase of M-HCM content, which was attributed to the high electrical conductivity of the HCMs. When the loading of M-HCMs was lower than 7 wt%, the AC conductivity displayed obvious frequency dependence which was enhanced with increasing frequency. The frequency dependence of the AC conductivity of the epoxy foams declined with the increase of M-HCM content. Specially, the AC conductivity of the M-HCM/epoxy foams exhibited an abrupt increase as the M-HCM content increased to 7 wt%. This rapid increase of AC conductivity can be attributed to the initial formation of a conducting network because the M-HCM loading was close to the percolation threshold. After 9 wt% of M-HCMs was added into the epoxy matrix, the AC conductivity of the resulting foam continued to increase at higher frequencies, and remained at a stable value at the low frequency range. For the N-HCM/epoxy foams, the AC conductivity exhibited obvious enhancement with increasing frequency after adding 0.5wt of N-HCMs. When the N-HCM content was 1 wt%, the AC conductivity was higher than that of the 9 wt% M-HCM/epoxy foams. This is because a few conducting paths derived from aggregations of the N-HCMs were formed in the epoxy resin matrix, and induced the high AC conductivity which was independent of frequency in the frequency range from 102 Hz to 105 Hz.31
From Fig. 12(b), it can be seen that the dielectric constant of the neat epoxy and M-HCM/epoxy foams with a low loading of M-HCMs (≤5 wt%) exhibited low frequency dependence. Compared to the neat epoxy, the addition of M-HCMs initially caused a decrease of the dielectric constant. At 1 MHz, the dielectric constant declined from 4.03 to 1.68 as the M-HCM content was 5 wt%, because a large number of gas pores were introduced into the epoxy matrix due to the addition of hollow fillers. However, further loading to 7 wt% caused the dielectric constant of the M-HCM/epoxy foams to begin to sharply increase, indicating that the M-HCM loading was near the percolation threshold. The dielectric constant of the epoxy foams with a 7 wt% and 9 wt% loading of M-HCMs exhibited obvious frequency dependence which indicated the presence of an interfacial polarization in the epoxy matrix.32 This gradually decreasing dielectric constant with increased frequency may be caused by the slow dielectric relaxation at the interface of the M-HCM/epoxy foams. Meanwhile, the N-HCM/epoxy foams showed a higher dielectric constant than that of the neat epoxy, which was rising with the increased content of N-HCMs. Compared to the M-HCM/epoxy samples, the increase of the dielectric constant for the N-HCM/epoxy foams could be ascribed to the interfacial polarization effect and the accumulation of charges at the nanoscale interfaces.
In Fig. 12(c), when the content of M-HCMs was lower than 7 wt%, the dielectric loss factor of the epoxy foams showed no obvious variation with increasing M-HCM content and sweep frequencies. After the M-HCM loading exceeded 7 wt%, the loss factor rapidly increased at the low frequency range due to the initial formation of a conducting network. Because of the smaller particle size of the N-HCMs, when the loading of the N-HCMs reached 1 wt%, the aggregation of the N-HCMs formed a few conductivity paths in the epoxy matrix. As a result, the dielectric loss of the 1 wt% HCM/epoxy foams was higher than that of the neat epoxy and 1 wt% M-HCM/epoxy foams.
Of course, the dielectric properties of the HCM/epoxy foams can be further regulated by involving different dispersed states and surface treatments of the hollow particles to obtain lightweight, multifunctional polymer foams.
Conclusions
The M-HCMs and N-HCMs were fabricated using a template method. The Raman spectra of the M-HCMs and N-HCMs showed a similar graphitic structure in the two kinds of carbon microspheres. FT-IR spectra and XPS analysis suggested that there exists many OH, C–O and C![[double bond, length as m-dash]](https://www.rsc.org/images/entities/char_e001.gif) C groups on the surface of the HCMs, which is beneficial to the interface bonding in the HCM/epoxy foams. HCM/epoxy syntactic foams with different HCM content and particle sizes were prepared. With the increasing M-HCM content, the density of the epoxy foams gradually declined, along with a decrease in compression strength and flexural strength. However, the compression modulus and flexural modulus of the M-HCM/epoxy foams were enhanced. After adding 0.5 wt% and 1 wt% of N-HCMs, the compression strengths of the N-HCM/epoxy foams were almost equivalent to the neat epoxy samples, while the flexural strength of the N-HCM samples exhibited an obvious superiority. For the N-HCM samples, a better reinforcement effect was achieved by adding 0.5 wt% of N-HCMs due to the relative uniform dispersion of nanoparticles in the polymer matrix. Similarly, compared to the 1 wt% N-HCM samples, the adding of 0.5 wt% of N-HCMs can more obviously improve the thermal stability of the resulting epoxy foams. The dimensional stability and thermal stability of the epoxy foams were improved with the addition of the HCMs. The 0.5 wt% and 1 wt% N-HCM/epoxy foams exhibit a lower CTE value and a more effective retardation of the thermal decomposition compared to the samples with the same loading of M-HCMs. The thermal conductivity of the epoxy foams showed a generally increasing trend with the increasing M-HCM content up to 5 wt%, and then began to decline. The thermal conductivity of the 0.5 wt% and 1 wt% N-HCM-filled foams was higher than for the samples with the same loading of HCMs. The AC conductivity of the M-HCM/epoxy foams exhibited an abrupt increase as the M-HCM content increased to 7 wt% because the M-HCM loading was close to the percolation threshold, while the AC conductivity of the 1 wt% N-HCM/epoxy foams was higher than that of the 9 wt% M-HCM samples. Compared to the neat epoxy, the addition of M-HCMs initially caused a decrease in the dielectric constant, and a sharp increase occurred after adding 7 wt% of M-HCMs. In contrast, the N-HCM/epoxy foams showed a higher dielectric constant than that of the neat epoxy, which could be ascribed to the interfacial polarization effect and the accumulation of charges at the nanoscale interfaces.
C groups on the surface of the HCMs, which is beneficial to the interface bonding in the HCM/epoxy foams. HCM/epoxy syntactic foams with different HCM content and particle sizes were prepared. With the increasing M-HCM content, the density of the epoxy foams gradually declined, along with a decrease in compression strength and flexural strength. However, the compression modulus and flexural modulus of the M-HCM/epoxy foams were enhanced. After adding 0.5 wt% and 1 wt% of N-HCMs, the compression strengths of the N-HCM/epoxy foams were almost equivalent to the neat epoxy samples, while the flexural strength of the N-HCM samples exhibited an obvious superiority. For the N-HCM samples, a better reinforcement effect was achieved by adding 0.5 wt% of N-HCMs due to the relative uniform dispersion of nanoparticles in the polymer matrix. Similarly, compared to the 1 wt% N-HCM samples, the adding of 0.5 wt% of N-HCMs can more obviously improve the thermal stability of the resulting epoxy foams. The dimensional stability and thermal stability of the epoxy foams were improved with the addition of the HCMs. The 0.5 wt% and 1 wt% N-HCM/epoxy foams exhibit a lower CTE value and a more effective retardation of the thermal decomposition compared to the samples with the same loading of M-HCMs. The thermal conductivity of the epoxy foams showed a generally increasing trend with the increasing M-HCM content up to 5 wt%, and then began to decline. The thermal conductivity of the 0.5 wt% and 1 wt% N-HCM-filled foams was higher than for the samples with the same loading of HCMs. The AC conductivity of the M-HCM/epoxy foams exhibited an abrupt increase as the M-HCM content increased to 7 wt% because the M-HCM loading was close to the percolation threshold, while the AC conductivity of the 1 wt% N-HCM/epoxy foams was higher than that of the 9 wt% M-HCM samples. Compared to the neat epoxy, the addition of M-HCMs initially caused a decrease in the dielectric constant, and a sharp increase occurred after adding 7 wt% of M-HCMs. In contrast, the N-HCM/epoxy foams showed a higher dielectric constant than that of the neat epoxy, which could be ascribed to the interfacial polarization effect and the accumulation of charges at the nanoscale interfaces.
Acknowledgements
The authors acknowledge financial support from the National Natural Science Foundation of China (no. 51073019), the Program for New Century Excellent Talents in University (no. NCET-12-0761) and the National High-tech R&D Program of China (863 Program) (no. 2012AA03A203).Notes and references
- M. Yu, P. Zhu and Y. Ma, Effects of particle clustering on the tensile properties and failure mechanisms of hollow spheres filled syntactic foams: a numerical investigation by microstructure based modeling, Mater. Des., 2013, 47, 80–89 CrossRef CAS PubMed.
- E. M. Wouterso, F. Y. C. Boey, X. Hu and S. C. Wong, Specific properties and fracture toughness of syntactic foam: effect of foam microstructures, Compos. Sci. Technol., 2005, 65, 1840–1850 CrossRef PubMed.
- B. Zhu, J. Ma, J. Wang, J. Wu and D. Peng, Thermal, dielectric and compressive properties of hollow glass microsphere filled epoxy-matrix composite, J. Reinf. Plast. Compos., 2012, 31, 1311–1326 CrossRef PubMed.
- H. S. Kim and M. A. Khamis, Fracture and impact behavior of hollow micro-sphere/epoxy matrix composite, Composites, Part A, 2001, 32, 1311–1317 CrossRef.
- H. S. Kim and P. Plubrai, Manufacturing and failure mechanisms of syntactic foam under compression, Composites, Part A, 2004, 35, 1009–1015 CrossRef PubMed.
- L. Zhang and J. Ma, Effect of coupling agent on mechanical properties of hollow carbon microsphere/phenolic resin syntactic foam, Compos. Sci. Technol., 2010, 70, 1265–1271 CrossRef CAS PubMed.
- G. Hu and D. Yu, Tensile, thermal and dynamic mechanical properties of hollow polymer particle-filled epoxy syntactic foam, Mater. Sci. Eng., A, 2011, 528, 5177–5183 CrossRef CAS PubMed.
- K. C. Yung, B. L. Zhu and T. M. Yue, Preparation and properties of hollow glass microsphere-filled epoxy-matrix composites, Compos. Sci. Technol., 2009, 69(2), 260–264 CrossRef CAS PubMed.
- S. J. Park, F. L. Jin and C. Lee, Preparation and physical properties of hollow glass microspheres-reinforced epoxy matrix resins, Mater. Sci. Eng., A, 2005, 402(1), 335–340 CrossRef PubMed.
- G. Tagliavia, M. Porfiri and N. Gupta, Analysis of flexural properties of hollow-particle filled composites, Composites, Part B, 2010, 41, 86–93 CrossRef PubMed.
- N. Gupta and R. Nagorny, Tensile properties of glass microballoon-epoxy resin syntactic foams, J. Appl. Polym. Sci., 2006, 102, 1254–1261 CrossRef CAS PubMed.
- N. Gupta, S. Kumar Gupta and B. J. Mueller, Analysis of a functionally graded particulate composite under flexural loading conditions, Mater. Sci. Eng., A, 2008, 485, 439–447 CrossRef PubMed.
- N. Gupta, R. Ye and M. Porfiri, Comparison of tensile and compressive characteristics of vinyl ester/glass microballoon syntactic foams, Composites, Part B, 2010, 41, 236–245 CrossRef PubMed.
- N. Gupta, E. Woldesenbet and P. Mensah, Compression properties of syntactic foams: effect of cenosphere radius ratio and specimen aspect ratio, Composites, Part A, 2004, 35, 103–111 CrossRef PubMed.
- M. Porfiri and N. Gupta, Effect of volume fraction and wall thickness on the elastic properties of hollow particle filled composites, Composites, Part B, 2009, 40, 166–173 CrossRef PubMed.
- L. Zhang, S. Roy, Y. Chen, E. K. Chua, K. Y. See, X. Hu and M. Liu, Mussel-inspired polydopamine coated hollow carbon microspheres, a novel versatile filler for fabrication of high performance syntactic foams, ACS Appl. Mater. Interfaces, 2014, 6, 18644–18652 CAS.
- Y. Ema, M. Ikeya and M. Okamoto, Foam processing and cellular structure of polylactidebased nanocomposites, Polymer, 2006, 47, 5350–5359 CrossRef CAS PubMed.
- L. J. Lee, C. Zeng, X. Cao, X. Han, J. Shen and G. Xu, Polymer nanocomposite foams, Compos. Sci. Technol., 2005, 65, 2344–2363 CrossRef CAS PubMed.
- C. Zeng, X. Xan, L. J. Lee, K. W. Koelling and D. L. Tomasko, Polymer-clay nanocomposite foams prepared using carbon dioxide, Adv. Mater., 2003, 15, 1743 CrossRef CAS PubMed.
- Y. Ema, M. Ikeya and M. Okamoto, Foam processing and cellular structure of polylactidebased nanocomposites, Polymer, 2006, 47, 5350–5359 CrossRef CAS PubMed.
- L. J. Lee, C. Zeng, X. Cao, X. Han, J. Shen and G. Xu, Polymer nanocomposite foams, Compos. Sci. Technol., 2005, 65, 2344–2363 CrossRef CAS PubMed.
- M. Yang, J. Ma, S. J. Ding, Z. K. Meng, J. G. Liu, T. Zhao, L. Q. Mao, Y. Shi, X. G. Jin, X. F. Lu and Z. Z. Yang, Phenolic resin and derived carbon hollow spheres, Macromol. Chem. Phys., 2006, 207(18), 1633–1639 CrossRef CAS PubMed.
- S. X. Chen, X. Zhang and P. K. Shen, Macroporous conducting matrix: fabrication and application as electrocatalyst support, Electrochem. Commun., 2006, 8, 713–719 CrossRef CAS PubMed.
- W. Lee, J. U. Lee, B. M. Jung, J. H. Byun, J. W. Yi, S. B. Lee and B. S. Kim, Simultaneous enhancement of mechanical, electrical and thermal properties of graphene oxide paper by embedding dopamine, Carbon, 2013, 65, 296–304 CrossRef CAS PubMed.
- H. Lei, Y. Wang and J. Huo, Porous graphitic carbon materials prepared from cornstarch with the assistance of microwave irradiation, Microporous Mesoporous Mater., 2015, 210, 39–45 CrossRef CAS PubMed.
- A. Stein, Z. Wang and M. A. Fierke, Functionalization of porous carbon materials with designed pore architecture, Adv. Mater., 2009, 21, 265–293 CrossRef CAS PubMed.
- K. Yang, M. Gu, Y. Guo, X. Pan and G. Mu, Effects of carbon nanotube functionalization on the mechanical and thermal properties of epoxy composite, Carbon, 2009, 47, 1723–1737 CrossRef CAS PubMed.
- W. Cui, F. Du, J. Zhao, W. Zhang, Y. Yang, X. Xie and Y. Mai, Improving thermal conductivity while retaining high electrical resistivity of epoxy composites by incorporating silica-coated multi-walled carbon nanotubes, Carbon, 2011, 49, 495–500 CrossRef CAS PubMed.
- M. Moniruzzaman and K. I. Winey, Polymer nanocomposites containing carbon nanotubes, Macromolecules, 2006, 39, 5194–5205 CrossRef CAS.
- W. J. Wang, C. W. Li and K. P. Chen, Electrical, dielectric and mechanical properties of a novel Ti3AlC2/epoxy resin conductive composites, Mater. Lett., 2013, 110, 61–64 CrossRef CAS PubMed.
- L. L. Sun, Y. Zhao and W. H. Zhong, Dependence of dielectric properties and percolative behavior on phase separation structure induced by heterogeneous carbon nanofiber distribution in polymer blend nanocomposites, Macromol. Mater. Eng., 2011, 296, 992–1001 CrossRef CAS PubMed.
- A. R. Luxmoore and D. R. J. Owen, The mechanics of cellular plastics, Applied Science Publishers, Barking, 1980, pp. 359–391 Search PubMed.
Footnote |
| † Electronic supplementary information (ESI) available. See DOI: 10.1039/c5ra07112g |
| This journal is © The Royal Society of Chemistry 2015 |

