Improved hydrogen storage properties of MgH2 by addition of Co2NiO nanoparticles
N. Juahira,
N. S. Mustafaa,
A. M. Sininb and
M. Ismail*a
aSchool of Ocean Engineering, Universiti Malaysia Terengganu, 21030 Kuala Terengganu, Malaysia. E-mail: mohammadismail@umt.edu.my; Fax: +60-9-6683991; Tel: +60-9-6683487
bCentre for Foundation and Liberal Education, Universiti Malaysia Terengganu, 21030 Kuala Terengganu, Malaysia
First published on 8th July 2015
Abstract
A sample of MgH2 and 10 wt% Co2NiO was prepared by the ball milling technique. The hydrogen storage properties and reaction mechanism of the sample were examined. The temperature-programmed desorption result shows that the addition of 10 wt% Co2NiO to MgH2 exhibited a lower onset desorption temperature of 300 °C, which was decreased to 117 and 70 °C compared to as-received and as-milled MgH2, respectively. The de/rehydrogenation kinetics of MgH2 + 10 wt% Co2NiO showed improvement compared to un-doped MgH2. The results of the Kissinger plot shows that the activation energy for the hydrogen desorption of MgH2 was reduced to about 65.0 and 15.0 kJ mol−1 compared to as-received and as-milled MgH2, respectively. Meanwhile, the X-ray diffraction analysis shows the formation of a new phase of Mg–Co alloy and Co1.29Ni1.71O4 after the dehydrogenation and rehydrogenation process. It is reasonable to conclude that the Co2NiO additive plays a catalytic role through the formation of active species of Mg–Co alloy and Co1.29Ni1.71O4 during the heating process, thus improving the hydrogen storage properties of MgH2.
1. Introduction
The U.S Department of Energy has established a minimum target of 5.5 wt% ab/desorption hydrogen storage capacity for the year 2015.1 MgH2 can be seen as a promising material among metal hydrides due to its high gravimetric hydrogen storage (7.6 wt%), good reversibility, and low cost.2 However, MgH2 has deficiencies, including high decomposition temperature and slow desorption/absorption kinetics.3 In order to make MgH2 feasible as a potential material for solid state hydrogen storage, different approaches have been used including improving the surface and kinetics by ball milling,4 adding a catalyst,5,6 and using the destabilization concept.7–12 The addition of catalysts by ball milling into MgH2 has produced a significant effect on hydrogen sorption properties,5,6 thus it has caught the interest of many researchers. Various additives have been doped into MgH2 such as metal,13–15 alloy,16,17 metal oxide,18–21 metal halide,5,22–27 carbon materials,28–30 and metal hydrides.31,32The addition of transition metal oxides has shown promising results in the ab/desorption kinetics of MgH2. This enhancement could be associated with a highly effective catalysis shown by the transition of metal compounds due to the high affinity of metal cation transition towards hydrogen.33–37 Besides that, transition metal oxides also can act as a good catalyst by facilitating the dissociation of hydrogen molecules and the recombination of hydrogen atom towards the molecular state.38 It is believed that the additive oxide phase facilitates to overcome the MgO layer formed on the surface of MgH2 particles, thus improving the reaction kinetics.39,40
To the best of the author's knowledge, no reported study has used Co2NiO nanoparticle as an additive for the hydrogen storage properties of MgH2. The selection of Co2NiO as an additive was driven from several studies, which used Ni- and Co-based additives. Ni- and Co-based additives have been given considerable attraction due to their ability to destabilize the dehydrogenation of MgH2.41,42 Mao et al. reported that the dehydrogenation temperature and the sorption kinetics of MgH2 were improved by doping with NiCl2 or CoCl2. Their results suggest that all the dehydrogenation products MgCl2, Mg2Ni and Mg2Co may play an important role in improving the hydrogen sorption kinetic properties of MgH2, while MgCl2 may play a dominant role.38 A recent study by Cabo et al. showed that the addition of mesoporous Ni- and Co based oxides reduced the onset dehydrogenation temperature and lowered the activation energy of MgH2.43 Meanwhile, Mandzhukova et al. reported that the addition of 10 wt% nickel cobaltite, NiCo2O4 improved the dehydrogenation kinetics of MgH2.44,45
In this paper, the additive effect of Co2NiO nanoparticle on the hydrogen storage properties of MgH2 was investigated. The aim of this study is to combine the in situ active species factors together thus enhancing the de/hydrogenation properties of MgH2. The hydrogen storage properties and reaction mechanism of MgH2 and Co2NiO were investigated using a Sieverts-type pressure-composition-temperature (PCT) apparatus, X-ray diffraction (XRD), differential scanning calorimetry (DSC), and scanning electron microscope (SEM).
2. Experimental details
MgH2 (hydrogen storage grade, 98% purity) and Co2NiO (<150 nm size particle, 99% trace material basis) were purchased from Alfa Aesar and Sigma-Aldrich, respectively and were used as received without further purification. Sample handling was performed in an MBraun Unilab glove box filled with high-purity Ar atmosphere. Approximately 200 mg MgH2 was added with 10 wt% Co2NiO. This mixture was loaded into a sealed stainless steel vial together with four hardened stainless balls. As-milled MgH2 sample under the same condition was prepared for comparison. Ball milling was performed in a planetary ball mill (NQM-0.4) for 1 h by milling for 1/4 h, resting for 2 min, and then milling for another 1/4 h in a different direction for 3 cycles at the rate of 400 rpm. The ratio of the weight of the balls to the weight of the powder was 80![[thin space (1/6-em)]](https://www.rsc.org/images/entities/char_2009.gif) :
:![[thin space (1/6-em)]](https://www.rsc.org/images/entities/char_2009.gif) 1.
1.
The temperature-programmed desorption (TPD) and re/dehydrogenation kinetics experiments were performed in a Sieverts-type pressure-composition-temperature (PCT) apparatus (Advanced Materials Corporation). The sample was loaded into a sample vessel in the glove box. For the TPD experiment, the samples were heated in a vacuum chamber from room temperature to 450 °C with a heating rate of 5 °C min−1 and the lowest decomposition temperature determined by the amount of desorbed hydrogen. The re/dehydrogenation kinetics experiments were performed at temperature of 320 °C with hydrogen pressure of 30 atm and 1 atm, respectively.
The phase structure of as-milled samples, before and after desorption and after rehydrogenation were measured using Rigaku MiniFlex II Diffractometer with Cu Kα radiation. Before the measurement, a small amount of sample was spread uniformly in the sample holder and wrapped with a plastic wrap to prevent oxidation. θ–2θ scans were carried out over the diffraction angles from 20° to 80° at a speed of 2.00° min−1. Meanwhile, the microstructure of the samples were characterized using a scanning electron microscope (SEM; JEOL JSM-6360LA) by preparing the samples on the surface of carbon tape and then coating it with gold spray under vacuumed condition. All samples were also prepared in the glove box in order to minimize oxidation. A DSC analysis was carried out using a Mettler Toledo TGA/DSC 1. About 5–6 mg weight of the sample was loaded in an alumina crucible in the glove box. The crucible was then placed in a sealed glass bottle in order to prevent oxidation during transportation from the glove box to the DSC apparatus. The samples were heated from room temperature to 480–550 °C under Ar atmosphere with different heating rates. An empty alumina crucible was used for reference.
3. Results and discussion
The dehydrogenation behavior of as-received MgH2, as-milled MgH2, and the MgH2 + 10 wt% Co2NiO composite was investigated using a Sieverts-type PCT apparatus. Fig. 1 presents the temperature-programmed-desorption (TPD) performances of as-received MgH2, as-milled MgH2, and the MgH2 doped with 10 wt% Co2NiO. From the TPD curves, it can be seen clearly that the addition of 10 wt% of Co2NiO decreased the onset decomposition temperature compared to as-milled and as-received MgH2. The onset decomposition of as-received and as-milled MgH2 was about 417 and 370 °C with a total dehydrogenation capacity of 6.2 and 5.4 wt% H2 at 450 °C, respectively. These results show that the ball milling process also has an influence in reducing the onset desorption temperature of MgH2 due to the larger surface area in magnesium surfaces. Therefore, a higher diffusion hydrogen absorption can be achieved.4,19 However, the as-milled MgH2 showed slightly lower hydrogen desorption capacity compared to as-received MgH2, and this could happen due to the released hydrogen during ball milling process. MgH2 + 10 wt% Co2NiO had a positive effect on the onset desorption temperature of MgH2, since the desorption started at around 300 °C with a total dehydrogenation capacity of 5.3 wt% hydrogen at 450 °C, which was lowered by 117 °C and 70 °C compared to the as-received and as-milled MgH2. These results suggest that the Co2NiO component in the doped MgH2 could play a catalytic role and thus, improving the onset temperature of MgH2.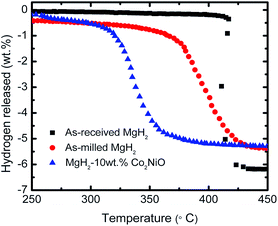 | ||
| Fig. 1 TPD curves for dehydrogenation of the as-received, as-milled and MgH2 + 10 wt% Co2NiO composite. | ||
Fig. 2 shows the isothermal desorption kinetics curve for as-milled MgH2 and MgH2 + 10 wt% Co2NiO composite measured at 320 °C under 1.0 atm pressure. The result shows that the sample doped with 10 wt% Co2NiO released about 2.5 wt% hydrogen in 6 min. In contrast, almost no hydrogen was released in the same period by as-milled MgH2. Therefore, it can be assumed that Co2NiO also had significant effect on improving the dehydrogenation kinetics of MgH2. Fig. 3 shows the isothermal rehydrogenation kinetics for as-milled MgH2 and MgH2 + 10 wt% Co2NiO samples. The samples were soaked at a constant temperature of 320 °C and under 30.0 atm hydrogen pressure. The hydrogen absorbed by MgH2 doped with 10 wt% Co2NiO samples reached about 2.5 wt% hydrogen within 1.7 min, with a total hydrogen absorption of 3.75 wt%. Meanwhile, as-milled MgH2 took about 3.4 min to absorb the same amount of hydrogen with a total hydrogen absorption of 3.78 wt%. It can be seen that the doped sample showed better rehydrogenation kinetics than as-milled MgH2. Taken together, these results suggest that the rehydrogenation kinetics of MgH2 can also be improved by doping it with Co2NiO.
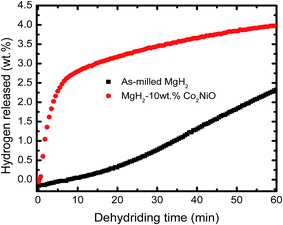 | ||
| Fig. 2 Isothermal dehydrogenation kinetics of the as-milled MgH2 and MgH2 + 10 wt% Co2NiO composite at 320 °C. | ||
 | ||
| Fig. 3 Isothermal rehydrogenation kinetics of the as-milled MgH2 and doped MgH2 + 10 wt% Co2NiO composite at 320 °C and under 30.0 atm hydrogen pressure. | ||
Fig. 4 representatives the cyclic performance of MgH2 + 10 wt% Co2NiO sample at temperature of 320 °C and under 30 atm hydrogen pressure. The hydrogen absorption kinetics of the sample shows some degradation after prolonged cyclic. However, the degradation was involving small values. After the 10th cycle, the absorption continued to be good with hydrogen capacity of 3.44 wt%. Meanwhile, the cycle performances for the desorption kinetics of MgH2 + 10 wt% Co2NiO sample also shows good performances even after 10th cycle as shown in Fig. 5 with the desorption kinetics of the sample in 60 minutes for 10th cycle was 3.75 wt%. The hydrogen desorption also degrades after prolonged time with involving small amount hydrogen. This result shows that the good cyclic performances of MgH2 can be achieved by doping with Co2NiO.
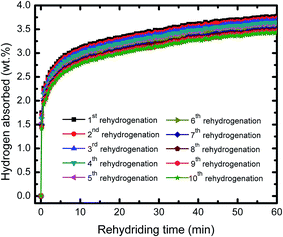 | ||
| Fig. 4 Isothermal rehydrogenation kinetics of the MgH2 + 10 wt% Co2NiO composite for the ten cycles. | ||
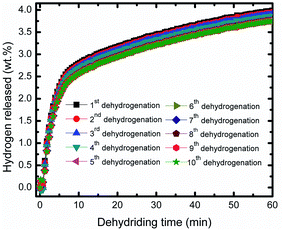 | ||
| Fig. 5 Isothermal dehydrogenation kinetics of the MgH2 + 10 wt% Co2NiO composite for the ten cycles. | ||
Fig. 6 shows the recyclability capacity of the MgH2 + 10 wt% Co2NiO composite after 60 min absorb/desorb for the ten cycles. From the graph, it can be seen that for all cycles, the hydrogen desorption have slightly higher capacity compared to hydrogen absorption. It can be seen that the amount of hydrogen absorbed and desorbed degrades after prolonged cyclic. For hydrogen desorption, shows only slight degradation observed in hydrogen capacity of the 5th to 10th cycles compared to amount degrades for the first four cycles.
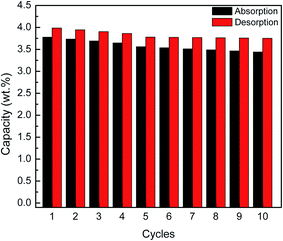 | ||
| Fig. 6 Recyclability capacity of the MgH2 + 10 wt% Co2NiO composite after 60 min absorb/desorb for the ten cycles. | ||
Fig. 7 presents the DSC curves of the MgH2 + 10 wt% Co2NiO sample at a heating rate of 15 °C min−1. As-received MgH2 and as-milled MgH2 were included for comparison purposes. The DSC curve of as-received MgH2 showed only one strong endothermic peak at approximately 454.06 °C, which corresponds to the decomposition of MgH2. Meanwhile, the DSC curves for as-milled MgH2 and MgH2 + 10 wt% Co2NiO had strong endothermic peaks at 418.72 °C and 412.66 °C, respectively. The noticeable reduction in the peak temperatures of the samples based on the DSC results revealed that dehydrogenation was improved by adding Co2NiO. However, it could be seen that the onset decomposition temperature of the samples in DSC were slightly higher than those in TPD (Fig. 1), which could be due to the differences in heating rates and atmospheres between DSC and PCT measurements, as discussed in our previous papers.46–49 TPD measurement was conducted from 1.0 atm vacuum with a 5 °C min−1 heating rate, while DSC measurement was run under 1.0 atm argon flow with heating rate of 15 °C min−1.
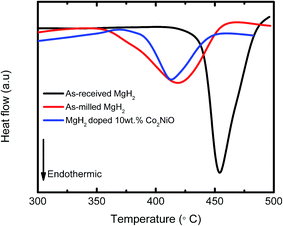 | ||
| Fig. 7 DSC traces of as-received MgH2, as-milled MgH2, and MgH2 + 10 wt% Co2NiO at heating rate of 15 °C min−1. | ||
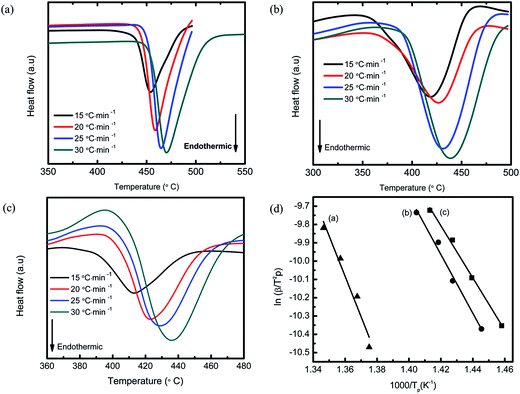
The Kissinger equation50 was used to calculate the activation energy (EA) of MgH2 + 10 wt% Co2NiO at different heating rates. The activation energy of as-received and as-milled MgH2 was included for comparison purposes. Fig. 8(a)–(c) shows the DSC curves at different heating rates for as-received MgH2, as-milled MgH2, and MgH2 + 10 wt% Co2NiO, respectively. From the Kissinger equation:
| ln[β/Tp2] = −EA/RTp + A | (1) |
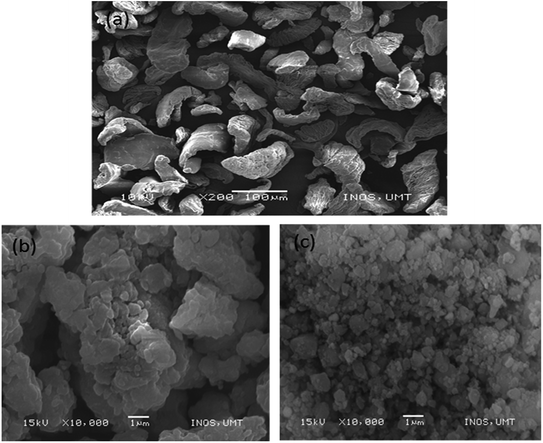
Fig. 9(a)–(c) show the SEM images of as-received MgH2, as-milled MgH2, and MgH2 + 10 wt% Co2NiO, respectively. In Fig. 9(a), it can be seen that as-received particles of MgH2 were angular shaped with sizes larger than 100 μm. Fig. 9(b) shows a sample subjected to 1 h ball milling process, which caused a drastic reduction in MgH2 particles with non-homogenous particles size. Besides that, some agglomeration was detected in the sample. After introducing Co2NiO through the ball milling process, the size of the particles became smaller compared to as-milled MgH2 sample (Fig. 9(c)). The hardness of the Co2NiO helped in breaking MgH2 particles into smaller sizes, increasing the specific surface area and reducing the diffusion length of the hydrogen, thus achieving the minimum onset desorption temperature.24,51
To have a better understanding on the reaction process and mechanism of this sample, XRD measurements were performed on MgH2 + 10 wt% Co2NiO samples after 1 h of milling, after dehydrogenation at 250 °C, after dehydrogenation at 450 °C, and after rehydrogenation at 320 °C under 30.0 atm hydrogen pressure, as shown in Fig. 10. After 1 h of milling, the MgH2 and Co2NiO peaks were seen to dominate the XRD pattern with few Mg peaks. Mg peaks appeared at this stage confirmed there was hydrogen released during ball milling. After heating to 250 °C, it was seen that the same peaks appeared, such as those in ball milling. Further heating to 450 °C caused MgH2 and Co2NiO to disappear. The dehydrogenation of MgH2 can be confirmed with distinct Mg peaks, and the transformation of MgH2 into Mg can be represented as follows:
| MgH2 → Mg + H2 | (2) |
 | ||
| Fig. 10 XRD patterns of MgH2 doped 10 wt% Co2NiO (a) after 1 h ball milling, (b) after dehydrogenation at 250 °C, (c) after dehydrogenation at 450 °C and (d) after rehydrogenation at 320 °C. | ||
MgO peak was also detected in the dehydrogenation spectra due to slight oxygen contamination when transferring the samples to the XRD instrument. In addition, new Mg–Co alloy and Co1.29Ni1.71O4 peaks could also be seen. The presence of Mg–Co alloy and Co1.29Ni1.71O4 might have appeared during the dehydrogenation process. XRD examination of the dehydrogenated MgH2 doped with Co2NiO sample verified the formation of Mg–Co alloy and Co1.29Ni1.71O4 peaks and these peaks remained unchanged after rehydrogenation at 320 °C. Hence, we speculate that the Mg–Co alloy and Co1.29Ni1.71O4 species could have acted as the real catalysts. In addition, it was seen that Mg was largely transformed into MgH2 after the rehydrogenation process.
In order to investigate the Co2NiO containing phase after dehydrogenation in detail, we prepared a MgH2 + 50 wt% Co2NiO sample, as it was difficult to analyse the phase composition with 10 wt% Co2NiO by XRD. Fig. 11 shows the XRD patterns of MgH2 doped with 50 wt% Co2NiO sample (a) after 1 h ball milling, (b) after dehydrogenation at 250 °C and (c) after dehydrogenation at 450 °C. After increasing the amount of Co2NiO to 50 wt%, the Co2NiO peaks increased compared to as-milled MgH2 + 10 wt% Co2NiO sample as shown in Fig. 10(a). Mg peaks were detected in the XRD spectra indicating that hydrogen was released during ball milling. After heating to temperature 250 °C, the same Mg, MgH2 and Co2NiO peaks were seen with few Mg–Co alloy and Co1.29Ni1.71O4 peaks. The formation of Mg–Co alloy and Co1.29Ni1.71O4 at 250 °C indicates that these active species were formed during the heating process. Further temperature increment to 450 °C saw the disappearance of MgH2 and Co2NiO peaks with more frequent appearance of Mg–Co alloy and Co1.29Ni1.71O4 peaks. As compared to the XRD pattern of MgH2 + 10 wt% Co2NiO sample (Fig. 10), the formation of Mg–Co alloy and Co1.29Ni1.71O4 were more discernible after 50 wt% Co2NiO was added.
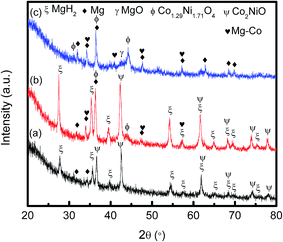 | ||
| Fig. 11 XRD patterns of MgH2 doped 50 wt% Co2NiO (a) after 1 h ball milling, (b) after dehydrogenation at 250 °C and (c) after dehydrogenation at 450 °C. | ||
From the results, we speculate that the formation of Mg–Co alloy and Co1.29Ni1.71O4, which resulted from the reaction of MgH2 and Co2NiO during de/hydrogenation process, could play an important role in the enhancement of hydrogen sorption. The formation of Mg–Co alloy in this study is mutual with the findings by Mao et al.38 They suggested that Mg–Co alloy formed in the MgH2–CoCl2 system could act as a catalyst besides MgCl2 alloy, thus improving the de/hydrogenation of MgH2 through the additive. It can be speculated that, this additive reduces the barrier of nucleation, and thus hydrogen desorption takes place at a lower driving force and the transition metal helps in facilitating the dissociation of hydrogen molecules and the recombination of hydrogen atom towards the molecular state.14 In addition, it is believed that the newly formed ball-milled or dehydrogenation product in the complex hydride catalyst system could act as a real catalyst to facilitate the de/rehydrogenation steps.52 In this study, Co–Ni oxide species with an altered valance state, Co1.29Ni1.71O4, could have acted as a real catalyst because they could create surface activation and form a large amount of nucleation sites at the surface of the MgH2 matrix. It is also speculated that these finely dispersed ball-milled products could serve as the active sites for nucleation by shortening the diffusion distance of the reaction ions.52
4. Conclusion
In summary, the hydrogen sorption properties of MgH2 improved after doping it with 10 wt% Co2NiO. MgH2 + 10 wt% Co2NiO composite has a lower onset dehydrogenation temperature of 300 °C, which was decreased to about 117 °C and 70 °C compared to as-received and as-milled MgH2, respectively. In terms of dehydrogenation kinetics, MgH2 + 10 wt% Co2NiO sample released about 2.5 wt% hydrogen in 6 min at 320 °C, while as-milled MgH2 sample showed no hydrogen release under the same condition. Meanwhile, for absorption kinetics, MgH2 + 10 wt% Co2NiO sample absorbed about 2.5 wt% hydrogen within 1.7 min at 320 °C, but as-milled MgH2 sample took about 3.4 min to absorb the same amount of hydrogen. The results from the Kissinger plot showed that the activation energy for hydrogen desorption of MgH2 was reduced compared to those of as-received and as-milled MgH2 from 183.0 and 133.0 kJ mol−1 to 118.0 kJ mol−1, respectively, after the addition of 10 wt% Co2NiO. It is reasonable to conclude that, in this study, the Co2NiO additive doped with MgH2 played a catalytic role through the formation of active species of Mg–Co alloy and Co1.29Ni1.71O4 during the heating process. This newly developed product acted as a real catalyst in improving the hydrogen storage properties of MgH2.Acknowledgements
The authors would like to thank the Universiti Malaysia Terengganu for providing the facilities to carry out this project and the Malaysian Ministry of Education for the research grant under Fundamental Research Grant Scheme (FRGS 59362). N. Juahir and N. S. Mustafa are grateful to the Malaysian Ministry of Education for a MyBrain15 scholarship.References
- S. Satyapal, J. Petrovic, C. Read, G. Thomas and G. Ordaz, Catal. Today, 2007, 120, 246–256 CrossRef CAS PubMed.
- G. Liang, J. Huot, S. Boily, A. van Neste and R. Schulz, J. Alloys Compd., 1999, 292, 247–252 CrossRef CAS.
- I. P. Jain, C. Lal and A. Jain, Int. J. Hydrogen Energy, 2010, 35, 5133–5144 CrossRef CAS PubMed.
- J. Huot, G. Liang, S. Boily, A. van Neste and R. Schulz, J. Alloys Compd., 1999, 293–295, 495–500 CrossRef CAS.
- M. Ismail, Int. J. Hydrogen Energy, 2014, 39, 2567–2574 CrossRef CAS PubMed.
- H. Gasan, O. N. Celik, N. Aydinbeyli and Y. M. Yaman, Int. J. Hydrogen Energy, 2012, 37, 1912–1918 CrossRef CAS PubMed.
- M. Ismail, Y. Zhao, X. B. Yu, J. F. Mao and S. X. Dou, Int. J. Hydrogen Energy, 2011, 36, 9045–9050 CrossRef CAS PubMed.
- S. Kurko, A. Aurora, D. M. Gattia, V. Contini, A. Montone, Ž. Rašković-Lovre and J. G. Novaković, Int. J. Hydrogen Energy, 2013, 38, 12140–12145 CrossRef CAS PubMed.
- M. Ismail, Y. Zhao and S. X. Dou, Int. J. Hydrogen Energy, 2013, 38, 1478–1483 CrossRef CAS PubMed.
- H. Liu, C. Wu, H. Zhou, T. Chen, Y. Liu, X. Wang, Z. Dong, H. Ge, S. Li and M. Yan, RSC Adv., 2015, 5, 22091–22096 RSC.
- M. Ismail, Y. Zhao, X. B. Yu and S. X. Dou, RSC Adv., 2011, 1, 408–414 RSC.
- N. S. Mustafa, N. H. Idris and M. Ismail, Int. J. Hydrogen Energy, 2015, 40, 7671–7677 CrossRef CAS PubMed.
- J. L. Bobet, E. Akiba, Y. Nakamura and B. Darriet, Int. J. Hydrogen Energy, 2000, 25, 987–996 CrossRef CAS.
- A. Ranjbar, Z. P. Guo, X. B. Yu, D. Attard, A. Calka and H. K. Liu, Int. J. Hydrogen Energy, 2009, 34, 7263–7268 CrossRef CAS PubMed.
- J. Charbonnier, P. de Rango, D. Fruchart, S. Miraglia, L. Pontonnier, S. Rivoirard, N. Skryabina and P. Vulliet, J. Alloys Compd., 2004, 383, 205–208 CrossRef CAS PubMed.
- X. B. Yu, Y. H. Guo, H. Yang, Z. Wu, D. M. Grant and G. S. Walker, J. Phys. Chem. C, 2009, 113, 5324–5328 CAS.
- X. B. Yu, Z. X. Yang, H. K. Liu, D. M. Grant and G. S. Walker, Int. J. Hydrogen Energy, 2010, 35, 6338–6344 CrossRef CAS PubMed.
- M. Baricco, M. W. Rahman, S. Livraghi, A. Castellero, S. Enzo and E. Giamello, J. Alloys Compd., 2012, 536(suppl. 1), S216–S221 CrossRef CAS PubMed.
- K. S. Jung, E. Y. Lee and K. S. Lee, J. Alloys Compd., 2006, 421, 179–184 CrossRef CAS PubMed.
- S. Milošević, Ž. Rašković-Lovre, S. Kurko, R. Vujasin, N. Cvjetićanin, L. Matović and J. Grbović Novaković, Ceram. Int., 2013, 39, 51–56 CrossRef PubMed.
- H. Wang, J. Hu, F. Han, Y. Lu, J. Liu, L. Ouyang and M. Zhu, J. Alloys Compd., 2015 DOI:10.1016/j.jallcom.2015.01.057.
- M. Ismail, Y. Zhao, X. B. Yu and S. X. Dou, Energy Educ. Sci. Technol., Part A, 2012, 30, 107–122 Search PubMed.
- N. Recham, V. V. Bhat, M. Kandavel, L. Aymard, J. M. Tarascon and A. Rougier, J. Alloys Compd., 2008, 464, 377–382 CrossRef CAS PubMed.
- N. S. Mustafa and M. Ismail, Int. J. Hydrogen Energy, 2014, 39, 15563–15569 CrossRef CAS PubMed.
- F. A. Halim Yap, N. S. Mustafa and M. Ismail, RSC Adv., 2015, 5, 9255–9260 RSC.
- M. Ismail, Energy, 2015, 79, 177–182 CrossRef CAS PubMed.
- J. Cui, H. Wang, J. Liu, L. Ouyang, Q. Zhang, D. Sun, X. Yao and M. Zhu, J. Mater. Chem. A, 2013, 1, 5603–5611 CAS.
- A. Ranjbar, M. Ismail, Z. P. Guo, X. B. Yu and H. K. Liu, Int. J. Hydrogen Energy, 2010, 35, 7821–7826 CrossRef CAS PubMed.
- C. Z. Wu, P. Wang, X. Yao, C. Liu, D. M. Chen, G. Q. Lu and H. M. Cheng, J. Alloys Compd., 2006, 420, 278–282 CrossRef CAS PubMed.
- M. Ismail, N. Juahir and N. S. Mustafa, J. Phys. Chem. C, 2014, 118, 18878–18883 CAS.
- H. Shao, M. Felderhoff and F. Schüth, Int. J. Hydrogen Energy, 2011, 36, 10828–10833 CrossRef CAS PubMed.
- A. R. Yavari, J. F. R. de Castro, G. Vaughan and G. Heunen, J. Alloys Compd., 2003, 353, 246–251 CrossRef CAS.
- D. L. Croston, D. M. Grant and G. S. Walker, J. Alloys Compd., 2010, 492, 251–258 CrossRef CAS PubMed.
- W. Oelerich, T. Klassen and R. Bormann, J. Alloys Compd., 2001, 315, 237–242 CrossRef CAS.
- H. Simchi, A. Kaflou and A. Simchi, Int. J. Hydrogen Energy, 2009, 34, 7724–7730 CrossRef CAS PubMed.
- C. X. Shang, M. Bououdina, Y. Song and Z. X. Guo, Int. J. Hydrogen Energy, 2004, 29, 73–80 CrossRef CAS.
- I. E. Malka, T. Czujko and J. Bystrzycki, Int. J. Hydrogen Energy, 2010, 35, 1706–1712 CrossRef CAS PubMed.
- J. Mao, Z. Guo, X. Yu, H. Liu, Z. Wu and J. Ni, Int. J. Hydrogen Energy, 2010, 35, 4569–4575 CrossRef CAS PubMed.
- M. W. Rahman, A. Castellero, S. Enzo, S. Livraghi, E. Giamello and M. Baricco, J. Alloys Compd., 2011, 509(suppl. 1), S438–S443 CrossRef CAS PubMed.
- O. Friedrichs, J. C. Sanchez-Lopez, C. Lopez-Cartes, T. Klassen, R. Bormann and A. Fernandez, J. Phys. Chem. B, 2006, 110, 7845–7850 CrossRef CAS PubMed.
- S. Kwon, D. Mumm, H. Park and M. Song, J. Mater. Sci., 2010, 45, 5164–5170 CrossRef CAS.
- S. S. Srinivasan, M. U. Niemann, J. R. Hattrick-Simpers, K. McGrath, P. C. Sharma, D. Y. Goswami and E. K. Stefanakos, Int. J. Hydrogen Energy, 2010, 35, 9646–9652 CrossRef CAS PubMed.
- M. Cabo, S. Garroni, E. Pellicer, C. Milanese, A. Girella, A. Marini, E. Rossinyol, S. Suriñach and M. D. Baró, Int. J. Hydrogen Energy, 2011, 36, 5400–5410 CrossRef CAS PubMed.
- T. Mandzhukova, M. Khrussanova, E. Grigorova, P. Stefanov, M. Khristov and P. Peshev, J. Alloys Compd., 2008, 457, 472–476 CrossRef CAS PubMed.
- T. Mandzhukova, J.-L. Bobet, M. Khrussanova and P. Peshev, Mater. Res. Bull., 2009, 44, 1968–1972 CrossRef CAS PubMed.
- M. Ismail, Y. Zhao, X. B. Yu and S. X. Dou, Int. J. Hydrogen Energy, 2010, 35, 2361–2367 CrossRef CAS PubMed.
- M. Ismail, Y. Zhao, X. B. Yu, A. Ranjbar and S. X. Dou, Int. J. Hydrogen Energy, 2011, 36, 3593–3599 CrossRef CAS PubMed.
- M. Ismail, Y. Zhao, X. B. Yu, I. P. Nevirkovets and S. X. Dou, Int. J. Hydrogen Energy, 2011, 36, 8327–8334 CrossRef CAS PubMed.
- M. Ismail, A. Sinin, C. Sheng and W. W. Nik, Int. J. Electrochem. Sci., 2014, 9, 4959–4973 CAS.
- H. E. Kissinger, Anal. Chem., 1957, 29, 1702–1706 CrossRef CAS.
- H. Gasan, N. Aydinbeyli, O. N. Celik and Y. M. Yaman, J. Alloys Compd., 2009, 487, 724–729 CrossRef CAS PubMed.
- F. Zhai, P. Li, A. Sun, S. Wu, Q. Wan, W. Zhang, Y. Li, L. Cui and X. Qu, J. Phys. Chem. C, 2012, 116, 11939–11945 CAS.
| This journal is © The Royal Society of Chemistry 2015 |

