
Self-modification of TiO2 one-dimensional nano-materials by Ti3+ and oxygen vacancy using Ti2O3 as precursor†
Yumeng Liua,
Junpeng Wanga,
Ping Yang*a and
Katarzyna Matras-Postolekb
aSchool of Material Science and Engineering, University of Jinan, Jinan, 250022, P. R. China. E-mail: mse_yangp@ujn.edu.cn
bFaculty of Chemical Engineering and Technology, Cracow University of Technology, Krakow, 31-155, Poland
First published on 13th July 2015
Abstract
One-dimensional (1D) titanium dioxide (TiO2) nanowires and nanobelts have been fabricated via a hydrothermal synthesis and subsequent calcination process in different atmospheres. Ti2O3 was used as a raw material to directly provide Ti3+ in the resulting TiO2 nanomaterials. The Ti3+ concentration in TiO2 could be adjusted by annealing TiO2 precursors in different atmospheres. The photocatalysis activity of samples calcinated in air or nitrogen with different Ti3+ concentrations was investigated. By means of analyzing photocatalytic degradation curves, 1D TiO2 nanowires calcinated in nitrogen revealed enhanced photocatalysis activity compared with that one calcinated in air while the TiO2 nanobelts exhibited an opposite result. The enhanced photocatalytic activity is ascribed to the enhanced light absorption from the narrowing band gap. The proper concentrations of Ti3+ and oxygen vacancies result in the efficient separation of photo-generated charge carriers in these nanomaterials.
Introduction
Energy shortage and environmental pollutions have been considered as the most urgent scientific challenge in recent years. In 1972, Fujishima and Honda firstly discovered the decomposition of water on a titanium dioxide (TiO2) electrode.1 Since then, the efficient use of photocatalytic technology through semiconductors has been a research focus. Among all kinds of photocatalysts, TiO2 is widely used due to its stability, low cost, nontoxicity and environmental friendliness.2 However, a dominating disadvantage in TiO2 is that TiO2 has a wide bandgap (3.0 eV to 3.2 eV), which means it could only respond to UV irradiation. These defects restrict its application in photocatalytic degradation of organic pollutants, hydrogen generation and CO2 reduction.The adjustment of band structure of TiO2 is a considerable requirement for optimizing its solar light harvesting capability.3 Great efforts, such as doping noble metals including Pt, Ag and Au,4,5 non-metals impurities including C and N, have been made to improve activity of TiO2.6–9 Photocatalytic activity of TiO2 doped with rare earth metals could be improved by controlling the particle growth, crystal transformation.10 Ramos-Delgado et al. prepared WO3/TiO2 by the sol–gel method with improved malathion degradation under solar light radiation.11 However, in the photocatalytic process, the doped elements acted as recombination centres of generated holes and electrons which are unfavourable for the increase photocatalytic process. Compared with other metal cations doping such as variable valency metal ions Fe3+,12 self-doping TiO2 with Ti3+ or oxygen vacancies has received more and more attentions. Isaac Justicia et al. prepared Ti3+-doped TiO2 thin films with the gap-narrowing induced by the presence of oxygen vacancies which could enhance optical activity in the visible range.13 And then, Chen et al. reported on black TiO2 nanoparticles with narrowing band-gap which was self-doped with Ti3+ in the bulk.14 The above examples indicate that oxygen vacancies and Ti3+ influence the photocatalytic activity of TiO2. Ti interstitial and oxygen vacancies can lead to surface disorder and point defects of the TiO2. Therefore, the electronic and optical property of the TiO2 changes induced by self-structural modification.15–17
Although a certain amount of concentration of doped Ti3+ could enhance photocatalytic activity, it could not avoid the rapid recombination of photo-generated electron–hole pairs. For the sake of achieving an efficient activity under the ultraviolet light (UV) spectrum, the concentration of Ti3+ must be enough to induce a continuous vacancy band of electronic states below the conduction band edge of TiO2.18 Otherwise, lower concentration of doped Ti3+ only gives rise to localized oxygen vacancies states that worsen the electron mobility. Therefore, doping a proper high concentration of Ti3+ in TiO2 is of the vital importance to improve the photocatalytic efficiency.
To date, various methods have been tried to produce Ti3+ and oxygen vacancy doped TiO2. Alberto Naldoni et al. used amorphous TiO2 to produce black TiO2 nanoparticles with narrowing bandgap through thermal treatment in oxidizing atmosphere (O2) or in reducing atmosphere (H2) which oxygen vacancies are present in the bulk anatase crystalline phase.3 Lauren R. et al. prepared TiO2 with a high concentration of self-doped Ti3+ via oxidizing TiH2 in H2O2 followed by calcinations in Ar gas.19 Meanwhile, Ti3+ and oxygen vacancies are often not adequately thermally stable in air. The Ti3+ ions are easy to be oxidized by dissolving oxygen found in water.20 Thus, a facile synthetic method is needed to produce self-doped TiO2 with nice thermal and chemical stabilities. However, the morphology of these obtained TiO2 is always irregular. Among kinds of morphologies of TiO2, one-dimensional TiO2 nanomaterials concluding nanowires and nanobelts with a large specific surface area have attracted widely attention. One-dimensional nanomaterial promotes charge separation and transfer; that is, the photo-generated electrons and holes could be spatially separated and rapidly transferred to the surface active sites.
Consequently, we prepared the Ti3+ self-doped TiO2 with high activity and stability by using a two-step method. Different from the traditionally hydrogenation method, we applied a solution-based, oxidative approach to obtain Ti3+ that are uniformly doped in the bulk of TiO2. The first special key is to choose Ti2O3 as the raw material which could provide TiO2 with high concentration of Ti3+ directly so that it can achieve a high-concentration of Ti3+ doping throughout the TiO2 matrix. Then, the precursor powder of titanic acid was calcinated in nitrogen atmosphere to obtained TiO2 with doping oxygen vacancies. Self-doped TiO2 nanomaterials with different morphology (nanowires or nanobelts) are obtained by changing the hydrothermal temperature. Disparate morphologies as well as the concentration of doped Ti3+ and oxygen vacancies have great influence in photocatalytic efficiency under the UV light. This suggests that a proper high concentration of Ti3+ and oxygen vacancies could improve photocatalytic activity.
Experimental
Chemicals
Ti2O3 (Afar Sally), sodium hydroxide (NaOH) and hydrochloric acid (HCl) were purchased from Tianjin Guangcheng Chemical Company. All chemicals were used without further purification. Deionized water supplied by a Milli-Q synthesis system at 18.2 MΩ cm was used throughout the experiment.Preparation of samples
One-dimensional TiO2−X nanowires were synthesized through a simple hydrothermal and calcinations procedure. First, 0.15 g of Ti2O3 powder was mixed with 20 mL of 10 M NaOH aqueous solution. The mixed solution was stirred about 30 min and then transferred into a Teflon-lined stainless steel autoclave, heated at 150 °C and sustained for 48 h, after that cooled down to room temperature. The obtained powder sample was washed thoroughly with deionized water. The resulting wet powder sample was dispersed in 0.1 M HCl aqueous solution, stirred for 24 h and then washed thoroughly with distilled water to obtain the H-titanate nanowires. The products were isolated from the solution by centrifugation and washed with distilled water for several times, and dried at 60 °C for 10 h. The obtained H-titanate powder was respectively annealing in air and nitrogen atmosphere at 500 °C for 1 h. The blue one-dimensional TiO2−X nanowires with rough surface were obtained. Raising the hydrothermal temperature up to 200 °C and adopting the same experiment procedure, the blue one-dimensional TiO2−X nanobelts were obtained.Characteristics
The crystal structures of samples were identified by a X-ray diffraction (XRD) meter (Bruker D8-Advance, Germany). Photocatalytic activity was assessed by the degradation of methyl orange (MO) under UV-light irradiation (12 W λ = 365 nm) and visible light irradiation (18 W λ ≥ 400 nm). UV-visible absorption spectra were obtained through the diffuse reflection method using a spectrometer (HITACHI U-4100 Japan Hitachi). The morphologies of the samples were investigated by scanning electron microscopy (SEM) (QUANTA 250 FEG) and transmission electron microscopy (TEM) on a JEOL-2100 microscope under an acceleration voltage of 200 kV. The binding energies were characterized by using X-ray photoelectron spectroscopy data (XPS) on an VG Micro Tech ESCA 3000 X-ray photoelectron spectroscope using monochromatic Al Kα with a photon energy of 1486.6 eV at a pressure of 1 × 10⁻⁹ mbar.Photo-catalytic investigation
The photo-catalytic activity of the catalyst was tested by decomposition of the methyl orange solution. A methyl orange solution with the concentration of 10 mg L−1 was first prepared. In each test, about 0.01 g of catalyst was added to ∼25 mL of a MO solution and sonicated for 10 min. Then, the suspension was magnetically stirred for 30 min achieving an adsorption–desorption balance. The degradation process was performed under the UV illumination. At the appropriate reaction time (15 min, 30 min, 1 h, 2 h, 3 h), the 2 mL liquid was taken out. Then, the supernate were isolated from the solution by centrifugation. The concentration of the methyl orange was determined by monitoring the changes in the maximal absorbance at approximately λ = 463 nm characterized by a UV-vis spectrometer.Results and discussion
Scheme 1 shows the formation process of H2Ti3O7 nanowires and nanobelts from Ti2O3. As a result, Ti2O3 samples exhibit purple appearance, which attributed to the color of Ti3+. TiO2−X nanomaterials with one dimension nanostructure were prepared by a two-step method using Ti2O3 as precursors. Because of temperature, the resulting samples have different morphologies such as nanowires and nanobelts. TiO2−X nanomaterials with one dimension nanostructure can be prepared by base-assisted hydrothermal method, which use dissolution–crystallization as its formation mechanism. As we all know, Ti2O3 cannot be dissolved in alkaline solution at room temperature and atmosphere pressure. It was proposed by Andersson et al. that there was a response equation.21| Ti2O3 + NaOH → Na2Ti3O7 + H2O | (1) |
 | ||
| Scheme 1 Formation mechanism of H2Ti3O7 nanowires and nanobelts from Ti2O3. | ||
In the hydrothermal process, the bond of Ti–O–Ti break up which can be dissolved in alkali solution to form [Ti(OH)6]2− structural unit. Ti2O3 first reacts with strong alkali to form nanosheet under increasing hydrothermal temperature. Sodium titanate is then crystallized on nanosheets to form mechanical strain when the temperature is up to 150 °C. As a result, superficial layers curl up and form nanotubes.22 With the extended hydrothermal time, nanotubes grow along the length direction to realize the transformation from nanotubes to nanowires due to the high concentration of alkaline solution and rapid decomposition of the Na2Ti3O7 nanosheets.23 Finally, H2Ti3O7 nanowires are obtained by H+ exchange method.
| Na2Ti3O7 + 2H+ → H2Ti3O7 + 2Na+ | (2) |
In contrast, when the hydrothermal temperature is up to 200 °C, the growth rate of nanosheets may be excessively fast so that nanosheets grow quickly in a short period. The surface layers of nanosheets cannot be able to get more power to curl up. Hence, nanobelts are obtained finally. After H+ exchange, H2Ti3O7 nanobelts maintain the crystal structure of Na2Ti3O7. These results reveal that hydrothermal temperature have a great influence on the morphology of one dimension nanostructure.
The powder XRD analysis was used to investigate the crystal structure of the H-titanate (H2Ti3O7) which was respectively prepared at 150 °C and 200 °C, as shown in Fig. 1. The result shows that the H-titanate is a pure monoclinic phase with low crystallinity without any impurity phases, consistent with the standard diffraction data (JCPDS no. 47-0561). As a result of amorphous crystal structure, H-titanate had poor crystalline, weak XRD peak intensity and low peak position, which were connected with instinct property. No XRD peak of Ti2O3 was observed, indicating that all the Ti2O3 transformed into sodium titanate.
 | ||
| Fig. 1 XRD patterns of H-titanate (H2Ti3O7) nanowires (150 °C) and H-titanate (H2Ti3O7) nanobelts (200 °C). | ||
As shown in Fig. 2, it is clearly shown that the prepared H-titanate have different morphologies under distinct hydrothermal temperatures. H-titanate (H2Ti3O7) nanowires in Fig. 2a were prepared at 150 °C, which had an average length of 500 nm and an average diameter of 5–20 nm. The surface of H-titanate (H2Ti3O7) nanowires is not smooth with some small bumps, which can be clearly found out from HRTEM (see the inset of Fig. 2a). The clear lattice fringes with a d-spacing of around 0.36 nm in the sample, corresponding to the pure anatase (110) plane, indicate the crystal texture of H-titanate. Compared with previously reports for H-titanate morphology, the prepared H-titanate (H2Ti3O7) nanowires revealed a uniform morphology. H-titanate (H2Ti3O7) nanobelts shown in Fig. 2b was obtained via hydrothermal treatment at 200 °C, which revealed a length of about 1.5 μm and a breadth range of 35–300 nm. Nanobelts shaped as fasciculate with good dispersity and with a smooth surface.
 | ||
| Fig. 2 SEM images of the H2Ti3O7 nanowires (a) and H2Ti3O7 nanobelts (b). Inset in (a) shows HRTEM image of the corresponding sample. | ||
For the sake of improving the crystallinity and obtaining nanowires and nanobelts with good dispersity, H-titanate was calcinated at high temperature to yield a light blue powder. Because Ti3+ is easy to be oxidated under air, the H-titanate was also calcinated under N2 atmosphere respectively to avoid the Ti3+ being oxidized. The XRD pattern showed that the structure of the sample became anatase-dominated as shown in Fig. 3, in which samples were calcinated in air and nitrogen. Compared with the standard pattern diffraction card, it is showed that the strong diffraction peaks at 2θ = 25.3, 38.6, 48.0, 55.1 can be indexed to the (101), (112), (200), and (211) crystal plane of anatase TiO2, respectively (PDF card 21-1272, JCPDS). The grain size of samples calcinated in different atmospheres can be calculated by using the Scherrer formula (eqn (3)).
D = kλ/(β![[thin space (1/6-em)]](https://www.rsc.org/images/entities/char_2009.gif) cosθ) cosθ)
| (3) |
 | ||
| Fig. 3 XRD patterns of TiO2−X nanowires and nanobelts which were calcinated in air (a) and in nitrogen (b). | ||
The SEM images of Ti3+-self doped TiO2 nanowires (4a) and nanobelt (4b) calcinated in air at 500 °C are shown in Fig. 4. The result indicates that the calcination do not change the morphologies of nanowires and nanobelts, as well as their width. However, the length of nanobelts decreased after heat treatment. This result confirmed that nanobelts fabricated via the decomposition of H2Ti3O7 to loss water in air at 500 °C. At this temperature, most nanobelts did not damaged while nanobelts may be broken chiefly more than 500 °C. In the inset of Fig. 4a, the clear lattice fringes with a d-spacing of around 0.35 nm in the sample, corresponding to the pure anatase (101) plane, indicate the crystal texture of calcined TiO2−X in the anatase phase. These dates are consistent with the results in the XRD above. As a result, in the process of calcinations, not only morphologies but also the anatase phase of samples could be maintained.
 | ||
| Fig. 4 SEM images of TiO2−X nanowires (a) and nanobelts (b) calcinated in air. Inset of (a) HRTEM images of the corresponding samples. (c) TEM images of TiO2−X nanowires. | ||
H-titanate nanowires and nanobelts revealed bright blue color, as a result of the existence of Ti3+. Compared with the reduction method, the Ti3+ is directly originated from the precursor in the transition process. The UV-vis diffuse reflection spectra of the Ti3+ self-doped TiO2 nanomaterials are shown in Fig. S1.† Taking the TiO2−X nanowires as an example, TiO2−X nanowires calcinated in nitrogen revealed large absorption intensity in a 380–1200 nm region compared with ones calcined in air as shown in Fig. S1.† We could calculate the band edge according to the equation: αhν = A(αhν − Eg)n/2.25,26 The band gaps of different samples are all about 3.2 eV (Fig. 5), which is consistent with the DRS result. Among all the samples, the band gap of TiO2−X nanowires calcinated in nitrogen is the narrowest with 3.15 eV. Most importantly, the Ti3+-self-doped TiO2 sample also displays a broad absorbance in the visible region between 400 and 800 nm. This means the doping of Ti3+ or oxygen vacancies are not sufficient to narrow the band gap of TiO2. The remarkable increase in the UV-light region can be related to the increasing content of Ti3+ in its lattice. Furthermore, the absorption band of the sample extends into the near-IR region. This can be attributed that there is a sub-band located state below the conduction band edge of pure TiO2 because of the high-concentration of Ti3+. TiO2−X nanowires calcinated in nitrogen can obtain sample with high concentration of Ti3+. Therefore, their absorption band edge curves are increased compared with ones calcinated in air.
 | ||
| Fig. 5 Curves of Kubelka–Munk function plotted against the photon energy. The inset is the corresponding band gap. UV-vis diffuse reflection spectra of TiO2−X nanowires (150 °C) and nanobelts (200 °C) calcinated in air and nitrogen. | ||
The X-ray photoelectron spectroscopy (XPS) spectrum of the TiO2−X nanowires is presented in Fig. 6. XPS analysis can be conducted to investigate the state of Ti to obtain more information into the oxygen vacancies in the TiO2−X samples. By means of XPS-peak-differentiation-imitating analysis, the strongest peak of Ti 2p can be divided into two peaks. The binding energy of smallest peak is centered on about 457.6 eV, which is attributed to the presence of Ti3+.27,28 However, the binding energy of the strongest peak of real sample is centered at around 458.9 ± 0.2 eV, which can be ascribed to the presence of Ti4+.29 The relative content of Ti3+ in the reduced TiO2 can be obtained by analyzing the XPS peak areas and thus roughly estimated to be 2.5%. Besides this, TiO2−X samples calcined in nitrogen can also obtain oxygen vacancy by reduction at high temperature, which spurs binding energy of O 1s to shift to lower location. As is shown in Fig. 6c, the strongest peak of O 1s can be divided into two peaks and the binding energy of the peak of oxygen vacancies is around 529.8 eV. By analyzing the XPS peak areas, he relative content of oxygen vacancies in the reduced TiO2 can be roughly estimated to be 2.54%. As a consequence, transformation of binding energy could be ascribed to the doped Ti3+ and oxygen vacancies comparing with pure TiO2.
 | ||
| Fig. 6 XPS spectrum of Ti3+ self-doped TiO2−X nanowires. (a) Survey XPS spectrum. (b) Ti 2p XPS spectrum; (c) O 1s XPS spectrum. | ||
The photocatalytic activity of Ti3+-self-doped anatase sample was evaluated by the decomposition of an organic dye molecule under UV light. As shown in Fig. 7a, TiO2−X nanowires calcinated in air has a negligible activity under UV light irradiation. In contrast, samples calcinated in nitrogen revealed a relatively enhanced photocatalytic performance with the degradation of methyl orange above 70% in two hours. This can be attributed to high concentration of Ti3+ and oxygen vacancies, which provides more catalysis active sites for photocatalysis at the surface of TiO2−X nanowires. On the other hand, it has been reported that the Ti3+ in the titania material decreased the resistance of TiO2 and increased the chemisorbed oxygen species, thus enhancing the surface reaction activity on the other.30 The Ti3+ is more difficult to be oxidized when annealed in N2 atmosphere, therefore, the Ti3+ concentration of the TiO2 annealed in N2 is higher than ones annealed in air, considering this, the photocatalytic results could be easily understood. However, TiO2−X nanobelts calcinated in nitrogen did not reveal enhanced photocatalytic activity (see Fig. 7a). This is ascribed to the excessive concentration of Ti3+ located in the bulk TiO2−X lattice matrix and the introduction of detect sites in the lattice. It is known that the degradation of MO aqueous solution accords with pseudo-first order kinetics by linear transforms ln(C/C0) = −kt, where C0 is the initial concentration of MO solution, C is the concentration of MO solution at time t, and k is kinetic constant. The corresponding kinetic constants (k) were calculated and given in Fig. 7b. Under the same experimental conditions, the kinetic constant of MO solution photodegradation of 150 °C-N2 which reaches to 0.00824 min−1 is highest among three samples. These results are in line with the conclusion of DRS. TiO2−X nanowires photocatalysts with narrowest band gap have the best photocatalytic activity. To investigate the stability of the TiO2−X photocatalysts under UV irradiation, the same samples TiO2−X nanowires were repeatedly used for five times after separation via centrifugation, and are shown in Fig. 7c. It is with regret that the TiO2−X nanowires photocatalysts is not very stable for repeated use under UV irradiation. The photocatalytic activity of TiO2−X photocatalysts decreases slowly after repeated for several times, and the photocatalytic degradation efficiency of MO is about 53% after repeatedly five times for 3 h. It could be attributed to the photo-corrosion. Photo-induced holes first oxidate self-Ti3+ under UV irradiation, which results in decreasing the photocatalytic activity of TiO2−X photocatalyst. As is shown in Fig. 7d, under visible light irradiation the photocatalytic activity of TiO2−X nanowires is better than that of P25, whose photocatalytic degradation efficiency for MO is about 45% in three hours. Therefore, the photocatalytic activity of TiO2 could be improved by Ti3+-self-doping under visible light irradiation. The recycling degradation experiments over TiO2−X nanowires under visible light irradiation were investigated in Fig. 7e. After repeatedly four times for 3 h, the photocatalytic degradation efficiency of MO is about 42%. The as-prepared TiO2−X nanowires (150 °C-N2) shows a good catalytic stability, maintaining a similar level of reactivity under visible light irradiation. The slight decrease should originate from the inescapable loss of catalyst during the recycling process instead of photo-corrosion. Therefore, Ti3+-self-doped TiO2−X nanowires show unstability under UV irradiation, which should be improved in further study.
 | ||
| Fig. 7 (a) Photocatalytic activity of TiO2−X nanowires calcined in air (150 °C-O2) and in nitrogen (150 °C-N2), TiO2−X nanobelts calcinated in nitrogen (150 °C-N2) under UV light. (b) The corresponding rate constant of MO aqueous solution photodegradation on various photocatalysts under UV light. (c) Recycling runs in the photodegradation of MO over the TiO2−X nanowires (150 °C-N2) under UV irradiation. (d) Photocatalytic activity of TiO2−X nanowires (150 °C-N2) and P25 under visible light. (e) Recycling runs in the photodegradation of MO over the TiO2−X nanowires (150 °C-N2) under visible light irradiation. | ||
From the above results, we could conclude that parts of detect sites provide recombination center of photon-generated carriers. These results also reveal that not only the concentration of Ti3+ in the bulk but also the morphology of the TiO2 influence photodegradation activity of Ti3+-self-doped TiO2−X most. Meanwhile, all the samples exhibit no activity under visible light irradiation. The main reason for this result is that the light absorption was induced by thermal or photo-excitation of the electrons in occupied states, rather than the narrowing of band gap. Therefore, under visible light irradiation, the energy of the photo-carriers is too small to decompose the MO molecules.
Scheme 2 shows an illustration of photocatalytic mechanism of Ti3+ self-doped TiO2−X. Photocatalytic mechanism is explained as follows. A strong absorption in an UV-light region is a precondition for the photocatalytic reaction. Ti2O3 provide Ti3+ directly for TiO2−X one-dimensional materials. The efficiency of photodegradation activity of TiO2−X largely depends on the incorporation of Ti3+ in the TiO2 lattice matrix. The existence of Ti3+ in the TiO2 lattice matrix shows that the oxygen vacancies will be generated to maintain the electrostatic balance. Ti3+ doping and accompanying oxygen vacancies can produce isolated-states in the forbidden gap. These Ti3+ defects are occupied states and serve as donors. Photo-generated electrons in these isolated sites are excited to conduction band (CB) by UV-light illumination to form the unoccupied states. Meanwhile, the electrons in the valence band (VB) can be excited to those unoccupied sites. However, these Ti3+ sited are electron traps; photogenerated charge carriers are apt to recombined at these sites. As a result, Ti3+ decreases its photocatalytic activity under UV light.
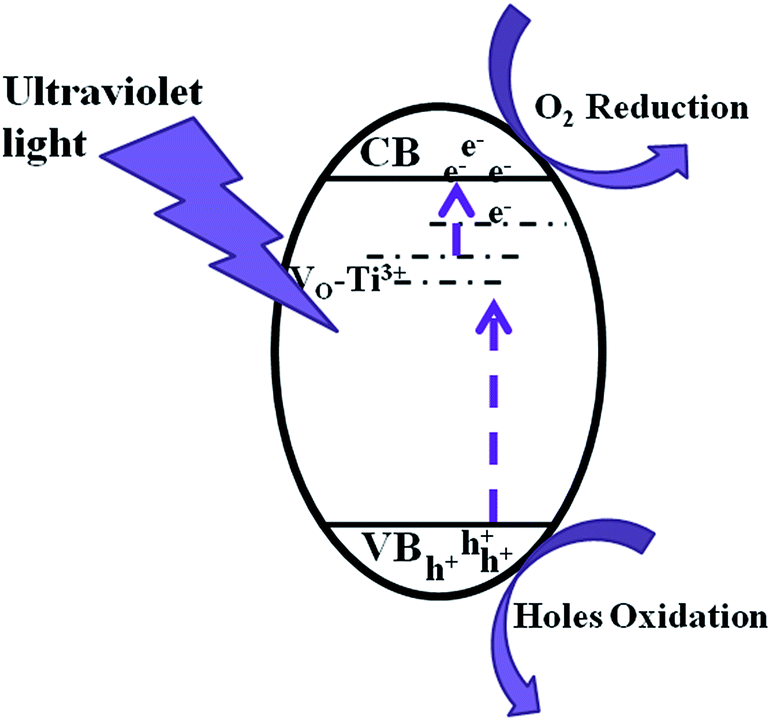 | ||
| Scheme 2 Illustration of photocatalytic mechanism of Ti3+ self-doped TiO2−X. | ||
Conclusions
In summary, we developed a simple two-step method to prepare Ti3+ self-doped TiO2, materials with on dimension nanostructure using Ti2O3 as precursors. The obtained samples with different hydrothermal temperature have different morphologies such as nanowires and nanobelts. We concluded that the enhanced photocatalytic activity of samples is attributed to the enhanced light absorption resulting from the narrowing of the band gap. The proper concentration of Ti3+ and oxygen vacancies results in the efficient separation of photogenerated charge carriers in these nanostructures.Acknowledgements
This work was supported in part by the project from National Basic Research Program of China (973 Program, 2013CB632401), the program for Taishan Scholars, the projects from National Natural Science Foundation of China (51202090, 51302106, 51402123, and 51402124).Notes and references
- A. Fujishima and K. Honda, Nature, 1972, 238, 37 CrossRef CAS PubMed.
- A. Kudo and Y. Miseki, Chem. Soc. Rev., 2009, 38, 253 RSC.
- A. Naldoni, M. Allieta and S. Santangelo, et al., J. Am. Chem. Soc., 2012, 134, 7600 CrossRef CAS PubMed.
- P. Sathishkumar, R. V. Mangalaraja and H. D. Mansilla, et al., Appl. Catal., B, 2014, 16, 692 CrossRef PubMed.
- X. Z. Li and F. B. Li, Environ. Sci. Technol., 2001, 35, 2381 CrossRef CAS.
- C. Chen, W. Ma and J. Zhao, Chem. Soc. Rev., 2010, 39, 4206 RSC.
- I. C. Kang, Q. W. Zhang, S. Yin, T. Sato and F. Saito, Appl. Catal., B, 2008, 80, 81 CrossRef CAS PubMed.
- Y. Cong, J. L. Zhang, F. Chen and M. Anpo, J. Phys. Chem. C, 2007, 111, 6976 CAS.
- M. Pelaez, N. T. Nolan and S. C. Pillai, et al., Appl. Catal., B, 2012, 125, 331 CrossRef CAS PubMed.
- P. Sathishkumar, R. V. Mangalaraja, O. Rozas, H. D. Mansilla, M. A. Gracia-Pinilla and S. Anandan, Ultrason. Sonochem., 2014, 21, 1675 CrossRef CAS PubMed.
- N. A. Ramos-Delgado, L. Hinojosa-Reyes, I. L. Guzman-Mar, M. A. Gracia-Pinilla and A. Hernández-Ramírez, Catal. Today, 2013, 209, 35 CrossRef CAS PubMed.
- I. Medina-Ramírez, J. L. Liu and A. Hernández-Ramírez, et al., J. Mater. Sci., 2014, 49, 5309 CrossRef.
- I. Justicia, G. Garciaa, L. Vazquez, J. Santiso, P. Ordejon, G. Battiston, R. Gerbasi and A. Figueras, Sens. Actuators, B, 2005, 109, 52 CrossRef CAS PubMed.
- X. B. Chen, L. Liu, P. Y. Yu and S. S. Mao, Science, 2011, 311, 749 Search PubMed.
- Y. Tachibana, L. Vayssieres and J. R. Durrant, Nat. Photonics, 2012, 6, 511 CrossRef CAS PubMed.
- X. Chen, S. Shen, L. Guo and S. S. Mao, Chem. Rev., 2010, 110, 6503 CrossRef CAS PubMed.
- X. Chen, C. Li, M. Graetzel, R. Kostecki and S. S. Mao, Chem. Soc. Rev., 2012, 41, 7909 RSC.
- Q. Zhu, Y. Peng, L. Lin, C. M. Fan, G. Q. Gao, R. X. Wang and A. W. Xu, J. Mater. Chem. A, 2014, 2, 4429 CAS.
- L. R. Grabstanowicz, S. Gao, T. Li, R. M. Rickard, T. Rajh, D. J. Liu and T. Xu, Inorg. Chem., 2013, 52, 3884 CrossRef CAS PubMed.
- K. Komaguchi, T. Maruoka, H. Nakano, I. Imae, O. Y. oyama and Y. Harima, J. Phys. Chem. C, 2010, 114, 1240 CAS.
- S. Andersson and A. D. Wadsley, Acta Crystallogr., 1962, 15, 194 CrossRef CAS.
- B. D. Yao, Y. F. Chen, X. Y. Zhang, W. F. Zhang and Z. Y. Yang, Appl. Phys. Lett., 2003, 82, 280 Search PubMed.
- S. Zhang, L. M. Peng and Q. Chen, et al., Phys. Rev. Lett., 2003, 9, 256103 CrossRef.
- N. A. Ramos-Delgado, M. A. Gracia-Pinilla and L. Maya-Trevino, et al., J. Hazard. Mater., 2013, 263, 36 CrossRef CAS PubMed.
- J. Tauc, Mater. Res. Bull., 1970, 5, 721 CrossRef CAS.
- J. Zeng, H. Wang, Y. C. Zhang, M. K. Zhu and H. Yan, J. Phys. Chem. C, 2007, 111, 11879 CAS.
- W. Wang, C. H. Lu, Y. R. Ni, J. B. Song, M. X. Su and Z. Z. Xu, Catal. Commun., 2012, 22, 19 CrossRef CAS PubMed.
- F. Zuo, K. Bozhilov, R. J. Dillon, L. Wang, P. Smith, X. Zhao, C. Bardeen and P. Y. Feng, Angew. Chem., Int. Ed., 2012, 124, 6327 CrossRef PubMed.
- X. Y. Yang, C. Salzmann, H. H. Shi, H. Z. Wang, M. L. H. Green and T. C. Xiao, J. Phys. Chem. A, 2008, 112, 10784 CrossRef CAS PubMed.
- J. Su, X.-X. Zou, Y.-C. Zou, G.-D. Li, P.-P. Wang and J.-S. Chen, Inorg. Chem., 2013, 52, 5924 CrossRef CAS PubMed.
Footnote |
| † Electronic supplementary information (ESI) available. See DOI: 10.1039/c5ra07079a |
| This journal is © The Royal Society of Chemistry 2015 |