DOI:
10.1039/C5RA07024D
(Paper)
RSC Adv., 2015,
5, 59273-59285
Preparation and characterization of the linked lanthanum carboxymethylcellulose microsphere adsorbent for removal of fluoride from aqueous solutions
Received
18th April 2015
, Accepted 25th June 2015
First published on 25th June 2015
Abstract
Linked carboxymethyl cellulose microspheres loaded with lanthanum(III) (linked-CMC–La) were fabricated with glutaraldehyde, from lanthanum carboxymethyl cellulose microspheres (CMC–La), and used to remove fluoride from aqueous solution. Characterization by SEM, resistance to acid and alkali, TG, pHpzc and FT-IR was used to distinguish the superiority of the two adsorbents. The results showed that the linked-CMC–La had a higher decomposition temperature (200 °C) than CMC–La (190 °C) and a better resistance to acid and alkali compared with CMC–La. Batch adsorption experiments were also performed, varying factors of pH, initial fluoride concentration, and contact time. The results showed that the maximum removal efficiencies (REs) of CMC–La and linked-CMC–La were about 98.85% and 99.31%, respectively, when the fluoride concentration was 40 mg L−1 at pH 4.0. The adsorption process could be described well using the Langmuir isotherm model. The adsorption kinetics data was fitted well using a pseudo-second-order model. The analysis of the adsorption and desorption of the linked-CMC–La and CMC–La revealed that crosslinking had no obvious effect on the removal efficiency or mechanism of the adsorption and desorption of the two absorbents. The surface adsorption occurred between the linked-CMC–La and fluoride due to Lewis acid–base interaction and supplemented with electrostatic attractions.
1. Introduction
Fluorine is a trace element necessary for the human body.1 However, when its concentration is above 1.5 mg L−1, fluoride can lead to many health issues, such as mottling of teeth, thyroid disorder, fluorosis of the skeleton, and neurological damage.2–4 Therefore, removal of fluoride from water sources is necessary. Up to now, defluoridation has been achieved by adsorption,5 precipitation,6 donnadialysis,7 ion exchange,8 membrane separation9 and electrodialysis.10 Among these, adsorption is considered as one of the most convenient and economical methods for wastewater, especially for low concentration wastewater.11
However, the viability of the adsorption technique greatly depends on the adsorbent.12 According to the adsorbent materials, adsorption can be divided into rare earth adsorption,13 bone charcoal adsorption,14,15 aluminum salt adsorption16 and biosorption.17 Biosorption has been chosen as one of the most promising methods due to its environmentally-friendly properties.
Lanthanum shows a high affinity for fluoride ions.18 Various adsorbents, such as gelatin,19 chitosan beads20 and Sargassum sp.21 loaded with La(III) have been used for the purpose of fluoride removal. Microsphere adsorbents, such as synthetic resins,22 are also widely used for fluorine removal by loading them with La(III). In this present work, sodium carboxymethyl cellulose (CMC) was chosen as the new microsphere biomaterial because of its abundant resources23 and large number of active groups, such as hydroxy and carboxyl. The active groups have a tendency to form complexes with metal ions and crosslinking agents.24 Though the carboxymethylcellulose loaded with only metal ions had good adsorption capacity for fluoride,25 it did not show good mechanical properties and acid and alkali resistance, which limits its possible applications. Cross-linkers are usually used to modify the chemical structure and textural properties of a polymer by intermolecular and intramolecular linking to improve its properties.
In this study, we attempted (i) to make carboxymethylcellulose as a matrix together with lanthanum to prepare a CMC–La microsphere adsorbent, with glutaraldehyde chosen as a crosslinking agent to improve the thermostability and acid and alkali resistance of the CMC–La microspheres, (ii) to characterize the difference between the two adsorbents, CMC–La and linked-CMC–La, and (iii) to deduce the mechanism of the adsorption and desorption process of fluoride.
2. Material and methods
2.1. Reagents
CMC was purchased from Aladdin Chemistry Company, Ltd. (Shanghai, China). LaCl5·7H2O, C5H8O2, NaF, NaOH, C5H8O2 and HCl were purchased from Kelong Chemicals. NaOH and HCl were each prepared at a concentration of 0.05 mol L−1. In addition, all reagents were analytically pure.
2.2. Microsphere preparation of CMC–La and linked-CMC–La
Sodium carboxymethyl cellulose was dispersed in ultra-pure water and stirred at high speed at room temperature to form a uniform 3% (w/v) solution. The sodium carboxymethyl cellulose solution was automatically dropped into a 5% (w/v) solution of LaCl5·7H2O using an injection pump at a speed of 7.94 μm min−1 and the CMC–La microspheres were formed. After that, 5 mL of 50% (volume) C5H8O2 was added into the aqueous solution and the linking process of the microspheres carried out for another 24 h. The linked-CMC–La microspheres were filtered, washed with deionized water to remove any residual ions and dried for ten hours at 45 °C for further experiments.
2.3. Characterization of CMC–La and linked-CMC–La
2.3.1. SEM examination of CMC–La and linked-CMC–La. Morphology analysis of CMC–La and linked-CMC–La was carried out using scanning electron microscopy (SEM, EVO18, Carl Zeiss, Germany). The samples were mounted on a bronze stub, sputter-coated with gold in a sputtering device for 1.5 min at 10 mA and examined at a 20 kV accelerating voltage.
2.3.2. Density and compressive resistance of CMC–La and linked-CMC–La. Density (bulk density and wet true density) was measured using the experimental method. Firstly, 15 mL ultrapure water was added into a 50 mL measuring cylinder and the total mass (m1 g) was measured on a balance. Secondly, 2 mL microsphere adsorbent was added into the cylinder and m2 (g) was attained with the same balance. Thus, the mass of the sample was the difference between m2 and m1, namely (m2 − m1). Thirdly, the sample volume (V mL) was also obtained from the difference between the before and after volume. The bulk density (g mL−1) was calculated as in eqn (1). Then, the cylinder was filled with water and the total mass was m4. After throwing out the adsorbent, the cylinder was filled with water again and the mass m3 recorded. The wet true density was calculated as in eqn (2).| | |
dT = m2 − m1/(m2 − m1) − (m4 − m3)
| (2) |
Compressive resistance is one of the factors in adsorbent application. Approximately 14–15 microspheres were examined before drying with a texture analyzer (B. XTPlus, Stable Micro Systems Corporation, UK).26 A sample was positioned on the stage to ensure that the probe evenly contacted the sample surface. The test was performed at a constant speed of 4 mm s−1 and was stopped when the samples were crushed to the same degree of deformation. At this time, the peak pressure force that was displayed in the software interface was defined as the compressive strength of the samples. The final data was the average value of the 14–15 microspheres.
2.3.3. N2 adsorption–desorption of CMC–La and linked-CMC–La. N2 adsorption and desorption experiments were conducted with a JW-BK112 Surface Area Analyzer and Pore Size Analyzer. The N2 adsorption–desorption isotherms could provide information about the pore volume, surface area and pore size distribution.
2.3.4. The resistance of CMC–La and linked-CMC–La to acid and alkali. An experimental method was used to investigate the acid and alkali resistance of adsorbents. Experiments were conducted in a batch of 250 mL glass-stoppered flasks with 100 mg L−1 fluorine solution. Firstly, the initial pH values of the solutions were adjusted to 1 to 12 with HCl (0.05 mol L−1) and NaOH (0.05 mol L−1). Secondly, 0.2 g of adsorbent was added into each flask and the flasks were shaken in an electrically thermostatic reciprocating shaker at 180 rpm for 72 h. Finally, the resistance of the adsorbent to acid and alkali was obtained by observing the dissolution properties of the adsorbent at different pH values.
2.3.5. Thermal properties analysis of CMC–La and linked-CMC–La. The thermal stabilities of CMC–La and linked-CMC–La were measured using thermogravimetric analysis (Q600, TA Instrument Corporation, USA). The samples were gradually heated at a rate of 20 °C min−1 from 20 to 800 °C under the protection of N2 with a flow rate of 20 mL min−1.
2.3.6. Analysis of the point of zero charge of the adsorbents. A solid addition method27 was used to investigate the point of zero charge (pHpzc) of the adsorbents. Experiments were conducted in a batch of 50 mL glass-stoppered flasks containing 0.1 mol L−1 KNO3. Firstly, the initial pH (pHi) values of the KNO3 solutions were adjusted to 3 to 11 with HCl (0.05 mol L−1) and NaOH (0.05 mol L−1). Secondly, 0.1 g of adsorbent was added into each flask and the flasks were shaken in an electrically thermostatic reciprocating shaker at 180 rpm for 48 h. Finally, the pH of those solutions (pHt) was detected. The difference value between pHt and pHi (ΔpH = pHi − pHt) was plotted versus pHi, and the intersection between the curve and abscissa was pHpzc.
2.3.7. Fourier transform-infrared spectroscopy (FT-IR) analysis. Both CMC–La and linked-CMC–La were analysed using a Fourier transform-infrared spectrometer (Nicolet-6700, USA) in the wavenumber range of 400–4000 cm−1. Prior to the measurement of FT-IR, the adsorbents were placed in an oven at 55 °C for 24 h and then pressed into discs with potassium bromide.
2.4. Batch adsorption experiment for fluoride
Batch adsorption experiments were carried out with various pH values, fluoride concentrations and contact times. Adsorption experiments were conducted in triplicate in a 250 mL stoppered conical flask containing 50 mL of fluoride solution and a certain dosage of adsorbent. The flask was shaken in an electrically thermostatic reciprocating shaker at 180 rpm for a predetermined contact time. The fluoride removal efficiencies of the adsorbents were evaluated by measuring the time-dependent concentrations of fluoride. The average value of the results (differences less than 3%) was used for data analysis. In addition, the pH of the initial fluoride solution was adjusted using NaOH and HCl solutions.
Then, the solid–liquid mixtures were filtered, and the filtrates were analyzed with a Metrohm 881-Compact-IC-Pro using a calibration curve (linear equation: Y = 0.0158012X − 0.285042, where Y is absorbance and X is fluoride concentration in mg L−1; R2 = 0.999). The removal efficiency (RE) was calculated as follows.28
| | |
RE (%) = (C0 − Ce)/C0 × 100
| (3) |
where
C0 (mg L
−1) and
Ce (mg L
−1) are the initial fluoride concentration and fluoride concentration after adsorption, respectively.
2.5. Regeneration experiments of the adsorbents
Desorption of the adsorbed fluorine from CMC–La and linked-CMC–La was studied via static experiments. The adsorbent (0.2 g) was dispersed in a 250 mL stoppered conical flask containing 50 mL of 100 mg L−1 fluorine solution as mentioned in the adsorption procedure. Once equilibrium was reached, the adsorbent which was loaded with fluorine was filtered out and dried. Then the adsorbent was placed in a 250 mL stoppered conical flask containing 50 mL NaOH solution for desorption. The pH of the desorption solution varied from 9.0 (CMC–La) to 11.0 (linked-CMC–La). Then, the flask was kept in an orbital shaker at 180 rpm for a 24 h period at room temperature (25 °C). The final fluorine concentration in the filtrate was detected and the desorption ratio was calculated based on the removal efficiency. The maximum adsorption–desorption times of the two adsorbents were also recorded. All experiments were carried out in duplicate and showed differences less than 3%.
3. Results and discussion
3.1. SEM
The photo and SEM micrographs of adsorbents were presented in Fig. 1. The images illustrated that the adsorbents were granular. Compared with the CMC–La (Fig. 1a), the linked-CMC–La (Fig. 1b) was regular microsphere. Although, the surface of two kinds of adsorbents were marked with a number of creases (Fig. 1c and d), which increased the contact area and improved ions adsorption capacity, the surface of linked-CMC–La appeared more creases per surface unit of the adsorbent. The formation of a large number of folds on the surface of adsorbents may be caused by water evaporation and surface shrinking of gel pellet. More water evaporation and surface shrinking were, more creases on the surface of adsorbents and more dense texture of gel particles were. The results from Fig. 1c and d indicated that linking process made a contribution to shaping the adsorbents and densification of the gel particles. Compared Fig. 1c–e and Fig. 1d–f, respectively, there was no obvious change in the creases on the surface of the adsorbent, which indicated the adsorbent was relatively stable in the adsorption process.
 |
| | Fig. 1 Photos and SEM images of adsorbents ((a) digital photo of CMC–La, (b) digital photo of linked-CMC–La, (c) SEM of CMC–La, magnification ×2000, (d) SEM of linked-CMC–La, magnification ×2000, (e) SEM of CMC–La after adsorption, magnification ×2000, (f) SEM of linked-CMC–La after adsorption, magnification ×2000). | |
3.2. Density and compressive resistance
The compressive resistances and densities of the adsorbents are shown in Table 1. The compressive force of CMC–La was 92.125 g while the force of the linked-CMC–La was 310.467 g. According to this, the linking process improved the compressive resistance of the adsorbent, which may be caused by densifying of the gel particles. This is also consistent with the results of the SEM.
Table 1 Compressive resistance and density characteristics of CMC–La and linked-CMC–La
| Adsorbent |
Force (g) |
Bulk density (g mL−1) |
Wet true density |
| CMC–La |
92.125 |
1.521 |
1.853 |
| Linked-CMC–La |
310.467 |
1.447 |
1.609 |
As for the density, both the bulk density and wet true density of CMC–La were denser than those of linked-CMC–La. This may due to the greater water absorbency of CMC–La than that of linked-CMC–La.
3.3. N2 adsorption–desorption of CMC–La and linked-CMC–La
The results of the N2 adsorption–desorption analysis are shown in Table 2. The specific surface areas of CMC–La and linked-CMC–La, which were calculated from the multipoint BET model, were 4.132 and 1.798 m2 g−1, respectively. The total pore volumes of CMC–La and linked-CMC–La were 0.0036 and 0.0023 cm3 g−1, respectively.
Table 2 Pore structure parameters of CMC–La and linked-CMC–La
| Adsorbent |
Surface area (m2 g−1) |
Total pore volume (cm3 g−1, ×10−3) |
Average pore size (nm) |
| CMC–La |
4.132 |
3.6 |
7.051 |
| Linked-CMC–La |
1.798 |
2.3 |
6.334 |
The pore distribution is also shown in Fig. 2. From Fig. 2, the average pore sizes of CMC–La and linked-CMC–La were, respectively, 7.051 nm and 6.334 nm (Table 2), and they were mostly distributed around 6 nm.
 |
| | Fig. 2 The pore distribution of CMC–La and linked-CMC–La. | |
3.4. Analysis of acid and alkali resistance
The results of the resistance of the adsorbents to acid and alkali are shown in Fig. 3. The previous preliminary experimental results showed that a solution pH of 3 to 11 was the critical range of the resistance of the adsorbent to acid and alkali, and 4 was the best adsorption pH for fluoride by the adsorbents. Therefore, three values of typical pH of 3, 4, and 11 were chosen for the acid and alkali resistance tests of the adsorbents. After shaking in solutions of different pH for 72 h, the microspheres of CMC–La were obviously swelling (Fig. 3a1) when the pH value was 3 and when the pH was 4 there was no significant change except a slight swelling in appearance of CMC–La (Fig. 3b1). However, the adsorbent of CMC–La decomposed (Fig. 3c1) more or less when the pH value was 11 and were not microspheres any more, leading to the adsorption solution turning cloudy. The swelling and dissolution of the linked-CMC–La at the different pH values of the adsorption solution (3, 4 and 11) are shown in Fig. 3a2, b2 and c2, respectively. Compared with CMC–La, linked-CMC–La showed better acid and alkali resistance. There was no sign of dissolution and the adsorption solution was still clear. According to this, the linking process improved the resistance of the adsorbent to acid and alkali. This may be due to the cellulose chain interaction which is related to the presence of glutaraldehyde.29
 |
| | Fig. 3 Digital images of CMC–La and linked-CMC–La at different pH values (a1, a2: pH 3; b1, b2: pH 4; and c1, c2: pH 11, respectively). | |
3.5. Thermal properties analysis
Thermogravimetric analysis is a standard method for estimating the relative stability of a material according to the thermal decomposition temperature. Thermogravimetric curves of CMC–La and linked-CMC–La in the range of 0 °C to 800 °C are shown in Fig. 4 and the DTG curve exhibited the same three-stage decomposition band in the two adsorbents. According to the DTG curve, the different decomposition processes of the two adsorbents lay in the first stage where the decomposition temperature of CMC–La was 190 °C while that of linked-CMC–La was 200 °C, which was slightly higher than CMC–La. This could lead to the conclusion that the cross linking made CMC–La more stable in the first decomposition process and the linked sites were the hydroxyl groups of the carboxymethylcellulose.30 The weight loss of both CMC–La and linked-CMC–La was 45%.
 |
| | Fig. 4 Thermal analysis showing TGA of adsorbents. | |
3.6. Analysis of the point of zero charge of adsorbents
The pHpzc is a vital parameter to determine the net electrical neutrality of an adsorbent. When the pH is below pHpzc, the surface charge is positive.31 The plot of pHi versus ΔpH is shown in Fig. 5. The pHpzc values of CMC–La and linked-CMC–La in aqueous solution were at pH 5.7 and pH 4.8, respectively. Therefore, the adsorbents surface presented a positive charge below pH 5.7 and pH 4.8. Consequently, electrostatic attraction between the positive adsorbent and fluoride existed below pH 5.7 and pH 4.8.32
 |
| | Fig. 5 Determination of the point of zero charge of adsorbents. | |
3.7. Analysis of FT-IR
The FT-IR spectra of the adsorbent materials are presented in Fig. 6. For CMC–La, the broad peaks around 3399 cm−1 and 1063 cm−1 were assigned to the stretching modes of the –OH bonds, and combined vibrations related to bending in –OH were observed at 1330 cm−1.14,33 The peak at 2924 cm−1 was due to the stretching vibration of the –CH– bonds.34 The bands in CMC–La at 1590 cm−1 and 1423 cm−1 were assigned to antisymmetric stretching and symmetric stretching of the carboxylic groups.35 The bands between 1000 and 600 cm−1 correspond to sugar vibrations.36 Comparing linked-CMC–La with CMC–La, although faint changes in the positions of individual bands such as 1587 cm−1, 1328 cm−1, 1061 cm−1 were seen, caused by linking of the glutaraldehyde, a significant increase in the band intensity is noticeable in the wave number range 2924 cm−1. This is related to the presence as well as to the formation of new C–H bonds in the considered system, which demonstrated the occurrence of the linking process.37
 |
| | Fig. 6 FT-IR of CMC–La and linked-CMC–La. | |
3.8. Effect of pH
The effects of pH on the removal efficiency of the adsorbents were studied by the adjusting pH of the aqueous solution from 3 to 11 and results are shown in Fig. 7. From Fig. 7, the removal efficiency decreased with the increase in the pH from 3 to 11, and the maximum removal efficiencies of CMC–La and linked-CMC–La were about 93% and 98% in acid solution, respectively. According to this, the cross-linking agent had a positive impact on the removal efficiency.
 |
| | Fig. 7 Effect of pH on adsorption amount and removal efficiency of fluoride by CMC–La and linked-CMC–La. | |
The electrostatic attraction may be the reason why the removal efficiency decreased with the increase in the pH. When the pH was below pHpzc, the surface charge was positive, and the charge numbers decreased with the increase in the pH and the removal efficiency decreased with the increase in the pH. When the pH was above pHpzc, the surface charge was negative, and the charge numbers increased with the increase in the pH and removal efficiency decreased with the increase in the pH. As the adsorption of fluoride occurred in both acidic and basic aqueous solution, the electrostatic attraction may not be the only reason for the adsorption of fluoride.
3.9. Effect of contact time and kinetics of fluoride adsorption
The effects of contact time on the adsorption by CMC–La and linked-CMC–La were studied and the results are shown in Fig. 8. The contact time ranged from 5 min to 24 h. The removal efficiency of CMC–La increased rapidly in the first 60 minutes and reached equilibrium at 60 minutes, while that of linked-CMC–La increased rapidly in the first 120 minutes and reached equilibrium at 120 minutes. The equilibrium removal efficiencies of CMC–La and linked-CMC–La were about 93% and 98%, respectively. After adsorption, the pH of the solutions containing CMC–La and linked-CMC–La changed to about 6.4 when the initial pH was about 4.0.
 |
| | Fig. 8 Effect of contact time on adsorption amount and removal efficiency of fluoride by CMC–La and linked-CMC–La. | |
To investigate the mechanism of adsorption and its potential rate-controlling steps, different kinetic models including intra-particle diffusion models, the Elovich equation, pseudo-first-order and pseudo-second-order models were examined.
The intra-particle diffusion model is given in eqn (4).38
where
Ki (mg g
−1 min
−1/2) is the intra-particle diffusion rate constant and
C (mg g
−1) is the intercept. The intra-particle diffusion is shown in
Fig. 9. According to
eqn (4), a plot of
Qt versus t1/2 should be a straight line with a slope
Ki and intercept
C when the adsorption mechanism follows the intra-particle diffusion process. For the intra-particle diffusion model, it was essential for the
Qt versus t1/2 plots to go through the origin if the intra-particle diffusion was the sole rate-limiting step. According to
Fig. 9, no plot passed through the origin. This indicated that although intra-particle diffusion was involved in the adsorption process, it was not the sole rate-controlling step. The sorption process tended to follow two phases. It was found that an initial linear portion ended with a smooth curve followed by a second linear portion. The two phases in the intra-particle diffusion plot suggested that the sorption process proceeded by surface sorption and intra-particle diffusion. The initial curved portion of the plot indicated a boundary layer effect while the second linear portion was due to intra-particle or pore diffusion.
39
 |
| | Fig. 9 Intra-particle diffusion model for the adsorption of fluoride on CMC–La and linked-CMC–La. | |
The adsorption data was further analyzed using the Elovich model. The Elovich equation is given as follows:
| |
Qt = 1/b![[thin space (1/6-em)]](https://www.rsc.org/images/entities/char_2009.gif) ln(ab) + 1/blnt ln(ab) + 1/blnt
| (5) |
where
b is the initial adsorption rate (mg g
−1 min
−1), and the
a parameter is the desorption constant (g mg
−1). When the adsorbate ions and the surface sites interact chemically through a second-order mechanism, the application of the Elovich equation may be more appropriate.
40 Fig. 10 shows a plot of
Qt versus ln
t for the Elovich equation at 298 K. The parameters of the Elovich equation are shown in
Table 3. The Elovich equation predominantly described chemical adsorption on highly heterogeneous adsorbents, but the equation did not propose any definite mechanism for the adsorbate–adsorbent interaction. The coefficients were significantly dependent on the amount of adsorbent with
a being much more sensitive.
 |
| | Fig. 10 Elovich model for the adsorption of fluoride on CMC–La and linked-CMC–La. | |
Table 3 Parameters of pseudo-first-order kinetics, pseudo-second-order kinetics and Elvoich models for fluoride removal
| Adsorbent |
Qe(exp) (mg g−1) |
Pseudo-first-order kinetics |
Pseudo-second-order kinetics |
Elovich |
| K1 (min−1) |
Qe(cal) (mg g−1) |
R2 |
K2 (g mg−1 min−1) |
Qe(cal) (mg g−1) |
R2 |
h (mg g−1 min−1) |
b (g mg−1) |
a (mg g−1 min−1) |
R2 |
| CMC–La |
34.25 |
0.00421 |
2.21 |
0.222 |
0.0015 |
34.65 |
0.999 |
2.89 |
0.085 |
3.19 |
0.964 |
| Linked-CMC–La |
26.27 |
0.0194 |
5.64 |
0.974 |
0.0099 |
26.58 |
0.999 |
1.12 |
0.51 |
2.89 |
0.955 |
Then, the kinetics were also investigated through Lagergren pseudo-first-order (eqn (6))34 and Lagergren pseudo-second-order (eqn (7)) models.36 The equilibrium adsorption amount (Qe) was calculated as in eqn (8). The mechanism of adsorption and its potential rate-controlling steps were also studied.
| | |
ln(Qe − Qt) = lnQe − K1t
| (6) |
| | |
t/Qt = t/Qe + 1/K2Qe2
| (7) |
where
Qe is the equilibrium adsorption amount and
Qt is the adsorption amount at time
t. When the adsorption process was at equilibrium,
Qt was equal to
Qe.
K1 (min
−1) is the pseudo-first-order rate constant while
K2 (g mg
−1 min
−1) is the pseudo-second-order rate constant for the fluoride adsorption process. The
h (mg g
−1 min
−1) in
eqn (9) is the initial adsorption rate of the pseudo-second-order model.
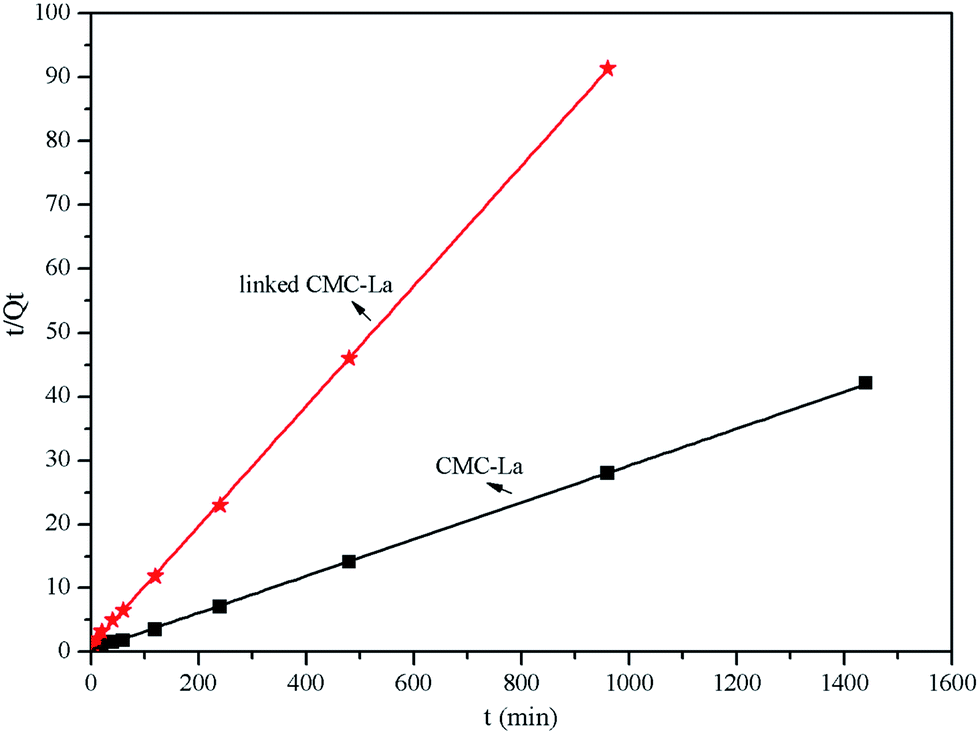
40 Table 3 lists the results of the experimental data of the two models. From
Table 3, we can draw the conclusion that the adsorption process of fluoride onto both CMC–La and linked-CMC–La fitted the pseudo-second-order model (
Fig. 11) better than the pseudo-first-order and Elovich models (figure not shown here), because the calculated equilibrium adsorption amount in the pseudo-second-order model was almost the same as the experimental data and the
R2 values were 0.999 and 0.999, respectively. The
R2 value was more than those of the other models. The fast adsorption rate and short equilibrium time can also make a contribution to the result. According to the pseudo-second-order model, the rate-limiting step may be chemical sorption involving valency forces through sharing or exchange of electrons between the sorbent and sorbate.
37 According to this, the crosslinking of the adsorbent did not change the adsorption process and the kinetic model attributed to the pseudo-second-order model. It can also be conjectured that the sites linked by glutaraldehyde were different from the adsorption sites for fluorine, because cross-linking occurred between the natural polymer and glutaraldehyde by linking at the amine or the hydroxyl sites
41 while ion-dipole and H-bonding were considered the primary noncovalent interactions for the adsorption.
42 Analysis of the mechanism of glutaraldehyde crosslinking of CMC–La is shown in
Scheme 1B.
 |
| | Fig. 11 Pseudo-second-order kinetic model for the adsorption of fluoride on CMC–La and linked-CMC–La. | |
3.10. Effect of initial concentration and isotherm models
The effects of initial concentration of fluoride on the removal efficiency of the adsorbents are shown in Fig. 12. The fluoride concentration ranged from 10 to 130 mg L−1. The removal efficiency of fluorine by CMC–La increased with the increase in concentration from 10 to 40 mg L−1, while the removal efficiency decreased in steps from 40 to 120 mg L−1 and the maximum removal efficiency was about 98.85% at 40 mg L−1. The removal efficiency of fluoride by linked-CMC–La increased with the increase in concentration from 10 to 40 mg L−1, and stayed stable when the concentration was beyond 40 mg L−1, while the maximum removal efficiency was 99.31% at 40 mg L−1.
 |
| | Fig. 12 Effect of initial concentration on adsorption amount and removal efficiency of fluoride by CMC–La and linked-CMC–La. | |
The analysis of isotherm data is important for predicting the adsorption parameters. Langmuir, Freundlich, Temkin and Dubinin isotherm equations were used to identify the adsorption efficiency and the mechanism of the adsorption process. The Langmuir model can be expressed in a linear form by eqn (10).43
The essential feature of the Langmuir isotherm can be described by a separation factor RL. When RL values are between 0 and 1, the adsorption is favorable. RL was calculated using eqn (11).44
| | |
Ce/Qe = 1/(KLQmax) + Ce/Qmax
| (10) |
The Freundlich model is displayed in eqn (12)45 and assumes non-ideal sorption on heterogeneous surfaces.46
The Temkin model can be expressed in a linear form by eqn (13):
| | |
Qe = RT/bTlnKT + RT/bTlnCe
| (13) |
The Dubinin model can be expressed in a linear form by eqn (14):
| | |
lnQe = lnQmax − βε2
| (14) |
β is a constant related to the sorption energy (kJ
2 mol
−1) and
ε is the Polanyi potential which is mathematically represented as
eqn (15):
| | |
ε = RTln(1 + 1/Ce)
| (15) |
Qe (mg g−1) is the amount of adsorbed fluoride per mass unit at equilibrium, Qmax (mg g−1) is the theoretical adsorption capacity, KL (L mg−1) is the binding energy of the adsorption system in the Langmuir model, KF (mg g−1) is the Freundlich constant and n is the adsorption intensity. KT is the Temkin isotherm equilibrium binding energy (L g−1), bT is the Temkin isotherm constant related to the heat of sorption and T is the absolute temperature in Kelvin. C0 (mg L−1) and Ce (mg L−1) are the initial and equilibrium concentration in solution, respectively.
The values of the Langmuir, Freundlich, Temkin and Dubinin isotherm constants were obtained using a linear regression method and the results are shown in Table 4. As depicted, the Langmuir model was better fitted than the other models (based on the higher correlation coefficient, i.e. R2 value and the Qmax). This indicated that the adsorption process was monolayer surface adsorption with a finite number of identical sites. Fig. 13 shows the Langmuir model for the adsorption of fluoride on the two adsorbents. The RL values were between 0 and 1, which indicated that the adsorption of fluoride by CMC–La and linked-CMC–La was favorable.47
Table 4 Characteristic parameters obtained from Langmuir, Freundlich, Temkin and Dubinin equations
| Adsorbent |
Temperature T (K) |
Langmuir constant |
Freundlich constant |
Temkin constant |
Dubinin–Radushkevich |
| KL (L mg−1) |
Qmax (mg g−1) |
R2 |
RL |
n |
KF (mg g−1) |
R2 |
bT (J mol−1) |
KT (L mmol−1) |
R2 |
β (mol2 kJ−2) |
Qmax (mg g−1) |
R2 |
| CMC–La |
298 |
0.79 |
36.440 |
0.999 |
0.013 |
0.45 |
14.73 |
0.954 |
339.17 |
5.047 |
0.262 |
0.116 |
24.60 |
0.647 |
| Linked-CMC–La |
298 |
1.21 |
42.662 |
0.906 |
0.008 |
0.52 |
22.51 |
0.840 |
184.53 |
4.884 |
0.622 |
0.089 |
30.75 |
0.834 |
 |
| | Fig. 13 Langmuir model for the adsorption of fluoride on CMC–La and linked-CMC–La. | |
3.11. Comparison with related adsorbents
The comparison of the adsorption capacity (Qmax) of related adsorbents for fluoride is shown in Table 5. The results showed that linked-CMC–La in this study was superior to related adsorbents in terms of adsorption capacity. The possible reason may be the creases in the surface that added adsorption sites and adsorption capacity.
Table 5 Comparison with related adsorbents
| Adsorbent |
C(F−) (mg L−1) |
pH |
Contact time (h) |
Temperature (°C) |
Qmax (mg g−1) |
Reference |
| La3+-impregnated gelatin |
40 |
5–7 |
0.67 |
25 |
21.28 |
19 |
| La–Al-loaded scoria |
20.82 |
7.2 |
10 |
10 ± 1 |
0.113 |
48 |
| La-modified chitosan |
10 |
6.7 |
24 |
25 |
3.5 |
49 |
| Protonated chitosan beads |
10 |
7 |
0.5 |
30 |
1.66 |
50 |
| Zr-immobilized resin |
80 |
3 |
24 |
30 |
23.18 |
51 |
| Granular ferric hydroxide |
1–100 |
6–7 |
24 |
25 |
7.0 |
52 |
| Linked-CMC–La |
100 |
3 |
24 |
25 |
42.66 |
Present study |
3.12. Regeneration experiment
To keep down the cost of the adsorption process, the regeneration of waste adsorbent for recycling usage is critical in industrial applications. As the adsorption behavior of fluorine onto the adsorbents was much more dependent on the pH value, NaOH solution was chosen as the eluent and the pH of the eluent was based on the resistance of the adsorbents to acid and alkali. The pH of the eluent differed from 9.0 (CMC–La) to 11.0 (linked-CMC–La), and the results are shown in Fig. 14.
 |
| | Fig. 14 Adsorption–desorption cycle of CMC–La and linked-CMC–La. | |
From Fig. 14, the maximum number of recycle times of CMC–La was two and the first removal efficiency was about 92% while the second was reduced to about 43%. As for the linked-CMC–La, it can be regenerated at least 5 times and the removal efficiency was still above 86%. The fluorine removal efficiency decreased by only 8%, demonstrating that the linked-CMC–La in this study can be reused and recycled easily. This is significant for practical applications. From this point of view, we can also come to the conclusion that the linking process improved the hydraulic stability of CMC–La and increased the recycle times of the adsorbent, which resulted in reducing the cost of the use of the adsorbent.
3.13. Mechanism analysis of adsorption of fluoride onto linked-CMC–La and desorption of fluorine with aqueous alkali
For the loading process, La(III) was loaded onto the CMC through ion exchange of the sodium in CMC.53,54 However, the positive charge of the loaded La(III) could not be neutralized by the carboxylic groups and other anionic species like hydroxyl ions existing in the aqueous solution were needed. The mechanism of La(III) loading onto the linked CMC is depicted in Scheme 1A. Glutaraldehyde has been used extensively as a cross-linking agent for natural macromolecular compounds such as proteins and methylcellulose,55 because it can not only react with amino groups, but also with phenolic hydroxyl groups.56 As the linking process occurred between carboxylmethylcellulose, the linking group was the hydroxyl group in CMC, which is shown in Scheme 1B, and a spaced grid structure was formed to improve stability and resistance of the adsorbent.57 The denser structure was also the reason for the improvement of the hydraulic stability and the recyclability of linked-CMC–La compared with CMC–La.
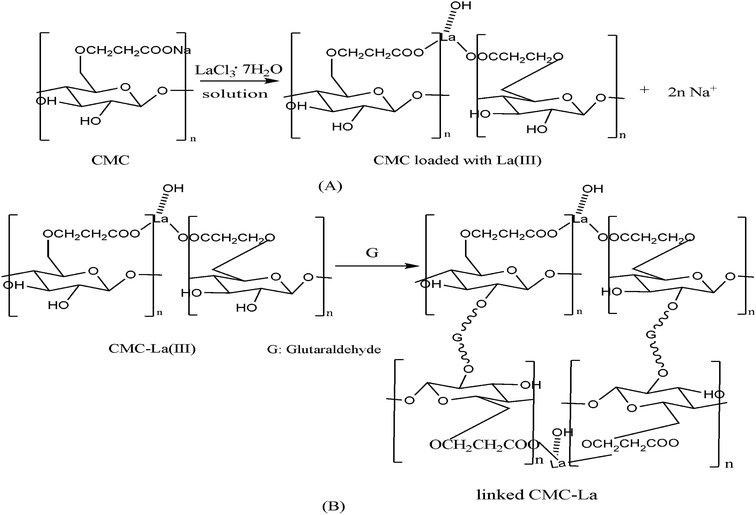 |
| | Scheme 1 Mechanism of preparation of linked-CMC–La ((A) La(III) loading process onto CMC, (B) CMC–La linking process with glutaraldehyde). | |
After adsorption, fluoride reacted with La(III)58 and substituted the hydroxyl in linked-CMC–La through a Lewis acid–base interaction. This also explains the reason why after adsorption the pH changed to about 6.4 when the initial pH was about 4.0. The mechanism of the adsorption process is shown in Scheme 2A. In addition, according to the pHpzc, the electrostatic attraction between the positive adsorbent and fluoride below pH 4.8 is shown in Scheme 2B. Thus, it can be seen that the adsorption sites were different from the linked sites of the adsorbents. This may be the reason why the linking process had no obvious effects on the adsorption of fluoride by CMC–La and linked-CMC–La.
 |
| | Scheme 2 Adsorption mechanism of fluoride onto linked CMC loaded with La(III) ((A) Lewis acid–base interaction in solution, (B) electrostatic attraction in acidic solution). | |
As NaOH was used as the eluent, hydroxyl ions may participate in the desorption process. The desorption mechanism analysis is shown in Scheme 3.
 |
| | Scheme 3 Desorption mechanism of fluoride from linked CMC loaded with La(III). | |
4. Conclusions
In this study, carboxymethyl cellulose microspheres loaded with La(III) and linked carboxymethyl cellulose microspheres loaded with La(III) were fabricated and used to remove fluoride from aqueous solution. The adsorption properties of CMC–La and linked-CMC–La were investigated under batch experiments, and the crosslinking adsorption and desorption mechanisms were analyzed. The conclusions can be summarized as follows:
(a) Compared with CMC–La, linked-CMC–La showed better compressive resistance, acid and alkali resistance and thermostability. The glutaraldehyde linking improved the adsorbance properties.
(b) The maximum removal efficiencies of CMC–La and linked-CMC–La were about 98% and 99%, respectively, and both of them declined with the increase in the pH value. The kinetic model of adsorption was the pseudo-second order kinetic model.
(c) The linking process occurred between the hydroxyl of carboxylmethylcellulose and glutaraldehyde. Carboxyl and La(III) were the functional groups in the adsorption process. La(III) was loaded onto the CMC through ion exchange of sodium. The adsorption of fluoride onto CMC–La was by cooperation of Lewis acid–base interaction and electrostatic attraction when the solution was acidic, and desorption of the adsorbent occurred because the hydroxyl ion substituted fluorine again.
Acknowledgements
This work was financially supported by a special project (13zg610301) and key platform fund of Engineering Research Center of Biomass Materials, Ministry of Education (13zxbk01). Analytical facilities were mainly provided by the Engineering Research Center of Biomass Materials, Ministry of Education.
References
- J. V. Kumar and M. E. Moss, Fluorides in dental public health programs, Dent. Clin. North Am., 2008, 52, 387–401 CrossRef PubMed.
- WHO (World Health Organization), Guidelines for Drinking Water Quality, World Health Organization, Geneva, 2004 Search PubMed.
- M. Islam and R. K. Patel, Thermal activation of basic oxygen furnace slag and evaluation of its fluoride removal efficiency, Chem. Eng. J., 2011, 169, 68–77 CrossRef CAS PubMed.
- P. Sehn, Fluoride removal with extra low energy reverse osmosis membranes: three years of large scale field experience in Finland, Desalination, 2008, 223, 73–84 CrossRef CAS PubMed.
- Z. Qiusheng, L. Xiaoyan, L. Bin and L. Xuegang, Fluoride adsorption from aqueous solution by aluminum alginate particles prepared via electrostatic spinning device, Chem. Eng. J., 2014, 256, 306–315 CrossRef PubMed.
- E. Akbar, S. O. Maurice, O. Aoyi and A. Shigeo, Removal of fluoride ions from aqueous solution at low pH using schwertmannite, J. Hazard. Mater., 2008, 152, 571–579 CrossRef PubMed.
- A. Tor, Removal of fluoride from water using anion-exchange membrane under Donnan dialysis condition, J. Hazard. Mater., 2007, 141, 814–818 CrossRef CAS PubMed.
- L. N. Ho, T. Ishihara, S. Ueshima, H. Nishiguchi and Y. Takita, Removal of fluoride from water through ion exchange by mesoporous Ti oxohydroxide, J. Colloid Interface Sci., 2004, 272, 399–403 CrossRef CAS PubMed.
- S. Chatterjee and S. De, Adsorptive removal of fluoride by activated alumina doped cellulose acetate phthalate (CAP) mixed matrix membrane, Sep. Purif. Technol., 2014, 125, 223–238 CrossRef CAS PubMed.
- N. Kabay, O. Arar, S. Samatya, U. Yuksel and M. Yuksel, Separation of fluoride from aqueous solution by electrodialysis: effect of process parameters and other ionic species, J. Hazard. Mater., 2008, 153, 107–113 CrossRef CAS PubMed.
- A. Bhatnagar, E. Kumar and M. Sillanpää, Fluoride removal from water by adsorption—a review, Chem. Eng. J., 2011, 171, 811–840 CrossRef CAS PubMed.
- M. Mohapatra, K. Rout, P. Singh, S. Anand, S. Layek, H. C. Verma and B. K. Mishra, Fluoride adsorption studies on mixed-phase nano iron oxides prepared by surfactant mediation-precipitation technique, J. Hazard. Mater., 2011, 186, 1751–1757 CrossRef CAS PubMed.
- A. M. Raichur and M. J. Basu, Adsorption of fluoride onto mixed rare earth oxides, Sep. Purif. Technol., 2001, 24, 121–127 CrossRef CAS.
- C. K. Rojas-Mayorga, A. Bonilla-Petriciolet, I. A. Aguayo-Villarreal, V. Hemandez-Montoya, M. R. Moreno-Virgen, R. Tovar-Gómez and M. A. Montes-Morán, Optimization of pyrolysis conditions and adsorption properties of bone char for fluoride removal from water, J. Anal. Appl. Pyrolysis, 2013, 104, 10–18 CrossRef CAS PubMed.
- R. Tovar-Gómez, M. R. Moreno-Virgen, J. A. Dena-Aguilar, V. Hernández-Montoya, A. Bonilla-Petriciolet and M. A. Montes-Morán, Modeling of fixed-bed adsorption of fluoride on bone char using a hybrid neural network approach, Chem. Eng. J., 2013, 228, 1098–1109 CrossRef PubMed.
- C. L. Yang and R. Dluhy, Electrochemical generation of aluminum sorbent for fluoride adsorption, J. Hazard. Mater., 2002, 94, 239–252 CrossRef CAS.
- H. Deng and X. Yu, Adsorption of fluoride, arsenate and phosphate in aqueous solution by cerium impregnated fibrous protein, Chem. Eng. J., 2012, 184, 205–212 CrossRef CAS PubMed.
- A. Teutli-Sequeira, V. Martínez-Miranda, M. Solache-Ríos and I. Linares-Hernández, Aluminum and lanthanum effects in natural materials on the adsorption of fluoride ions, J. Fluorine Chem., 2013, 148, 6–13 CrossRef CAS PubMed.
- Y. Zhou, C. Yu and Y. Shan, Adsorption of fluoride from aqueous solution on La3+-impregnated cross-linked gelatin, Sep. Purif. Technol., 2004, 36, 89–94 CrossRef CAS.
- A. Bansiwal, D. Thakre, N. Labhshetwar, S. Meshram and S. Rayalu, Fluoride removal using lanthanum incorporated chitosan beads, Colloids Surf., B, 2009, 74, 216–224 CrossRef CAS PubMed.
- R. C. Oliveira, P. Hammer, E. Guibal, J. Taulemesse and O. Garcia Jr, Characterization of metal-biomass interactions in the lanthanum (III) biosorption on Sargassum sp. using SEM/EDX, FTIR, and XPS: preliminary studies, Chem. Eng. J., 2014, 239, 381–391 CrossRef CAS PubMed.
- F. Luo and K. Inoue, The removal of fluoride ion by using metal (III)-loaded amberlite resins, Solvent Extr. Ion Exch., 2004, 22, 305–322 CrossRef CAS.
- J. Chen, J. Wang, X. Zhang and Y. Jin, Microwave-assisted green synthesis of silver nanoparticles by carboxymethyl cellulose sodium and silver nitrate, Mater. Chem. Phys., 2008, 108, 421–424 CrossRef CAS PubMed.
- N. Viswanathan and S. Meenakshi, Role of metal ion incorporation in ion exchange resin on the selectivity of fluoride, J. Hazard. Mater., 2009, 162, 920–930 CrossRef CAS PubMed.
- J. Wang, X. Y. Lin, X. G. Luo and Y. F. Long, A sorbent of carboxymethyl cellulose loaded with zirconium for the removal of fluoride from aqueous solution, Chem. Eng. J., 2014, 252, 415–422 CrossRef CAS PubMed.
- M. Taniwaki and K. Kohyama, Mechanical and acoustic evaluation of potato chip crispness using a versatile texture analyzer, J. Food Eng., 2012, 112, 268–273 CrossRef PubMed.
- X. Lin, J. Zhang, X. Luo, C. Zhang and Y. Zhou, Removal of aniline using lignin grafted acrylic acid from aqueous solution, Chem. Eng. J., 2011, 172, 856–863 CrossRef CAS PubMed.
- Q. Wu, J. Chen, M. Clark and Y. Yu, Adsorption of copper to different biogenic oyster shell structures, Appl. Surf. Sci., 2014, 311, 264–272 CrossRef CAS PubMed.
- I. Genta, M. Costantini, A. Asti, B. Conti and L. Montanari, Influence of glutaraldehyde on drug release and mucoadhesive properties of chitosan microspheres, Carbohydr. Polym., 1998, 36, 81–88 CrossRef CAS.
- S. Wu, D. Shen, J. Hu, R. Xiao and H. Zhang, TG-FTIR and Py-GC–MS analysis of a model compound of cellulose-glyceraldehydes, J. Anal. Appl. Pyrolysis, 2013, 101, 79–85 CrossRef CAS PubMed.
- H. N. Umh and Y. Kim, Sensitivity of nanoparticles’ stability at the point of zero charge (PZC), J. Ind. Eng. Chem., 2014, 20, 3175–3178 CrossRef CAS PubMed.
- J. A. Arcibar-Orozco, D. Josue, J. C. Rios-Hurtado and J. R. Rangel-Mendez, Influence of iron content, surface area and charge distribution in the arsenic removal by activated carbons, Chem. Eng. J., 2014, 249, 201–209 CrossRef CAS PubMed.
- A. J. Varma, S. V. Deshpande and J. F. Kennedy, Metal complexation by chitosan and its derivatives: a review, Carbohydr. Polym., 2004, 55, 77–93 CrossRef CAS PubMed.
- M. Figueiredo, A. Fernando, G. Martins, J. Freitas, F. Judas and H. Figueiredo, Effect of the calcination temperature on the composition and microstructure of hydroxyapatite derived from human and animal bone, Ceram. Int., 2010, 36, 2383–2393 CrossRef CAS PubMed.
- H. Liu, F. Yang, Y. Zheng, J. Kang, J. Qu and J. P. Chen, Improvement of metal adsorption onto chitosan/Sargassum sp. composite sorbent by an innovative ion-imprint technology, Water Res., 2011, 45, 145–154 CrossRef CAS PubMed.
- A. Masek, E. Chrzescijanska, A. Kosmalska and M. Zaborski, Characteristics of compounds in hops using cyclic voltammetry, UV-VIS, FTIR and GC-MS analysis, Food Chem., 2014, 156, 353–361 CrossRef CAS PubMed.
- B. Grabowska, M. Sitarz, E. Olejnik and K. Kaczmarska, FT-IR and FT-Raman studies of cross-linking processes with Ca2+ ions, glutaraldehyde and microwave radiation for polymer composition of poly(acrylic acid)/sodium salt of carboxymethyl starch-Part I, Spectrochim. Acta, Part A, 2015, 135, 529–535 CrossRef CAS PubMed.
- Y. S. Ho, Removal of copper ions from aqueous solution by tree fern, Water Res., 2003, 37(10), 2323–2330 CrossRef CAS.
- K. G. Bhattacharyya and A. Sharma, Kinetics and thermodynamics of Methylene Blue adsorption on Neem (Azadirachta indica)
leaf powder, Dyes Pigm., 2005, 65, 51–59 CrossRef CAS PubMed.
- O. Aksakal and H. Ucun, Equilibrium, kinetic and thermodynamic studies of the biosorption of textile dye onto Pinus sylvestris L., J. Hazard. Mater., 2010, 181, 666–672 CrossRef CAS PubMed.
- L. Poon, L. D. Wilson and J. Headley, Chitosan-glutaraldehyde copolymers and their sorption properties, Carbohydr. Polym., 2014, 109, 92–101 CrossRef CAS PubMed.
- D. Pratt, L. D. Wilson and J. A. Kozinski, Preparation and sorption studies of glutaraldehyde cross-linked chitosan copolymers, J. Colloid Interface Sci., 2013, 395, 205–211 CrossRef CAS PubMed.
- A. Heidari, H. Younesi, A. Rashidi and A. A. Ghoreyshi, Evaluation of CO2 adsorption with eucalyptus wood based activated carbon modified by ammonia solution through heat treatment, Chem. Eng. J., 2014, 254, 503–513 CrossRef CAS PubMed.
- J. Feng, Z. Yang, G. Zeng, J. Huang, H. Xu, Y. Zhang, S. Wei and L. Wang, The adsorption behavior and mechanism investigation of Pb(II) removal by flocculation using microbial flocculant GA1, Bioresour. Technol., 2013, 148, 414–421 CrossRef CAS PubMed.
- B. Liu, D. Wang, G. Yu and X. Meng, Removal of F- from aqueous solution using Zr (IV) impregnated dithiocarbamate modified chitosan beads, Chem. Eng. J., 2013, 228, 224–231 CrossRef CAS PubMed.
- I. P. Gustafsson, M. Akram and C. Tiberg, Predicting sulphate adsorption/desorption in forest soils: evaluation of an extended Freundlich equation, Chemosphere, 2015, 119, 83–89 CrossRef PubMed.
- S. Liu, Y. Ding, P. Li, K. Diao, X. Tan, F. Lei, Y. Zhan, Q. Li, B. Huang and Z. Huang, Adsorption of the anionic dye Congo red from aqueous solution onto natural zeolites modified with N,N-dimethyl dehydroabietylamine oxide, Chem. Eng. J., 2014, 248, 135–144 CrossRef CAS PubMed.
- S. Zhang, Y. Lu, X. Lin, X. Su and Y. Zhang, Removal of fluoride from groundwater onto La-Al loaded scoria adsorbent, Appl. Surf. Sci., 2014, 303, 1–5 CrossRef CAS PubMed.
- S. Kamble, S. Jagtap, N. Labhsetwar, D. Thakare, S. Godfrey, S. Devotta and S. Rayalu, Defluoridation of drinking water using chitin, chitosan and lanthanum-modifled chitosan, Chem. Eng. J., 2007, 129, 173–180 CrossRef CAS PubMed.
- N. Viswanathan, C. S. Sundaram and S. Meenakshi, Removal of fuoride from aqueous solution using protonated chitosan beads, J. Hazard. Mater., 2009, 161, 423–430 CrossRef CAS PubMed.
- H. Paudyal, B. Pangeni and K. Ghimire, Adsorption behavior of orange waste gel for some rare earth ions and its application to the removal of fluoride from water, Chem. Eng. J., 2012, 195, 289–296 CrossRef PubMed.
- E. Kumar, A. Bhatnagar, M. Ji, W. Jung, S.-H. Lee, S. Kim, G. Lee, H. Song, J. Choi, J. Yang and B. Jeon, Defluoridation from aqueous solutions by granular ferric hydroxide (GFH), Water Res., 2009, 43, 490–498 CrossRef CAS PubMed.
- H. Cai, G. Chen, C. Peng, Z. Zhang, Y. Dong, G. Shang, X. Zhu, H. Gao and X. Wan, Removal of fluoride from drinking water using tea waste loaded with Al/Fe oxides: a novel, safe and efficient biosorbent, Appl. Surf. Sci., 2015, 328, 34–44 CrossRef CAS PubMed.
- J. Wang, D. Kang, X. Yu, M. Ge and Y. Chen, Synthesis and characterization of Mg-Fe-Al trimetal composite as an adsorbent for fluoride removal, Chem. Eng. J., 2015, 264, 506–513 CrossRef CAS PubMed.
- J. Han, S. Bourgeois and M. Lacroix, Protein-based coatings on peanut to minimize oil migration, Food Chem., 2009, 115, 462–468 CrossRef CAS PubMed.
- J. Shang, Z. Shao and X. Chen, Chitosan-based electroactive hydrogel, Polymer, 2008, 49, 5520–5525 CrossRef CAS PubMed.
- E. Emregul, O. Kocabay, B. Derkus, T. Yumak, K. Emregul, A. Sinag and K. Polat, A novel carboxymethylcellulose-gelatin-titaniumdioxide-superoxide dismutase biosensor; electrochemical properties of carboxymethylcellulose-gelatin-titanium dioxide-superoxide dismutase, Bioelectrochemistry, 2013, 90, 8–17 CrossRef CAS PubMed.
- D. Thakre, S. Jagtap, A. Bansiwal, N. Labhsetwar and S. Rayalu, Synthesis of La-incorporated chitosan beads for fluoride removal from water, J. Fluorine Chem., 2010, 131, 373–377 CrossRef CAS PubMed.
|
| This journal is © The Royal Society of Chemistry 2015 |
Click here to see how this site uses Cookies. View our privacy policy here.