
Identification and characterization of the Indian Yellow dyestuff and its degradation products in historical oil paint tube by liquid chromatography mass spectrometry†
Olga Otłowskaa,
Marek Ślebiodab,
Mirosław Wachowiakc and
Magdalena Śliwka-Kaszyńska*a
aDepartment of Organic Chemistry, Gdansk University of Technology, Narutowicza 11/12, 80-233 Gdansk, Poland. E-mail: magkaszy@pg.gda.pl
bPerlan Technologies, Sp. z.o.o., Pulawska 303, 02-785 Warszawa, Poland
cDepartment of Conservation and Restoration of Modern Art, Nicolas Copernicus University, Sienkiewicza 30/32, 87-100 Torun, Poland
First published on 27th May 2015
Abstract
An analytical protocol for identification of dyes using reversed phase liquid chromatography-mass spectrometry with atmospheric pressure electrospray ionization (LC-ESI/MS) is presented. The developed method has been successfully applied in identification of euxanthic acid and euxanthone, the main components of the Indian Yellow dye in a historical oil paint tube produced by Richard Ainès, a recognizable French company supplying art materials. The paint tube from which the sample has been taken belonged to a famous Polish painter from the 19th century – Jan Matejko. Various methods of extraction of the Indian Yellow dyestuff from the oil paint were systematically investigated. Efficiencies of the nine extraction procedures (based respectively on use of: HCl, HF, acetylacetone, and formic, tartaric, oxalic, trifluoroacetic and citric acids) were compared on the basis of euxanthic acid to euxanthone chromatographic peak areas ratio. It was found that use of HF, acetylacetone and the organic acids ensures a non-destructive recovery of intact acid-labile components, while the strong HCl mineral acid not only allowed extraction of the colorant from the binding medium, but also decomposes the glycosidic dye into the parent aglycon and causes a formation of methyl euxanthonate and numerous products which may hinder the proper identification of the dye. The Indian Yellow was fully characterized with the use of spectrochromatographic techniques for the first time. The fragmentation pathways of the identified colorant ions and their degradation products were proposed.
Introduction
Analysis of natural dyes in historical objects is fundamental for the development of effective and appropriate conservation strategies; to determine origin of an artifact; as well as to obtain historical information necessary for the purposes of documenting an artwork and a work's authenticity. Identification of a particular dyestuff is usually based on the presence of its main components, while minor components are important for differentiating between dyes originating from closely related sources.1 Numerous analytical techniques have been utilized to characterize dye based pigments, including vibrational spectroscopic techniques (IR and FTIR), X-ray fluorescence (XRF) or Raman and UV spectroscopy. For many years, examination of dyestuff components has been generally unfeasible due to the unacceptably large size of sample necessary to solubilize the contained dyestuffs prior to spectroscopic or chromatographic analysis. Determination of dyes extracted from paint samples became possible when the analytical methods became more sophisticated, and the sample size might possibly be reduced, although the sample preparation procedure can still have crucial effects on the analytical results. Natural organic dyes in objects of the cultural heritage are commonly identified by means of the high performance liquid chromatography (HPLC) as it was reviewed in detail by Rosenberg2 and recently by Pauk et al.3 Nowadays, HPLC with mass spectrometric detection offers solution to difficult problems encountered in the analysis of real samples of unknown composition, especially ones connected with the lack of proper analytical standards. While HPLC-MS has been used for the identification of natural organic dyes in the historical textile samples, this method has not been widely employed in case of samples extracted from oil paints.Our study is aimed at identification of organic dyes in the yellow oil paint used by Jan Matejko (1838–1893), and extends the LC-MS analytical technique for identification of the coloring matters present in the art paint tube with partially preserved paper label with the name Jaune de Indien. Calcium and magnesium salts of euxanthic acid have been known for a long period of time as a kind of “mysterious” colorant named the Indian Yellow, which came probably from Persia to India around the 15th century, and reached Europe through the Dutch trade in East Indies not later than in the 17th century. The Indian Yellow, being quite transparent, was said to be most suitable for the watercolor and tinted drawings, yet it was also used in the oil technique. In the late 19th century it was believed that the colorant was made from the urine of cows fed with mango leaves and its use was prohibited for humanitarian reasons in 1908.
Most of the natural dyestuffs are bound to a mordant thus forming a dye lake through co-precipitation with an inorganic substrate by strong chelate bonds. The process of dyes extraction is yet more complicated by presence of aged binding media, varnishes, and other constituents of the samples. The conventional methods of extracting dyes from lake paints are based on utilization of strong inorganic acids such as H2SO4 and HCl at elevated temperatures in order to facilitate hydrolysis of metal–dye complexes, which are very stable and difficult to decompose. Unfortunately, the strong mineral acids not only hydrolyze the metal–dye complex, which is a desirable reaction, but also decompose glycosidic dye components into their parent aglycons.4,5 Another negative effect of the use of the strong acids for isolation of a dye from the lake matrix are its decarboxylation (e.g. pseudopurpurin to purpurin)6 and dehydration.7 Although this procedure can at times be actually quite useful for identification of the aglycone part of the molecule, the inadvisable reactions accompanying the extraction alter the original composition of coloring substances making the identification of the dye problematic. Alternative method of disrupting the paint medium and solubilizing the dyestuffs based on methylation of carboxyl moieties in the dyes with a BF3/MeOH mixture was also used.8 Mild extraction procedures with use of chelating agents such as oxalic or ethylenediaminetetraacetic acid (EDTA) and of moderate strength acids have been tried on textiles dyed by various authors but have generally been found less efficient than the reference HCl method.9–11 Lastly, J. Sanyova et al. used hydrofluoric acid for extraction of mordant-type dyestuffs.12,13 HF is both a weak acid and a strong aluminium-complexing agent, and it preserves glycoside bonds. Very limited systematic studies on dyes extraction methods, mainly from textile fibers, have been reported in the literature.14–16 To the best of our knowledge, no systematic study has been performed to compare the efficiencies of different protocols on the Indian Yellow dyestuff's extraction from the paint binder. For this reason, nine different extraction methods were systematically examined and compared.
Experimental
Chemicals and standards
Acetonitrile and methanol used as mobile phase components were of HPLC grade and were purchased from Merck (Darmstadt, Germany). Formic acid, trifluoroacetic acid and hydrofluoric acid (48% in water) were purchased from Sigma-Aldrich (Steinheim, Germany). Dimethyl sulfoxide (DMSO) (reagent ACS) and n-hexane (anhydrous, 95%) were obtained from Merck KGaA (Darmstadt, Germany). Ethyl acetate, dichloromethane, hydrochloric acid, tartaric acid, oxalic acid, citric acid, acetylacetone and thionyl chloride (analytical grade) were purchased from POCh (Gliwice, Poland). Hydroquinone, 2,6-dihydroxybenzoic acid and diphenyl ether were obtained from Lancaster (Eastgate, England). All aqueous solutions were prepared using deionized Milli Q water.Synthesis of 1,7-dihydroxyxanthone (euxanthone)
Methyl 2,6-dihydroxybenzoate has been prepared according to the reported procedure.17 Yield 55%, mp 57–60 °C; 1H NMR δH (200 MHz, MeOD-d4) 4.05 (3H, s, Me), 6.45 (2H, dd, J 9.2; 1.6, Ar-H), 7.30 (1H, m, Ar-H).Euxanthone has been synthesized in accordance with the modified procedure reported by Trivedi et al.18 A mixture of hydroquinone (1.62 g, 0.015 mol), methyl 2,6-dihydroxybenzoate (2.5 g, 0.15 mol) and diphenyl ether (7.5 mL, 0.05 mol) was refluxed under an atmosphere of nitrogen for 48 hours. The removal of solvent by distillation under reduced pressure gave brown solid which was purified by flash chromatography (SiO2, n-hexane/AcOEt (85![[thin space (1/6-em)]](https://www.rsc.org/images/entities/char_2009.gif) :15, v/v)). Further recrystallization from methanol gave a yellow crystals (yield 5.1%, mp 236–239 °C; 1H NMR δH (200 MHz, acetone-d6) 6.85 (1H, dd, J 8.1; 2.2, Ar-H), 6.92 (1H, dd, J 8.3; 2.2, Ar-H), 7.01–7.03 (2H, m, Ar-H), 7.38 (1H, t, J 8.18, Ar-H), 7.55 (1H, d, J 1.9, Ar-H), 12.7 (2H, br, OH)).
:15, v/v)). Further recrystallization from methanol gave a yellow crystals (yield 5.1%, mp 236–239 °C; 1H NMR δH (200 MHz, acetone-d6) 6.85 (1H, dd, J 8.1; 2.2, Ar-H), 6.92 (1H, dd, J 8.3; 2.2, Ar-H), 7.01–7.03 (2H, m, Ar-H), 7.38 (1H, t, J 8.18, Ar-H), 7.55 (1H, d, J 1.9, Ar-H), 12.7 (2H, br, OH)).
Equipment
The analysis were performed using Agilent LC-MS/MS liquid chromatograph series 1290 (Agilent Technology, Waldbronn, Germany) consisting of binary pump G4220A, autosampler G4226A, thermostated column compartment G1316C, diode-array detector G1315C, and triple quadrupole mass spectrometer G6460 with AJS electrospray ionization source. The chromatographic system was controlled with Agilent MassHunter software version B 06.01. For confirmation of identified dyestuffs structures HPLC-QTOF-MS analysis were carried out using an Agilent 1290 HPLC system coupled to a hybrid quadrupole time-of-flight (QTOF) mass spectrometer G6540 with Dual ESI interface operated in scan mode in the same chromatographic conditions.Microscopic photographs were performed using the Optical microscope Nikon, Optiphot-2. The SEM images were carried out using the scanning electron microscope, type 1430 VP (LEO Electron Microscopy Ltd., England), equipped with detectors of secondary electrons (SE), backscattered electrons (BSE) and an energy dispersive X-ray spectrometer (EDX) Quantax 200 with a detector XFlash 4010 (Bruker AXS Microanalysis GmbH, Germany).
Sample
The historical sample of a naturally aged paint dating back to the 19th century has been kindly offered by the National Museum in Krakow, Poland. The oil paint tube had formerly belonged to a famous Polish painter, Jan Matejko, and was being used approximately between 1875 and 1890. The oil paint had been manufactured by a French art materials supplier, Richard Ainès. The paint was purchased by Matejko in the last decade of his life, probably in Mr Biasion's Optician Shop situated at the Old Market Square in Krakow.The oil paint sample was analyzed by means of XRF and SEM-EDX. As a result, magnesium and calcium were identified, thus confirming presence of these salts in the dyestuff. Furthermore, presence of aluminum, silicon, iron, arsenic, and tin was indicated in minute amounts, in all likelihood resulting presumably from natural impurities. Basing upon the conducted research, there is no possibility to recognize the possible participation of aluminum or other compounds like chalk, yet such an opportunity cannot be excluded. The presence of additional components is most probably due to the natural impurities in the sample, which may be observed on the microscopic photographs where fibrous structures of possibly plant origin are visible (Fig. 1).
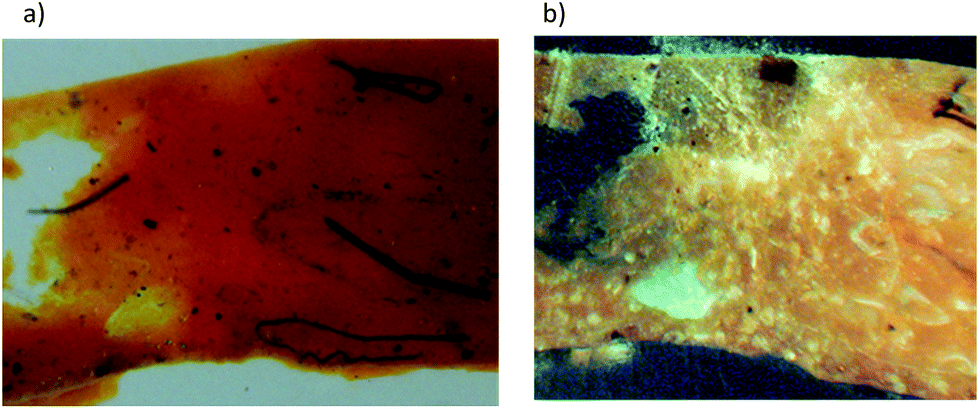 | ||
| Fig. 1 Microscopic photographs of the Indian Yellow paint sample in: (a) vis light (b) UV light (magnitude 200×), photography by T. Kozielec. | ||
Extraction methods
The first step of all the nine extraction procedures was always identical. In each case the microsample (∼0.2 mg) placed in a 3 mL conical polypropylene vial was suspended in 300 μL of methylene chloride and kept in an ultrasonic bath for 15 min in order to swell the organic binding media. After evaporation of the solvent under the stream of nitrogen, the sample was re-suspended in 500 μL of a ACN/MeOH/DMSO (1:1:1 v/v) mixture. Next steps were specific to the applied extraction procedures.
:1:1, v/v) and subjected to an HPLC analysis.:1:1, v/v), out of which 2 μL were injected into the HPLC system.:1 v/v) followed by 5 mL water. The HF extract was loaded onto the cartridge and the fluorides and other polar substances were washed from the cartridge with 4 mL of 0.01% TFA in water. The dyestuff was eluted using 1 mL of ACN/MeOH (1:1, v/v) acidified with 0.01% TFA. The eluate was evaporated under a stream of nitrogen to dryness, taken up in 200 μL ACN/MeOH/DMSO (1:1:1, v/v) and subjected to an HPLC analysis.:1:1, v/v) and subjected to an HPLC analysis.Chromatographic analysis
The components of the extracts were separated by means of HPLC using C-18 reversed-phase column. The column effluent was monitored with diode array detector and mass spectrometer connected in-line to characterize the compounds with their retention times, UV-vis and mass spectra. To ensure universal elution conditions for chemically different compounds there were used a wide gradient of methanol/acetonitrile (1:1, v/v) and water, each containing 0.1% of formic acid. The details of the optimized spectrochromatographic analysis' parameters are presented in Table 1.
| HPLC separation | |||
| Column | Poroshell EC-C18 (3.0 × 150 mm), 2.7 μm, Agilent Technologies | ||
| Column temperature | 40 °C | ||
| Injection volume | 2 μL | ||
| Flow rate | 0.4 mL min−1 | ||
| Eluents | (A) 0.1% HCOOH in water, (B) 0.1% HCOOH in ACN/MeOH (1:1; v/v) |
||
| Gradient program | Time, min | % A | % B |
| 0 | 90 | 10 | |
| 20 | 0 | 100 | |
| 30 | 0 | 100 | |
| Post time | 10 min | ||
| UV-vis detection | |||
| Wavelengths | UV: 382 nm; vis: 580 nm | ||
| Peak width | >0.1 min (2 s) | ||
| ESI MS detection | |||
| Polarity | Negative | ||
| Mode | Profile 50–1000 m/z | ||
| Peak width | 0.07 min | ||
| Fragmentor voltage | 200 V | ||
| Sheath gas temperature | 250 °C | ||
| Sheath gas flow | 11 L min−1 | ||
| Drying gas flow | 5 L min−1 | ||
| Drying gas temperature | 300 °C | ||
| Nebulizer pressure | 45 psi | ||
| Capillary voltage | 3500 V | ||
| V charging | 500 V | ||
Results and discussion
In the present paper we report nine different extraction methods of dyes from paint matrix in order to check the influence of various types of solvent and acid mixtures on the extraction efficiency and glycosidic linkage decomposition process.The first extraction method was based on applying mild conditions, namely the mixture of organic solvents (ACN/MeOH/DMSO), without adding any acids. The pale yellow extract contained two main components eluting at retention times of 12.9 (the main peak) and 16.5 min (Fig. 2a). Both of them had a comparable light absorption spectra, with absorbance maxima listed in Table 2. In the second extraction procedure, a mixture of the organic solvents and hydrochloric acid was used in order to assist the isolation of the dyes from paint medium.
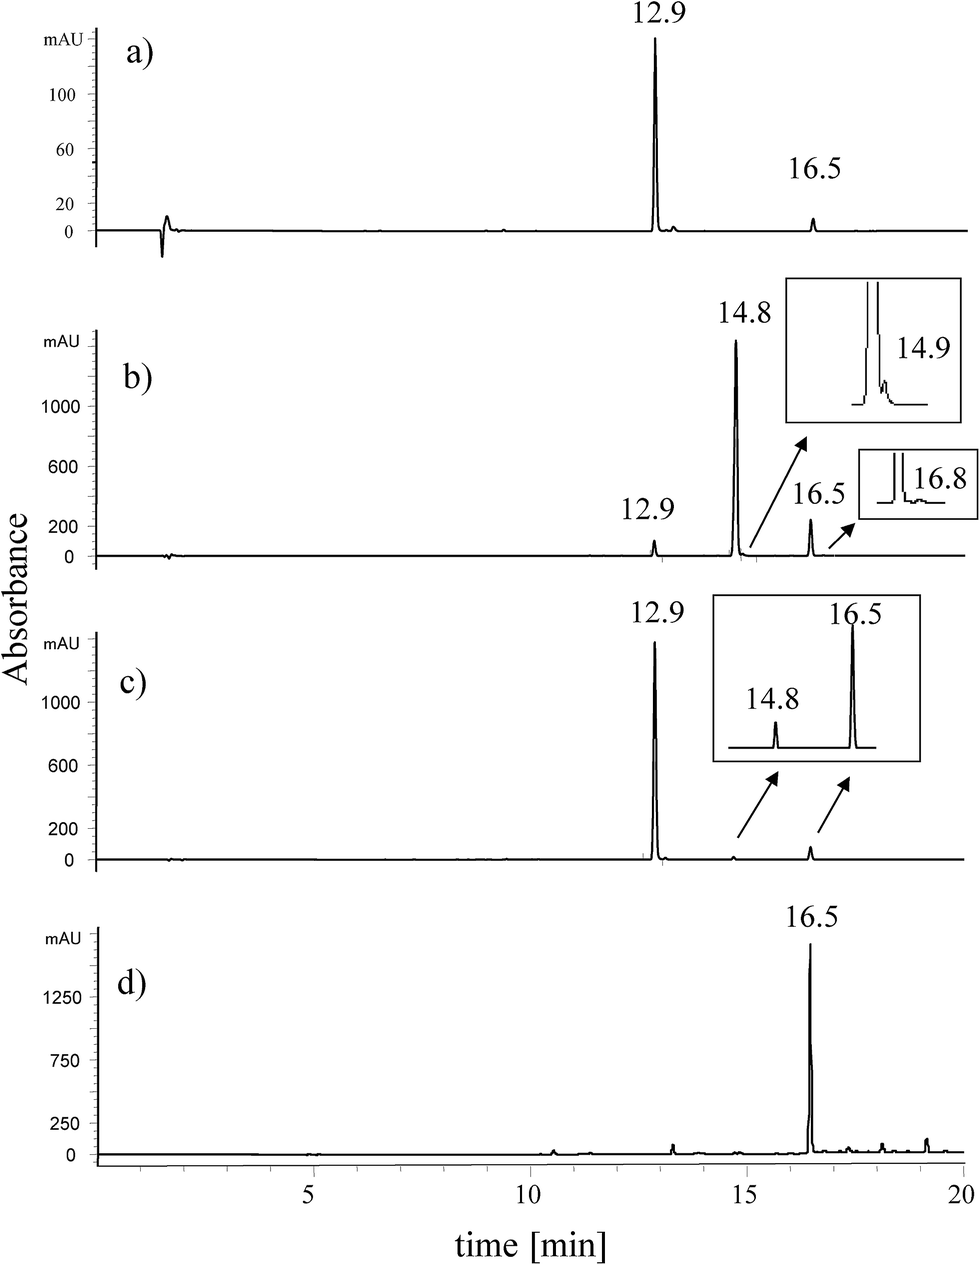 | ||
| Fig. 2 Chromatograms of extracts of yellow dyestuff taken from paint tube of Jan Matejko obtained by: (a) organic solvent method, (b) HCl method, (c) HF method, and (d) synthetic euxanthone. For chromatographic conditions see Table 1. | ||
| Compound | Retention time (min) | Molecular formula | [M − H]− theoret. | [M − H]− experim. | Error (ppm) | Mass spectral peaksa (m/z) | UV spectral maxima (nm) |
|---|---|---|---|---|---|---|---|
| a Mass spectral base peaks are in bold.b Identification tentative. | |||||||
| Euxanthic acid | 12.9 | C19H16O10 | 403.0671 | 403.0682 | −2.8 | 829, 807, 403, 425, 227, 171, 143 | 323, 251, 286, 378 |
| Euxanthone | 16.5 | C13H8O4 | 227.0350 | 227.0354 | −1.8 | 227, 218, 199, 171, 143 | 234, 261, 288, 386 |
| Euxanthic acid methyl ester | 14.8 | C20H18O10 | 417.0827 | 417.0844 | −4.0 | 417, 263, 227 | 241, 264, 286, 376 |
| Monomethylated euxanthic acid | 14.9 | C21H22O10 | 433.1140 | 433.1154 | −3.2 | 433, 243, 227, 171 | 234, 261, 332, 388 |
| Monomethylated euxanthone | 16.8b | C14H11O4 | 243.0663 | 243.0668 | −2.1 | 243, 227, 199, 171, 143 | — |
| Trimethylated euxanthone | 16.8b | C16H15O4 | 271.0976 | 271.0973 | 1.1 | 271, 257, 242, 214 | — |
| Synthetic euxanthone | 16.5 | C13H8O4 | 227.0349 | 227.0351 | −0.9 | 227, 218, 199, 183, 171, 143, 117 | 234, 260, 288, 386 |
The chromatogram of the obtained yellow extract revealed presence of three chromatographic peaks (Fig. 2b). Peaks eluted at the retention times of 12.9 and 16.5 min had been already detected due to the previous extraction procedure, but the use of HCl caused formation of a new peak at the retention time of 14.8 min with intensity predominating the rest of compounds.
In the third extraction procedure, the organic solvents mixture (ACN/MeOH/DMSO) and hydrofluoric acid were used to liberate the dyestuff from the paint matrix. Two main peaks at retention times of 12.9 and 16.5 min were observed (Fig. 2c) with only a small amount of a compound corresponding to the chromatographic peak at retention time 14.8 min, which had been detected in the HCl extract. The next six extraction methods were based on the use of acetylacetone or the organic acids (formic acid, tartaric acid, oxalic acid, citric acid and trifluoroacetic acid) acting as the extracting agents. In all these cases, the two main components were detected at the retention time of 12.9 and at 16.5 min (see ESI†).
The compound appearing in all of the extracts at retention time of 12.9 min had mass base peak at m/z 403 with product ion at m/z 227, which corresponds to euxanthic acid anion yielding euxanthone anion by loss of the glucuronic acid moiety. Identification of the euxanthic acid was supported by liquid chromatography time-of-flight mass spectrometry analysis in MS mode (TOF) with difference of calculated mass of C19H16O10 moiety and the found mass 3.2 ppm (Table 2). The peaks at m/z 807 and 829 visible in the mass spectrum of this compound may be assigned to dimeric ion formed in ion source by the association of [M − H]− with its neutral counterpart M via hydrogen bonding and euxanthic acid dimeric ion [2M − 2H + Na]−.
The less intensive signal at m/z 425 may be assigned to sodium adduct of euxanthic acid [M − 2H + Na]−. Ions at m/z 199, 171 and 143 are formed by the subsequent euxanthone anion's losses of CO moiety (Fig. 3).
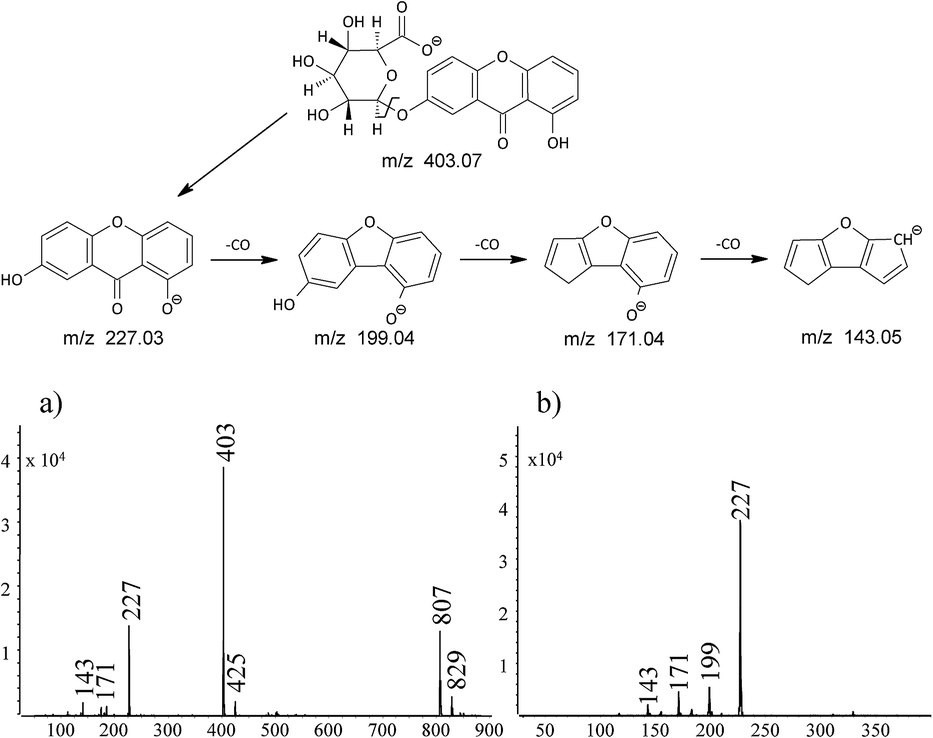 | ||
| Fig. 3 Fragmentation pathway and mass spectra of: (a) euxanthic acid, and (b) euxanthone. | ||
The main chromatographic peak of the HCl extract at 14.8 min had mass base peak at m/z 417 accompanied by product ion at m/z 227. The ion at m/z 227 corresponds to the euxanthone anion, whereas ion at m/z 417 differs by 15 atomic mass units from the euxanthic acid anion, which suggests that during the HCl extraction procedure the carboxylic group present in the glucuronic acid unit undergoes a methylation reaction. The hypothesis is further supported by the lack of the dimeric ions found in the mass spectrum of euxanthic acid. The proposed structure of methyl euxanthonate (Fig. 4) is confirmed by the results of TOF analysis with difference between the calculated and found ion mass of 4 ppm (Table 2).
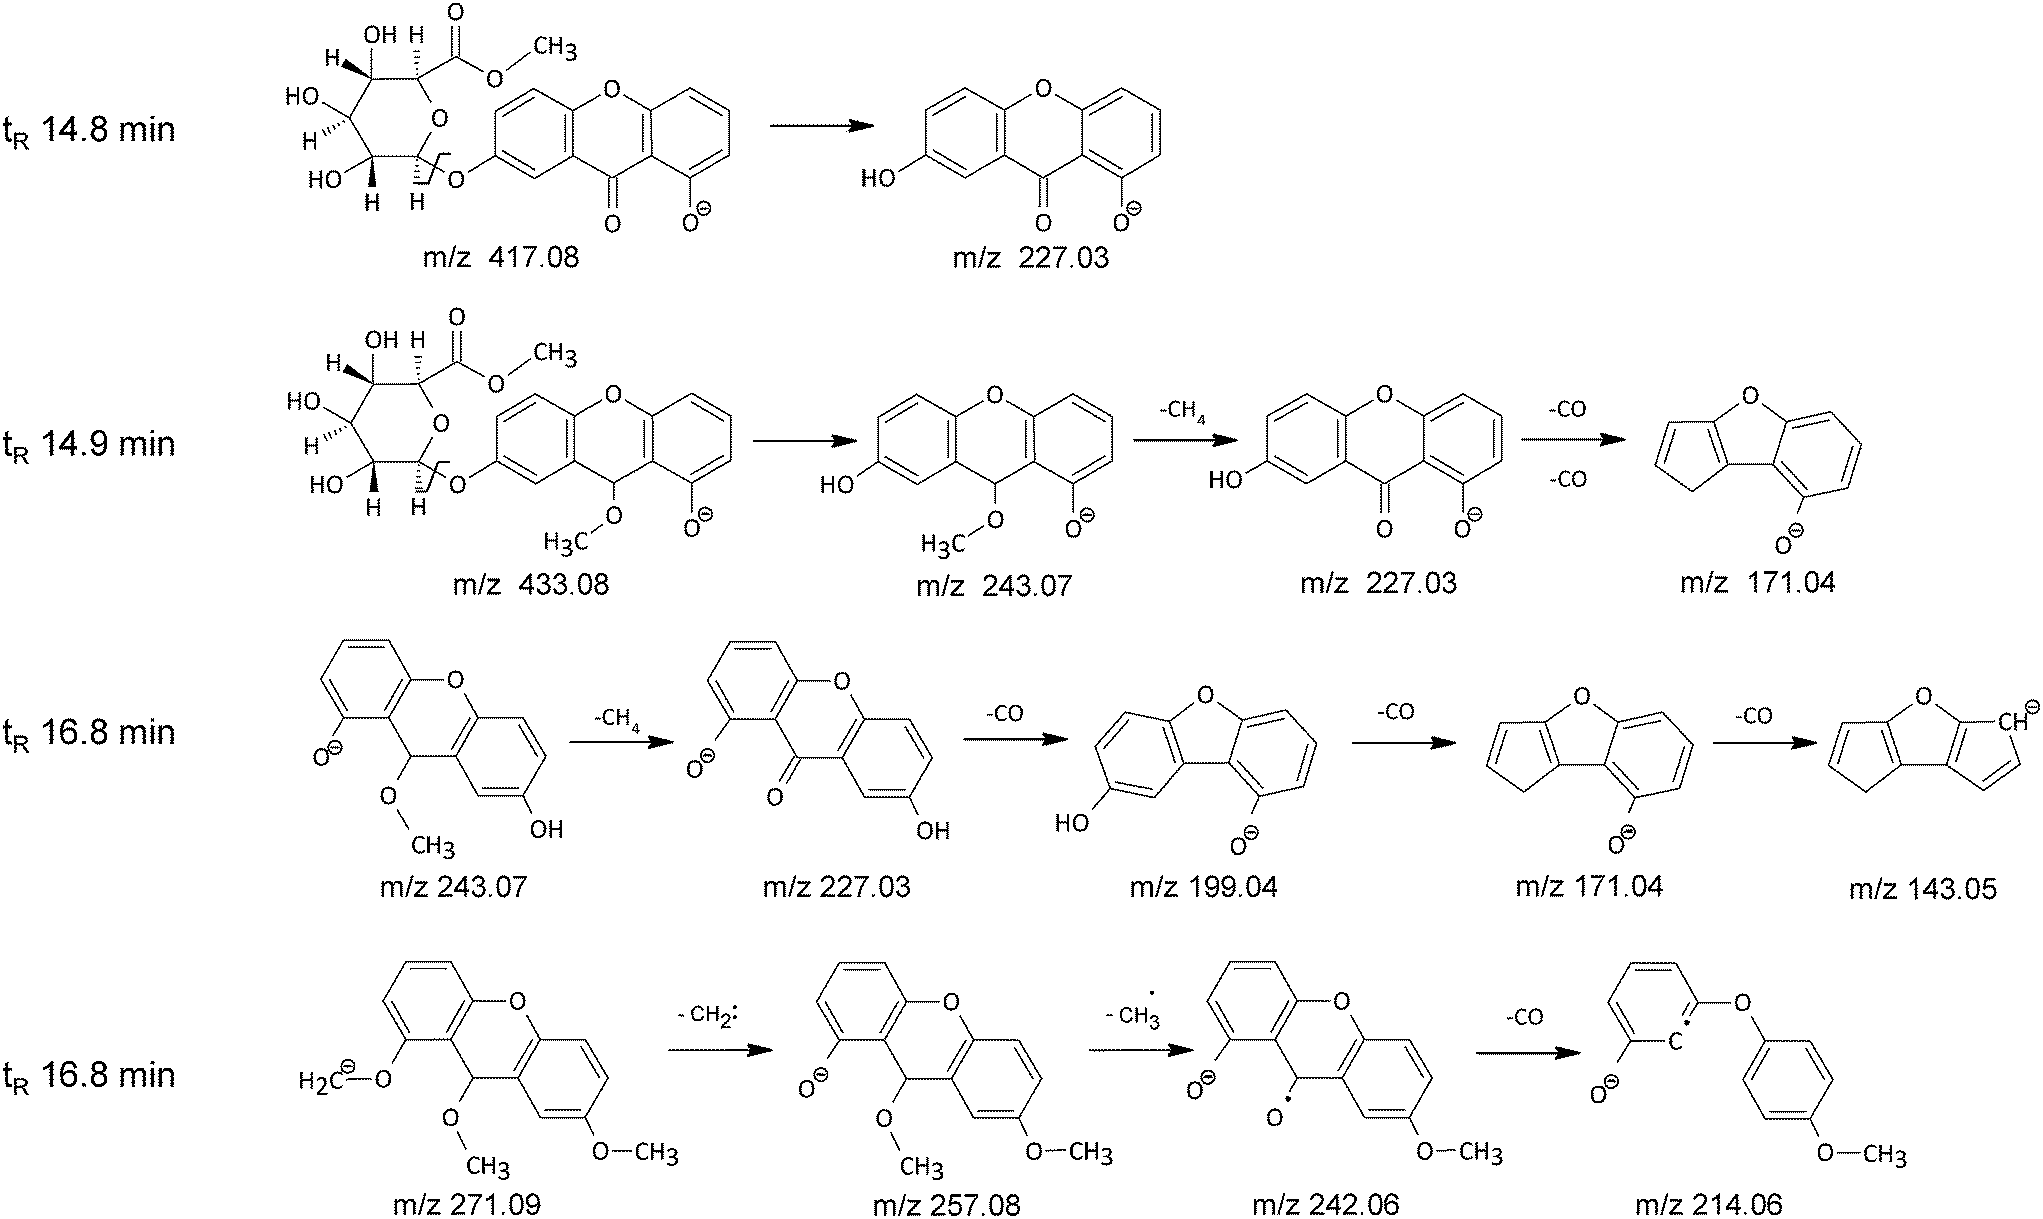 | ||
| Fig. 4 The proposed fragmentation pathways of side products formed during HCl extraction procedure. | ||
Further examination of mass spectrochromatogram of the HCl extract revealed some lesser chromatographic peaks hardly seen in the UV spectrochromatogram (Fig. 2b). The enlargement of the UV chromatographic trace shows small peak just after the peak of methyl euxanthonate at retention time 14.9 min, with mass base peak at m/z 433, and mass peaks at m/z 243, 227, 171 (Table 2). The base peak at m/z 433 corresponds probably to the methyl euxanthonate additionally O-methylated in the aglycone unit. The C21H22O10 molecular formula is in accordance with the TOF mass spectrometry result within 3 ppm. This hypothesis is further supported by appearance of fragment ion at m/z 243 corresponding to the loss of the glucuronic acid methyl ester moiety. The ion at m/z 227 corresponds to the euxanthone after neutral loss of methane with 16 unified atomic mass unit. The product ion at m/z 171 is 56 mass units less than euxanthone ion, which suggests a double elimination of CO moiety (Fig. 4).
The compound appearing in all extracts at 16.5 min had mass base peak at m/z 227 preliminary assigned to [M − H]− ion of euxanthone, and the product ions at m/z 199, 171, and 143 (Fig. 3b). Because analytical standard of euxanthone is not commercially available, the identity of this compound was confirmed by comparison of its retention time, UV spectrum, and mass spectrum with those of a synthetic analogue obtained in our laboratory (Fig. 2d). The proposed structure was further proven on the basis of a TOF analysis with accordance of the euxanthone molecular mass down to a mass error below 1 ppm. We also propose a fragmentation pathway of the ion of m/z 227 explaining formation of the product ions by neutral loss of 28 unified atomic mass unit corresponding to CO moiety (see Fig. 3).
Close inspection of small chromatographic peak seen in UV spectrochromatogram of the HCl extract at 16.8 min (Fig. 2b) revealed a rather complicated mass spectrum. The Find by Chromatogram Deconvolution algorithm of Agilent MassHunter Quantitative software showed two co-eluting components. The reconstructed mass spectrum of the first component exhibited an anionized molecular peak at m/z 243 with main product ions at m/z 227, 199, 171, and 143, while in the reconstructed mass spectrum of the second component an anionized molecular peak at m/z 271 with product ions at m/z 257, 242, 214, and 170 can be seen (Table 2). The structure of the first component may correspond to a mono O-methylated euxanthone molecule with fragmentation ions characteristic for euxanthone (m/z 227) formed by elimination of methane molecule and the product ions (m/z 199, 171 and 143) formed by neutral loss of 28 unified atomic mass unit corresponding to CO moiety (Fig. 4). The second component with pseudo-molecular mass peak at m/z 271 was tentatively assigned to a tri O-methylated derivative of euxanthone. The fragment mass peak at m/z 257 corresponds probably to di-O-methylated euxanthone after elimination of carbene moiety (14 atomic mass units), whereas the mass peaks at m/z 242 and m/z 214 may correspond to mono O-methylated euxanthone anion radical after elimination of methyl radical and subsequent decarbonylation (Fig. 4 and Table 2).
To compare the extraction efficiencies, the recovery rates of the three main compounds (euxanthone, euxanthic acid, and methyl euxanthonate) obtained in the extraction procedures were calculated basing on normalized peak area of euxanthic acid observed during the LC-UV analysis (detection at 382 nm) of the organic solvent extract. Despite the evaluations being semi-quantitative because of the very limited volume of the available sample, some trends are apparent (Fig. 5). The overall extraction efficiency of the dyestuff by means of the HCl procedure was over one order higher than that of the organic solvents extraction, but euxanthic acid was esterificated to a great extent and hydrolyzed to euxanthone. Acetylacetone, hydrofluoric acid, and all the examined organic acids did not hydrolyze the glycosidic bound and preserved the euxanthic acid intact. Furthermore, hydrofluoric, and formic acids provided almost the same recovery rate of the dyestuff as the hydrochloric acid procedure. Although it is difficult to judge whether the small amount of euxanthone was formed due to the extraction procedures, or rather results from the ageing of the paint for over a century, the nearly constant value of the percentage of euxanthic acid found in all extracts, with an exception of the extraction with HCl, allows to form a hypothesis that its original content in the sample equaled about 93.6% (mean value with standard deviation of 0.3%, see line in Fig. 5). The HF, and formic acid procedures gave high recovery rates of the euxanthic acid (about ten times higher than the solvent procedure) without any significant side reactions.
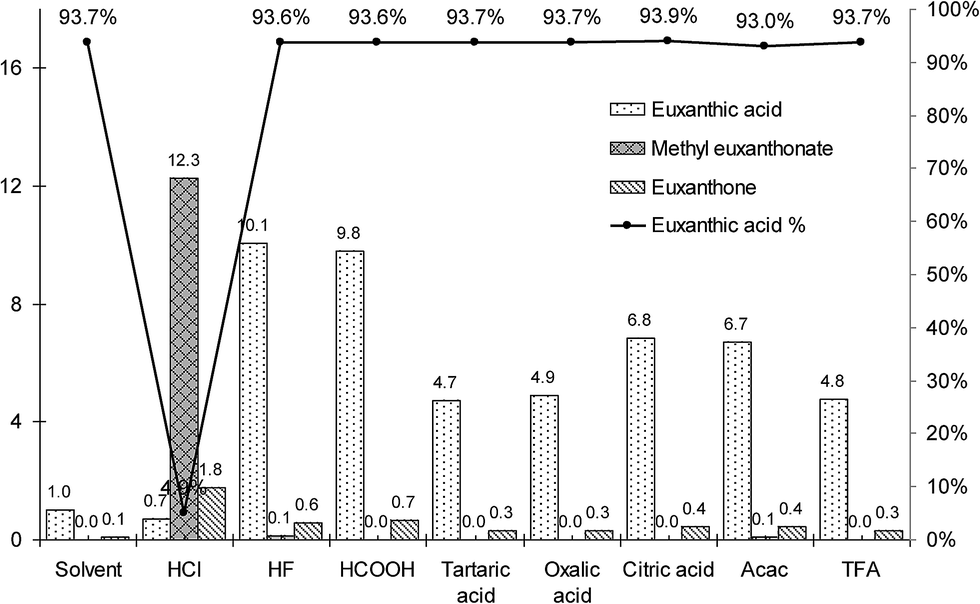 | ||
| Fig. 5 Normalized extraction efficiency of organic solvent method, HCl method, HF method, and formic acid, tartaric acid, oxalic acid, citric acid, acetylacetone, trifluoroacetic acid methods (bars). The solid line represents relative euxanthic acid content computed as ratio of the acid peak area to a sum of euxanthic acid, euxanthone, and methyl euxanthonate peak areas in UV chromatogram of each of the extracts. | ||
Conclusions
Natural organic dyes can be found in many objects of cultural heritage. Identification of the coloring substances present in historical paints provides information relevant to a wide range of specialists involved in the art science. Determination of the paints' composition allows applying appropriate procedures of restoration and conservation of the historic works of art, and enables their renovation in accordance with the ideological and aesthetic decisions of their authors. There are several analytical techniques and methods for extraction and identification of organic dyes, each of which has certain advantages and limitations. For that reason, to develop a universal methodology for the analysis of colorant composition in art paints still remains a challenge for chemists. Herein, the analytical protocol for identification of yellow dyes using reversed phase liquid chromatography-mass spectrometry with atmospheric pressure electrospray ionization (LC-ESI/MS) was presented. Nine extraction methods of this dyestuff from oil paint based respectively on use of HCl, HF, acetylacetone and the organic acids (formic, tartaric, oxalic, trifluoroacetic and citric acids) were systematically investigated and their efficiencies were compared. It was found that the strong mineral acid HCl used for the sample's preparation not only allowed extraction of the colorant from the binding medium, but also decomposed the glycosidic dye into the parent aglycon, and caused formation of methyl euxanthonate and numerous undesirable products. Mild extraction approach based on the use of HF, acetylacetone, and organic acids removed colorants from paint matrix in an intact form, and preserved acid-labile components present in the historical micro-sample. Out of these methods, hydrofluoric and formic acid usage provided recovery efficiency comparable to the classical strong acid method.The developed method was successfully applied in the identification of the main components of Indian Yellow, namely the euxanthic acid and euxanthone, in the sample of painting materials.
The paint sample was additionally analyzed by means of XRF and SEM-EDX. As a result, magnesium and calcium were identified, thus confirming presence of these salts in the dyestuff. Moreover, the SEM image of surface topography with the BSE detector revealed a rich texture of this paint related with natural fibrous structures of plant origin. Our findings firmly confirm the presence of the Indian Yellow in the analyzed sample of painting material once belonging to a 19th century famous Polish academic painter, Jan Matejko, and obtained from the Krakow collection. To our best knowledge, it is the first time that the Indian Yellow is fully characterized by the spectrochromatographic techniques.
References
- I. Surowiec, W. Nowik and T. Moritz, Dyes Pigm., 2012, 94, 363–369 CrossRef CAS PubMed.
- E. Rosenberg, Anal. Bioanal. Chem., 2008, 391, 33–57 CrossRef CAS PubMed.
- V. Pauk, P. Bartak and K. Lemr, J. Sep. Sci., 2014, 37, 3393–3410 CrossRef CAS PubMed.
- J. Wouters, Stud. Conserv., 1985, 30, 119–127 CrossRef CAS PubMed.
- S. Halpine, Stud. Conserv., 1996, 41, 76–94 CrossRef CAS PubMed.
- I. Boldizsar, Z. Szucs, Z. Fuzfai and I. Molnar-Perl, J. Chromatogr. A, 2006, 1133, 259–274 CrossRef CAS PubMed.
- I. Karapanagiotis, E. Minopouloua, L. Valianoua, S. Daniilia and Y. Chryssoulakis, Anal. Chim. Acta, 2009, 647, 231–242 CrossRef CAS PubMed.
- J. Kirby and R. White, Natl. Gallery Tech. Bull., 1996, 17, 56–80 Search PubMed.
- X. Zhang, I. Good and R. Laursen, J. Archaeol. Sci., 2008, 35, 1095–1103 CrossRef PubMed.
- X. Zhang, R. Boytner, J. L. Cabrera and R. Laursen, Anal. Chem., 2007, 79, 1575–1582 CrossRef CAS PubMed.
- R. Marques, M. M. Sousa, M. C. Oliveira and M. J. Melo, J. Chromatogr. A, 2009, 1216, 1395–1402 CrossRef CAS PubMed.
- J. Sanyova and J. Reisse, J. Cult. Herit., 2006, 7, 229–235 CrossRef PubMed.
- J. Sanyova, Microchim. Acta, 2008, 162, 361–370 CrossRef CAS.
- I. Surowiec, A. Quye and M. Trojanowicz, J. Chromatogr. A, 2006, 1112, 209–217 CrossRef CAS PubMed.
- X. Zhang and R. A. Laursen, Anal. Chem., 2005, 77, 2022–2025 CrossRef CAS PubMed.
- L. Valianou, I. Karapanagiotis and Y. Chryssoulakis, Anal. Bioanal. Chem., 2009, 395, 2175–2189 CrossRef CAS PubMed.
- F. Carta, D. Vullo, A. Maresca, A. Scozzafava and C. Supuran, Bioorg. Med. Chem., 2013, 21, 1564–1569 CrossRef CAS PubMed.
- G. N. Patel and K. N. Trivedi, Synth. Commun., 1989, 19, 1641–1647 CrossRef CAS PubMed.
Footnote |
| † Electronic supplementary information (ESI) available: MS spectra and chromatograms. See DOI: 10.1039/c5ra06781b |
| This journal is © The Royal Society of Chemistry 2015 |