Crystalline quality assessment, photocurrent response and optical properties of reduced graphene oxide uniformly decorated zinc oxide nanoparticles based on the graphene oxide concentration
Majid Azarang*ab,
Ahmad Shuhaimia and
M. Sookhakianc
aNitride Semiconductor Research Laboratory, Low Dimensional Materials Research Center (LDMRC), Department of Physics, Faculty of Sciences, University of Malaya, 50603 Kuala Lumpur, Malaysia. E-mail: azarangmajid@gmail.com; majid@nitride.org.my; Fax: +60 379674146; Tel: +60 123161935
bDepartment of Physics, University of Sistan and Baluchestan, 98135-674, Zahedan, Iran. E-mail: azarang@phys.usb.ac.ir; Tel: +98 9151432495
cLow Dimensional Materials Research Center (LDMRC), Department of Physics, Faculty of Sciences, University of Malaya, 50603 Kuala Lumpur, Malaysia
First published on 5th June 2015
Abstract
Zinc oxide-nanoparticles (ZnONPs)–reduced graphene oxide (rGO) composites with a high degree of crystallinity and a high dispersity were successfully synthesized via a one-pot, facile sol–gel method in a starch environment, during which the formation of zinc oxide nanoparticles, the reduction of graphene oxide and the loading of the ZnONPs onto the rGO surface occur simultaneously. Starch, as a natural capping agent, plays a significant role in controlling the degree of dispersion and coverage of the ZnONPs. The effect of rGO on the crystalline structure and optical properties of the ZnONPs was determined via X-ray diffraction, UV-visible diffused reflectance spectroscopy and photoluminescence spectroscopy. The ZnONPs+rGO composites exhibit excellent potential for photocurrent generation compared with pure ZnONPs under visible light irradiation, provided that efficient photo-induced charge separation and transportation can be achieved at the interface. The maximum photocurrent response, crystalline quality and factor optical properties (NBE/DLE ratio) were obtained for the ZnONPs+rGO composite with a 1.7% mass fraction of rGO, which is twice that achieved on pure ZnONPs.
1. Introduction
Recently, carbon allotrope-based semiconductor composites have received great attention in the field of solar cells, which are one of the prospective methods for converting solar energy to electrical energy.1 Reduced graphene oxide (rGO) is a new class of the carbon family, is tightly packed into a two-dimensional honeycomb lattice, and possesses superior mobility of charge carriers at room temperature (200![[thin space (1/6-em)]](https://www.rsc.org/images/entities/char_2009.gif) 000 cm2 V−1 S−1), excellent transparency (∼97.7%) and a large surface area (∼2600 m2 g−1).2,3 Although rGO possesses poor photoelectric properties, the formation of semiconductor nanostructures can largely expand, improve, or alter the properties and applications of pristine rGO. However, rGO could prevent semiconductor nanostructures from undergoing photo corrosion. A fast charge recombination rate in semiconductor nanostructures and a fast charge transport rate between the semiconductor and the conducting electrode are the major challenges in the photoelectric devices, which could be solved by the incorporation of rGO. Modifying the conducting electrode by rGO leads to the improvement of the conversion efficiency of solar cell devices because the high conductivity of rGO makes it a great material to accept photoinduced charge carriers and to promote the electron transfer rate of the semiconductor nanostructure conduction band to the conducting electrode by trapping the photogenerated electrons. To date, a large number of inorganic semiconductors, such as TiO2, ZnS, CdS, MnO2 and PbO, have been successfully attached onto rGO surfaces to form unique hybrid materials for photoelectric devices.4–9
000 cm2 V−1 S−1), excellent transparency (∼97.7%) and a large surface area (∼2600 m2 g−1).2,3 Although rGO possesses poor photoelectric properties, the formation of semiconductor nanostructures can largely expand, improve, or alter the properties and applications of pristine rGO. However, rGO could prevent semiconductor nanostructures from undergoing photo corrosion. A fast charge recombination rate in semiconductor nanostructures and a fast charge transport rate between the semiconductor and the conducting electrode are the major challenges in the photoelectric devices, which could be solved by the incorporation of rGO. Modifying the conducting electrode by rGO leads to the improvement of the conversion efficiency of solar cell devices because the high conductivity of rGO makes it a great material to accept photoinduced charge carriers and to promote the electron transfer rate of the semiconductor nanostructure conduction band to the conducting electrode by trapping the photogenerated electrons. To date, a large number of inorganic semiconductors, such as TiO2, ZnS, CdS, MnO2 and PbO, have been successfully attached onto rGO surfaces to form unique hybrid materials for photoelectric devices.4–9
ZnO is an important wide-band gap semiconductor that has a direct band gap (3.37 eV) with a high exciton binding energy (∼60 meV), which is greater than the thermal energy at room temperature. It is a promising material for ultraviolet nano-optoelectronic devices and lasers operating at room temperature.10,11 ZnO has also drawn great attention as a good electron acceptor and conducting layer.12 The graphene and ZnO in a hybrid material can act in a cooperative way by increasing the migration efficiency of photoinduced electrons and effectively reducing recombination.13,14 Therefore, various routes have been used to synthesize ZnO@graphene composites such as plasma-enhanced chemical vapour deposition (PECVD),15 metal–organic chemical vapour deposition (MOCVD),16 solvothermal synthesis,17 a sonication method,18 and a microwave-assisted reaction method.19 In addition, several studies have been reported about ZnO@graphene composites that have been used for photovoltaic applications.20–22 Most of these techniques are complex, expensive, and time consuming. Among these different methods, the sol–gel method is simple, fast and inexpensive. In addition, it is very important to obtain a narrow size distribution for the final product and to be able to control the morphology of the NPs. These objectives can be achieved by using a suitable polymerization agent in the sol–gel process. Furthermore, zinc oxide is a favourable candidate as a working electrode to substitute for other semiconductors in solar cell devices due to the rapid generation of electron–hole pairs, highly negative reduction potentials of the excited electrons and high electron mobility compared with TiO2 and ZnS.23 Modifying the chemical composition of ZnO by loading organic conductive materials, particularly rGO, could promote the advantages of ZnO in ZnONPs+rGO composites. However, the major challenge is to synthesize ZnO nanostructures with high crystallinity and good dispersity on the surface of rGO nanosheets. ZnO nanoparticles tend to aggregate onto the surface of rGO during the formation process due to their high surface-to-volume ratio, which results in a higher recombination rate of photoinduced charge carriers. To overcome this challenge, many efforts have been focused on the utilization of surfactants during the synthesis process. In most cases, high molecular weight polymers, such as poly(acrylic acid) (PAA) or polyvinyl pyrrolidone (PVP), were added to avoid ZnO agglomeration on the surface of the rGO.24 However, these surfactants induce the formation of toxic organic sulphur-containing compounds. To date, various methods have been utilized for the synthesis of ZnONPs+rGO composites, such as one-step and multi-step synthesis. The three main steps are the preparation of ZnO nanostructures, the reduction process of graphene oxide (GO) to reduced graphene oxide (rGO) and the decoration of the semiconductor nanostructure into the rGO surface with a narrower size distribution and good homogeneity and stability, which can be described as “one-pot synthesis”.
Building from these ideas, we report a facile one-pot synthesis method of a ZnONPs+rGO composite via a sol–gel approach using zinc nitrate hexahydrate and GO as the starting materials. In our strategy, using a suitable polymer agent, such as starch, can improve the quality of the final product. Therefore, in this study, a simple sol–gel method was used to synthesize ZnO nanoparticles with a narrow size distribution, which were decorated on a reduced graphene oxide (rGO) sheet in a starch environment. Starch was used as a polymerization agent and served as the terminator for the growth of the ZnONPs because it expanded during the calcination process, which prevented the particles from coming together easily. In addition, one of the merits of this method is that the starch and the ZnO nanoparticle products are environmentally friendly. The other merit is that starch reduces GO under mild conditions and simultaneously plays an important role as a capping agent in stabilizing the as-prepared graphene. Most importantly, starch alone can transform graphene oxide into the reduced graphene oxide.25 Then, the photocurrent properties of the as-synthesized ZnONPs+rGO composites under visible light irradiation were investigated to gain insight into the effect of the concentration of rGO on the photocurrent properties of the ZnO nanoparticles (ZnONPs). To the best of our knowledge, there have been no reports on the one-pot sol–gel syntheses of reduced graphene oxide uniformly decorated with zinc oxide nanoparticles in a starch environment, and this is the first demonstration of the functionalization of a ZnONPs+rGO modified indium tin oxide (ITO) electrode surface with ZnO nanoparticles fabricated by starch, which is a suitable natural polymer agent for solar cells. Here, we report for the first time a fast, one-step, cost-effective, and environmentally friendly synthesis of rGO uniformly decorated with hierarchical ZnONPs using a one-pot sol–gel method in a starch environment.
2. Experimental
2.1 Chemical reagents
All chemicals, which were purchased from Merck Co., were of analytical purity and were used without further purification. Milli Q-Plus water (resistance, 18.3 MΩ) was utilized for all experimental procedures. All experiments were carried out at atmospheric air pressure.2.2 Materials
Graphite flakes (code no. 3061) were purchased from Ashbury Inc. (NJ, USA). Sulphuric acid (H2SO4, 98%), potassium permanganate (KMnO4, 99.9%), hydrogen peroxide (H2O2, 30%), hydrochloric acid (HCl, 37%), and sodium hydroxide (NaOH, 99.99%) were purchased from Merck. Zinc nitrate hexahydrate (Zn (NO3)2·6H2O) was purchased from Systerm, Malaysia. Starch was obtained from Sigma-Aldrich (St. Louis, MO). Distilled water was used throughout the sample preparation.2.3 Preparation of exfoliated graphite GO
Exfoliated graphite oxide was prepared based on a modified Hummer's method.26 Typically, graphite flakes were oxidized by mixing H2SO4 and H3PO4 at a ratio of 4![[thin space (1/6-em)]](https://www.rsc.org/images/entities/char_2009.gif) :
:![[thin space (1/6-em)]](https://www.rsc.org/images/entities/char_2009.gif) 1 (v/v) at room temperature. The graphite and potassium permanganate were added slowly to the above mixture solution. Then, the mixtures were stirred for three days to complete the oxidation of the graphite. After that, hydrogen peroxide was added to stop the reaction. The mixture was sonicated and washed with HCl and water several times until the pH became neutral. During the washing and sonication process, the graphite oxide was exfoliated to graphene oxide nanosheets (GONSs). The product was dried in a vacuum oven overnight at 60 °C. The resulting product was a loose brown powder with a hydrophilic nature.
1 (v/v) at room temperature. The graphite and potassium permanganate were added slowly to the above mixture solution. Then, the mixtures were stirred for three days to complete the oxidation of the graphite. After that, hydrogen peroxide was added to stop the reaction. The mixture was sonicated and washed with HCl and water several times until the pH became neutral. During the washing and sonication process, the graphite oxide was exfoliated to graphene oxide nanosheets (GONSs). The product was dried in a vacuum oven overnight at 60 °C. The resulting product was a loose brown powder with a hydrophilic nature.
2.4 Preparation of ZnONPs+rGO composite
ZnONPs were synthesized and decorated onto the resulting GO sheets via a sol–gel method in a starch environment. In this synthesis, analytical grade zinc nitrate hexahydrate (Zn(NO3)2·6H2O), starch and distilled water were used as the starting materials. First, a starch solution was prepared by adding starch at 22 wt%/v to 150 ml of distilled water at 60 °C. The zinc nitrate (4.46 g) was dissolved separately in 50 ml of distilled water at room temperature, and a solution of GO with a 1.7 wt%/v concentration was added to this zinc nitrate solution. Finally, the resulting solution was added to the starch solution. After this, the compound solutions were stirred and heated at 80 °C until a gel with a dark-brown colour was obtained (∼12 h). The gel was calcined at 350 °C for 1 h at a heating rate of 2 °C min−1 to obtain the composite. Eventually, the product, ZnONPs+rGO, was obtained using centrifugation, washed with distilled water and ethanol several times to remove the excess polymer and ions, and then dried at 60 °C for 24 h in a vacuum oven. The as-synthesized ZnONPs+rGO composites with 0.0, 0.9, 1.7 and 3.3 wt%/v GO were called ZnONPs, ZnONPs+rGO1, ZnONPs+rGO2 and ZnONPs+rGO3, respectively. Furthermore, to optimize the experimental conditions for the preparation of pure ZnONPs and ZnONPs+rGO, numerous samples with different parameters were synthesized, as listed in Table 1. The experimental mechanisms discussed above are summarized in Fig. 1.| Sample code | Temperature (°C) | Time (h) | Rate (°C min−1) | GO (wt%/v) | Starch (wt%/v) |
|---|---|---|---|---|---|
| A | 300 | 2 | 2 | 1.7 | 22 |
| B | 350 | 2 | 2 | 1.7 | 30 |
| C | 350 | 2 | 2 | 1.7 | 12 |
| D | 350 | 2 | 2 | 1.7 | 22 |
| E | 350 | 1 | 2 | 1.7 | 22 |
| F | 350 | 3 | 2 | 1.7 | 22 |
| G | 350 | 2 | 1 | 1.7 | 22 |
| H | 350 | 2 | 3 | 1.7 | 22 |
| I | 350 | 1 | 2 | 3.3 | 22 |
| J | 350 | 1 | 2 | 0.9 | 22 |
| K | 350 | 1 | 2 | 0.0 | 22 |
| L | 400 | 2 | 2 | 1.7 | 22 |
| M | 350 | 1 | 2 | 0.0 | 0 |
| N | 400 | 1 | 2 | 0.0 | 22 |
| P | 500 | 1 | 2 | 0.0 | 22 |
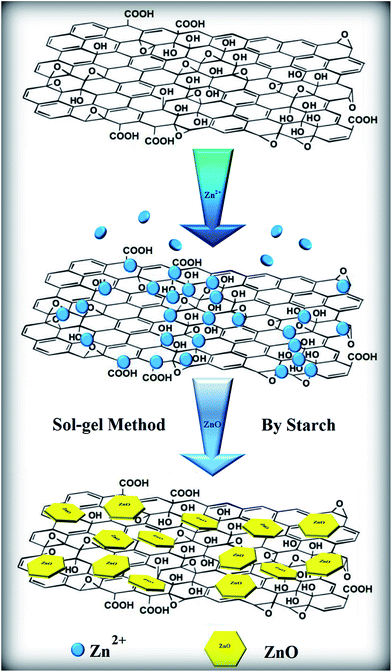 | ||
| Fig. 1 Schematic illustration of the formation mechanism of a ZnONPs+rGO composite via a sol–gel method with starch. | ||
2.5 Device fabrication and photocurrent measurements
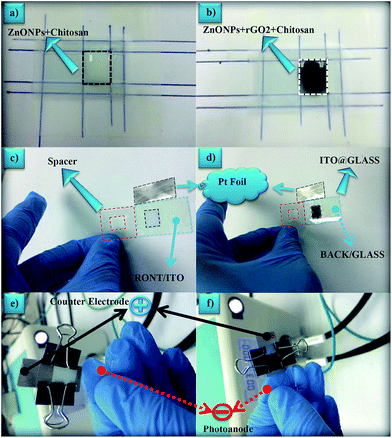
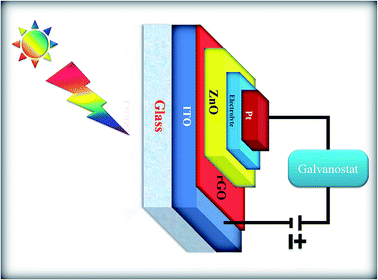
All working electrodes were prepared using the doctor blade method.27–30 For the preparation of the working electrodes, all samples were dispersed in a chitosan solution (0.5 wt%/v) to form a 10 mg ml−1 solution and then ultrasonicated for 5 min. Next, 0.1 ml of colloidal solution was dropped onto a cleaned ITO surface (1 × 1 cm2) and then allowed to dry overnight at room temperature. The solar cell devices were assembled using working electrodes that consist of ZnONPs, ZnONPs+rGO1, ZnONPs+rGO2 and ZnONPs+rGO3 photoanode-modified ITO films and Pt foil as a counter electrode, which were filled with the electrolyte in a 50 μm-thick spacer. The I−/I3− liquid electrolyte consists of 0.5 M KI, 0.05 M I2, 0.6 M tetrabutylammonium iodide and 0.5 M 4-tert-butylpyridine in acetonitrile. A PLS-SXE150 halogen lamp (Beijing Perfectlight Technology Corp., China) was utilized as an illumination source. The light intensity at the photoanodes was 20 mW cm−2, the area illuminated by the photoanodes was 0.5 cm2, and the distance between the working electrode and the lamp was approximately 40 cm. The photocurrent was recorded continuously during the on and off period of the lamp. The transient photocurrent measurements of the devices were performed using a potentiostat/galvanostat (Autolab PGSTAT30) from Ecochemie (Netherlands). Finally, for a better understanding of the actual size, configuration and structure of the device, the fabrication processes device is shown in Fig. 2.2.6 Characterization
The quality of the resulting powder was characterized using several tools. The crystal phase, morphology, and microstructure of the product were characterized using X-ray powder diffraction, XRD (Philips, X'pert, system using CuKα radiation), field emission scanning electron microscopy (FESEM, FEI Nova NanoSEM 400 operated at 10.0 kV), a Raman spectrometer (Renishaw inVia Raman's microscope using laser excitation at λ = 514 nm), a high-resolution transmission electron microscope (HRTEM, JEOL JEM-2100F), and Fourier transform infrared spectrometry (FTIR, Perkin-Elmer System 2000 series spectrophotometer (USA) using the KBr method). UV-visible spectroscopy (Thermo Scientific Evolution) was applied to determine the optical properties. The photoluminescence (PL) spectra were measured at room temperature using a Hitachi F-5000 system.3. Results and discussion
3.1 Morphology
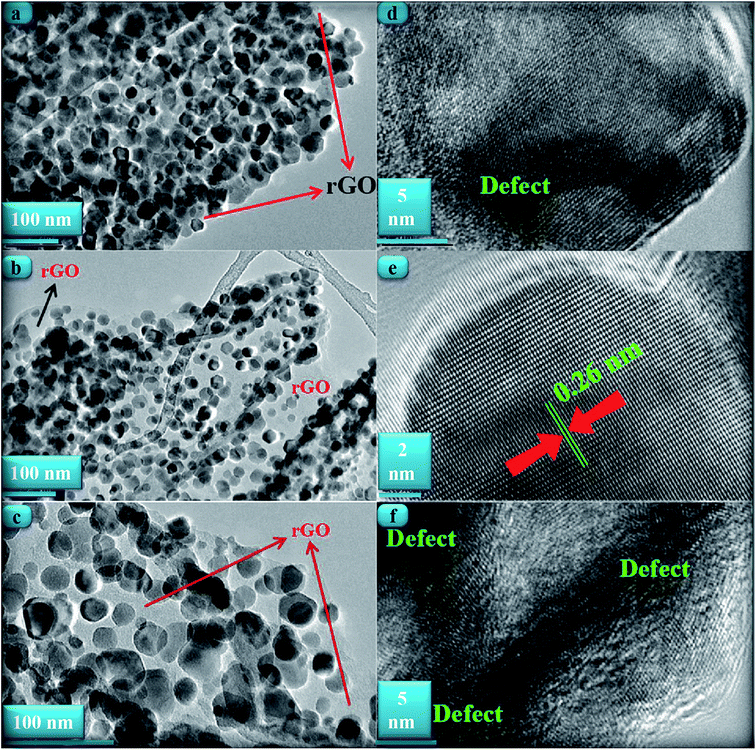
Fig. 3(a)–(c) shows TEM images of the ZnONPs+rGO composites with different concentrations (0.9, 1.7 and 3.3 wt%/v GO) for the rGO sheets. The TEM images reveal that the ZnONPs are decorated and dispersed on the rGO sheets. However, this dispersion is less for ZnONPs+rGO1 than for the other samples. Fig. 4(c) shows that the ZnONPs population in ZnONPs+rGO3 is less than that in the other samples. This result explains why the XRD peak intensities decreased with an increase in the GO concentration. In addition, the size histograms of the ZnONPs+rGO are shown Fig. 4(a)–(c). The histograms show that the main particle sizes of the ZnONPs+rGO1, ZnONPs+rGO2 and ZnONPs+rGO3 with different concentrations for the rGO sheets (0.9, 1.7 and 3.3 wt%/v) were 22 ± 14, 20 ± 6, and 25 ± 10 nm, respectively. Fig. 3(d)–(f) shows HRTEM images of single nanoparticles from sheets with different GO concentrations. These HRTEM images show that the concentration of the rGO sheet affects the crystalline quality of the NPs. It can be observed that there are several areas of damage and defects for the zinc oxide nanoparticles, which were grown on the sheets with the low and high concentrations of GO Fig. 3(d) and (f). On the other hand, the crystalline space of the ZnONPs+rGO2 composite is clear and shows a non-defective structure for the nanoparticle Fig. 3(e). In fact, the HRTEM results are in good agreement with the XRD results. In addition, the HRTEM image of the ZnONPs+rGO2 composite shows that the lattice distance is approximately 0.26 nm Fig. 3(e), which is consistent with the distance along the c-axis of a bulk wurtzite ZnO crystal. Therefore, based on the HRTEM image, the nanoparticles were grown along the [001] direction without any defects. | ||
| Fig. 4 Size distribution diagrams of (a) ZnONPs+rGO1, (b) ZnONPs+rGO2, and (c) ZnONPs+rGO3 composites by histogram curve. | ||
To further investigate the influence of starch and rGO on the nanoparticle distribution on the samples, FESEM analyses of pure ZnONPs and ZnONPs+rGO(1, 2 and 3) composites with different concentrations for the rGO sheets (0.9, 1.7 and 3.3 wt%/v) were performed (Fig. 5(a) and (b)). As observed in Fig. 5(a), zinc oxide nanoparticles agglomerate in the absence of starch. The FESEM image of pure ZnONPs (Fig. 5(a)) clearly shows that the particles agglomerate due to the large surface to volume ratio of nanoparticles. Because of their strong surface reactivity, most nanoparticles undergo agglomeration. To overcome this challenge, starch has been used to obtain a narrower particle size distribution and also to control the particle size of the final product. Therefore, to investigate the effect of starch as a natural surfactant, the FESEM images of the as-synthesized ZnONPs are shown in Fig. 5(b). As observed in Fig. 5(b), the presence of starch significantly affects the size distribution of the nanoparticles, and starch as a natural capping agent is able to separate the nanoparticles and prevent their agglomeration.
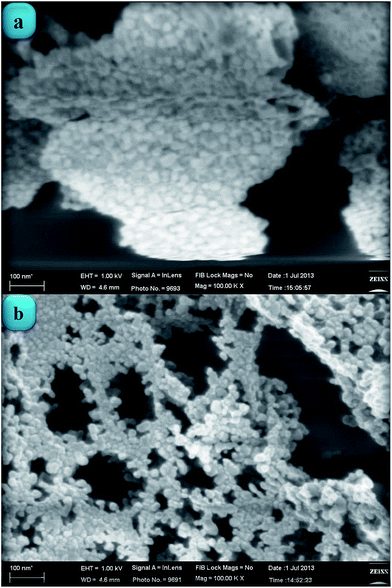 | ||
| Fig. 5 (a) FESEM image of pure ZnONPs in the absence of starch (sample M). (b) FESEM image of pure ZnONPs in the presence of starch (sample K). | ||
However, when the rGO is added to the system, the ZnONPs covered the surface of the rGO uniformly, and a good loading of the ZnONPs on the rGO nanosheets occurred (Fig. 3(a)–(c)). Moreover, as observed in Fig. 3(a)–(c), the surface of the rGO thin film is clearly visible, while the typical wrinkle-like features are barely visible. A more careful and close-up view reveals that the individual ZnONPs with sizes in the range of 22–25 nm are well separated from each other and are well distributed on the graphene sheets, i.e., no large areas of the graphene sheets without ZnO decoration are found. Moreover, the partially enlarged image in Fig. 3(b) clearly illustrates that there is no apparent aggregation of the ZnONPs on the graphene sheets; in addition, the rGO nanosheets can function as conductive bands for the interconnection between the various ZnONPs and the transfer of photogenerated charge carriers to enhance the transient photocurrent. Based on these results, the possible mechanism of growth can be predicted. The positively charged Zn2+ ions attached onto the surface of the graphene oxide due to its negative charge. The initial nucleation of ZnONPs was formed during the sol–gel process due to the reaction of the adsorbed Zn2+ onto GO via the O2− ions. An in situ charge transfer process occurred between ZnO nuclei and graphene oxide to produce rGO. However, starch, as a natural polymerization agent, acts as terminator for the growth of ZnONPs. Starch was expended during the calcined process in 350 °C to prevent the nanoparticles from agglomerating.
3.2 Crystalline structure
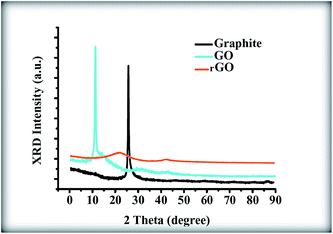
Fig. 6 shows the X-ray diffractogram of graphite, GO and rGO. An intense and sharp diffraction peak for GO appears at 2θ = 10.6°, which is attributed to the (001) lattice plane with the interlayer spacing of 0.83 nm, which is consistent with the lamellar structure of GO. This spacing is much wider than that of the graphite narrow peak located at 26.8°, which has an interlayer spacing of 0.33 nm. This result indicates that GO sheets have been effectively exfoliated from the raw graphite.31,32 As a comparison, after the sol–gel process of the pure GO without the presence of ZnONPs, the diffractogram illustrates the disappearance of this strong peak along with the appearance of a very broad (002) peak and a very weak (100) peak at 2θ of 24.32° and 42.55°, respectively; the peaks at 24.32° and 42.55° correspond to interlayer spacings of 0.36 nm and 0.21 nm, respectively.32 This result indicates that the GO was reduced to rGO during the sol–gel process due to the removal of the functional groups.32The phase structures of the ZnONPs+rGO composites with the different mass fractions of rGO in the presence of starch are illustrated in Fig. 7. It is evident that all of the samples exhibit similar XRD patterns to blank ZnO, i.e., the existence of rGO does not affect the growth of new crystal orientations of ZnO; thus, rGO only functions as a platform where the ZnONPs can nucleate and grow. The peaks located at 2θ values of 32.09°, 34.53°, 36.91°, 48.43°, 57.22°, 63.13°, and 68.47°, which can be indexed to the (100), (002), (101), (102), (110), (103), and (200) lattice planes, respectively, of the ZnO wurtzite structure (JCPDS card no. 00-036-1451) with the lattice constant a = b = 0.3218 nm, c = 0.5330 nm. Furthermore, compared with the pure ZnONPs, the high intensity diffraction peak of ZnONPs+rGO composites with different mass fraction of rGO at 34.53° is broadened slightly, which is attributed to slight reduction of the crystalline size of the ZnONPs in the composite in the presence of rGO.
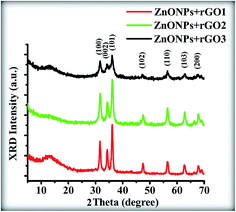 | ||
| Fig. 7 XRD patterns of the ZnONPs+rGO composites with low rGO concentration (ZnONPs+rGO1), min. rGO concentration (ZnONPs+rGO2), and high rGO concentration (ZnONPs+rGO3). | ||
From the Scherrer eqn (1), the estimated crystallite sizes of ZnONPs in the absence of rGO and in the presence of rGO with different mass ratios were calculated (Table 2). Notably, no typical diffraction peaks of rGO are observed in the ZnONPs+rGO composites, which might be due to the low diffraction intensity peak and small amount of rGO.33
 | (1) |
| Sample code | 2θ (°) | FWHM (°) | Crystallite size (nm) |
|---|---|---|---|
| ZnONPs (sample K) | 34.3282 | 0.2528 | 25.07656 |
| ZnONPs+rGO1 (sample J) | 34.3842 | 0.3801 | 22.03493 |
| ZnONPs+rGO2 (sample E) | 34.3894 | 0.3936 | 21.01845 |
| ZnONPs+rGO3 (sample I) | 34.3956 | 0.3992 | 20.03745 |
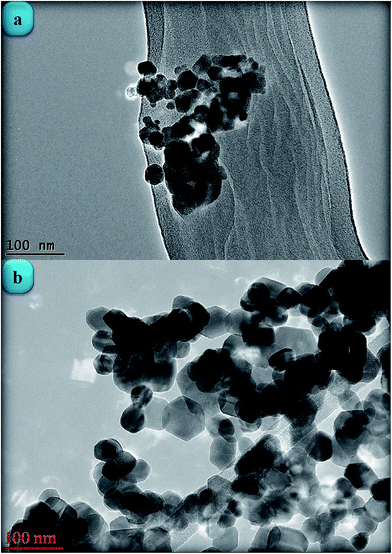
To better understand the effects of the rGO sheets on the growth process for the ZnONPs, zinc oxide nanoparticles were synthesized without graphene at 400 and 500 °C. The XRD patterns of these conditions are shown in Fig. 8. It can be observed that the XRD pattern of the NPs that were sintered at 400 °C indicates a low crystalline quality. On the other hand, the XRD pattern of the NPs that were sintered at 500 °C indicates a good crystalline quality.
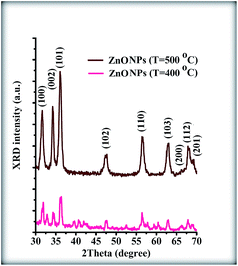 | ||
| Fig. 8 XRD patterns of the pure ZnONPs that were grown by 400 and 500 °C temperature sample N and sample P, respectively. | ||
In addition, the TEM images for NPs sintered under these conditions confirm the XRD results (Fig. 9(a) and (b)). Furthermore, these TEM images show that the NPs were not very well dispersed without the rGO sheet. According to the obtained results, it can be concluded that the rGO sheets not only play a role as a dispersion site for the NPs but also play a role as a useful site to grow the ZnONPs. In fact, the rGO sheets could decrease the calcination temperature. The widely accepted mechanism for the synthesis of graphene decorated with inorganic nanostructures is the attraction of positively charged metal ions by the polarized bonds of the functional groups on the GO. The attachment of these metal ions to the surface and edges of the GO results in a redox reaction and the formation of nucleation sites, which eventually leads to the growth of nanostructures on the 2-D graphene sheets.35
3.3 Chemical composition
Fig. 10 shows the FTIR spectra of the pristine GO, starch powder, ZnONPs+rGO1, ZnONPs+rGO2, and ZnONPs+rGO3 composites. In the FTIR spectrum of GO, the broad peak centred at 3190 cm−1 is attributed to the O–H stretching vibrations, and the peaks at 1731, 1625, 1183, and 1040 cm−1 are assigned to the C![[double bond, length as m-dash]](https://www.rsc.org/images/entities/char_e001.gif) O stretching, sp2-hybridized C
O stretching, sp2-hybridized C![[double bond, length as m-dash]](https://www.rsc.org/images/entities/char_e001.gif) C group, O–H deformation, C–OH stretching, and C–O stretching, respectively.36 In contrast, the peaks at 1731, 1183, and 1040 cm−1 are missing from the FTIR spectra of the ZnONPs+rGO(1, 2 and 3) composites, which indicate the reduction of GO and its transformation to rGO.37,38 In addition, the FTIR spectrum of starch powder is shown in Fig. 10. The peaks of the starch are dramatically smaller in the FTIR spectra of the ZnONPs+rGO(1, 2 and 3) composites. In fact, the annealing process at 350 °C caused the transformation of GO to rGO and removed the starch, which is in good agreement with the XRD results. In addition, the FTIR spectrum of the ZnONPs+rGO(1, 2 and 3) shows a peak at 437 cm−1. The band at 437 cm−1 corresponds to the E2 mode of hexagonal ZnO (Raman active).39 Therefore, the resulting composite consisted of ZnONPs decorated on an rGO sheet. A weak peak appears at 437 cm−1 for the pure ZnONPs. Therefore, the FTIR results also show that pure ZnONPs cannot form at 350 °C in a starch environment.
C group, O–H deformation, C–OH stretching, and C–O stretching, respectively.36 In contrast, the peaks at 1731, 1183, and 1040 cm−1 are missing from the FTIR spectra of the ZnONPs+rGO(1, 2 and 3) composites, which indicate the reduction of GO and its transformation to rGO.37,38 In addition, the FTIR spectrum of starch powder is shown in Fig. 10. The peaks of the starch are dramatically smaller in the FTIR spectra of the ZnONPs+rGO(1, 2 and 3) composites. In fact, the annealing process at 350 °C caused the transformation of GO to rGO and removed the starch, which is in good agreement with the XRD results. In addition, the FTIR spectrum of the ZnONPs+rGO(1, 2 and 3) shows a peak at 437 cm−1. The band at 437 cm−1 corresponds to the E2 mode of hexagonal ZnO (Raman active).39 Therefore, the resulting composite consisted of ZnONPs decorated on an rGO sheet. A weak peak appears at 437 cm−1 for the pure ZnONPs. Therefore, the FTIR results also show that pure ZnONPs cannot form at 350 °C in a starch environment.
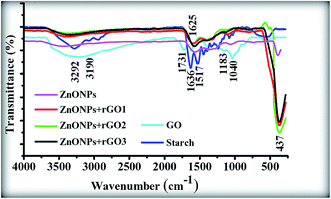 | ||
| Fig. 10 FTIR spectra of the GO sheet, starch powder, and ZnONPs+rGO1, ZnONPs+rGO2, and ZnONPs+rGO3 composites. | ||
3.4 Optical properties
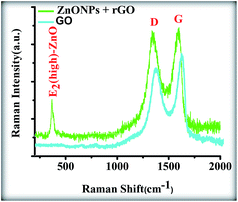
Fig. 11 shows the Raman spectrum of the ZnONPs+rGO2 composite. The graphene obtained from the chemical reduction of GO exhibits two characteristic main peaks: the D band at ∼1365 cm−1, which arises from a breathing mode of κ-point photons with A1g symmetry, and the G band at ∼1610 cm−1, which arises from the first-order scattering of the E2g mode phonons of the sp2-bonded carbon atoms.40,41 The D and G band positions and intensity ratios of I(D)/I(G) for the GO and ZnONPs+rGO2 composites prepared using the sol–gel method are summarized in Table 3. In comparison to the pristine GO, the Raman spectrum of the ZnONPs+rGO2 composite shows that the D and G bands shifted to lower wave numbers at ∼1357 and ∼1600 cm−1, respectively, because of the reduction process for the GO, which can be supported by starch as the reducing, capping, and stabilizing agent.42 In addition to the peaks associated with the D and G bands of graphene, the Raman spectrum of the ZnONPs+rGO2 composite shows a sharp and narrow peak at 437 cm−1 corresponding to the E2 (high) mode of the Raman active mode, a characteristic peak for the wurtzite hexagonal phase of ZnO. The Raman results confirmed that the ZnONPs+rGO2 composite was composed of graphene nanosheets and pure ZnO.| GO | ZnONPs+rGO | |
|---|---|---|
| D band (cm−1) | 1365 | 1357 |
| G band (cm−1) | 1610 | 1600 |
| I(D)/I(G) | 0.81 | 1.13 |
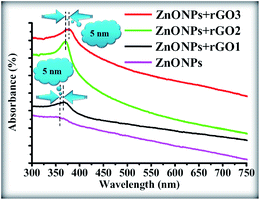
The room temperature UV-Vis absorption spectra of ZnONPs+(rGOX)X = 0,1,2,3 are shown in Fig. 12. The ZnONPs+(rGOX)X = 0,1,2,3 composites were dispersed in ethanol with a concentration of 0.1 wt% and then the solution was used to perform the UV-Vis measurement. The UV-Vis absorption spectra of the ZnONPs and ZnONPs+rGO at room temperature are shown in Fig. 12. These spectra reveal a characteristic absorption peak for different composites at a wavelength of ∼360, ∼365, ∼369, ∼374 nm for ZnONPs, ZnONPs+rGO1, ZnONPs+rGO2 and ZnONPs+rGO3 samples due to the electron transitions from the valence band to the conduction band (O2p → Zn3d), which can be assigned to the intrinsic band-gap absorption of ZnO.43 Furthermore, it is observed that the sharp characteristic absorption peak at 365 nm indicates the existence of good crystalline and impurity-suppressed ZnONPs,19,44 and it was proposed that the Zn–O–C bond between ZnO and rGO was formed, which is in good agreement with the FTIR and Raman results. Similar phenomena were also observed for RGO/ZnO composites prepared by Y. Zhang et al.45 confirming what we proposed in this paper. As observed, the small redshifts (∼5, ∼4, and ∼5 nm) of the absorption edge compared to pure ZnO should be attributed to the chemical bonding between ZnO and rGO, which is similar to the result in the case of the ZnONPs+rGO composite materials.19,46 However, it is observed that the absorbance of the ZnONPs+rGO(1, 2 and 3) composites increases in comparison to the absorbance of the ZnONPs. This increase in absorbance may be due to the absorption contribution from rGO, the increase in the surface electric charge of the oxides, and the modification of the fundamental process of electron–hole pair formation during irradiation.35 Therefore, the presence of rGO in the ZnO can increase the light absorption, which is beneficial to the optoelectronic performance. From the plot curve  , which is the first derivative of energy absorption with respect to energy, the estimated band gap energies of ZnONPs in the absence of rGO and in the presence of rGO with different mass ratio were calculated Fig. 13.47 The band gap value of ZnONPs was calculated using ultraviolet-visible (UV-Vis) spectroscopy and decreased with increased rGO concentration.
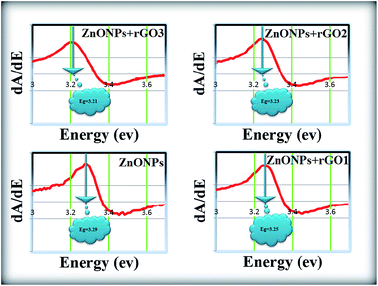 | ||
| Fig. 13 The band gap of the ZnONPs, ZnONPs+rGO1, ZnONPs+rGO2, and ZnONPs+rGO3 composites estimated from first derivative. | ||
Eventually, the optical absorption edge of the ZnONPs shifts to a slightly higher wavelength with the increase in the ratio of rGO in the ZnONPs+rGO composites. Therefore, these results indicate that although the band gap of ZnONPs very slightly decreases in the presence of rGO, as shown in Fig. 12, the band gap narrowing of all the ZnONPs+rGO hybrids was clearly observed. Furthermore, the hybrids containing higher concentrations of rGO show a narrower band gap, indicating that the interaction between the ZnO nanoparticles and the rGO sheets enhances with an increase the concentration of rGO. These results support that the preparation of ZnONPs+rGO with a sol–gel process with starch is successful.5
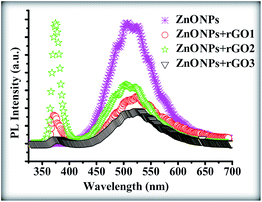
Fig. 14 shows the photoluminescence (PL) spectra of the products. A significant difference can be seen between the PL spectrum of the pure ZnONPs, which were grown at 350 °C, and that of the ZnONPs+rGO composites. To further confirm the above assumption, PL spectra of the as-prepared samples were investigated as shown in Fig. 14. The two typically sharp and broad peaks of pure ZnO nanoparticles can be found at ∼364 and ∼538 nm,48 corresponding to the near band edge (NBE) emission and deep level emission (DLE), respectively. The NBE emission originates from the recombination of free excitons in the near band edge of the wide band gap ZnO nanoparticles, and the DLE emission is assigned to various intraband defects in the crystal, such as zinc vacancies, interstitial zinc, oxygen vacancies, interstitial oxygen, and antisite oxygen.49 The UV emission is also called near band edge (NBE) emission because of the recombination of free excitons through an exciton–exciton collision process. It has been suggested that the green band emission DLE corresponds to a singly ionized oxygen vacancy in ZnO and results from the recombination of a photogenerated hole with the singly ionized charge state of this defect. Therefore, Fig. 14 shows that the ZnONPs have very high concentrations of oxygen vacancies. However, the intensity of the UV peak is increased and that of the visible peak is decreasing with an increasing the graphene concentration. However, the NBE/DLE ratio of the ZnONPs+rGO2, which is one of the main factors that is usually used for comparing the optical properties of samples, is bigger than the NBE/DLE ratios of the other composites. Therefore, the ZnONPs+rGO2 composites have a better relative crystalline quality. According to these results, it can be understood that the graphene concentration has an optimum value in relation to improving the optical quality of the ZnONPs. In fact, the optical study results are in good agreement with the XRD and TEM results. Therefore, the ZnONPs+rGO2 composite is the best composite of ZnO and rGO for improving the crystalline and optical quality of the ZnONPs, which were sintered at a lower temperature than is normally used to grow pure ZnONPs by the sol–gel method in a starch environment.
4. Studies of the photocurrent response
4.1 Transient photocurrent response of ZnONPs and ZnONPs+rGO films
A schematic of the solar cell device fabricated using the ZnONPs+rGO modified ITO electrode is illustrated in Fig. 15. To investigate the influence of rGO on the photoelectrochemical properties of the fabricated solar cell devices, the transient photocurrent response was measured under visible light irradiation. The transient photocurrents of pure ZnONPs, ZnONPs+rGO1, ZnONPs+rGO2, and ZnONPs+rGO3 modified ITO electrodes irradiated with visible light are illustrated in Fig. 15. The applied bias was 0 V vs. an SCE reference electrode.As observed in Fig. 16, a small anodic photocurrent density of 0.61 mA cm−2 was obtained for pure ZnONPs when the light source was switched on. Moreover, the dark current was ∼0.1 nA cm−2 when the light source was switched off. However, the presence of rGO leads to the enhancement of transient photocurrent response of pure ZnO from 0.61 mA cm−2 to 1.22 mA cm−2 for ZnONPs+rGO1. However, with the increase in the rGO concentration up to 1.7 wt%/v, the transient photocurrent initially increases from 1.22 mA cm−2 to 2.1 mA cm−2 for both ZnONPs+rGO1 and ZnONPs+rGO2. A further increase in the rGO concentration up to 3.3 wt% leads to a decrease in transient photocurrent from 2.1 mA cm−2 to 1.17 mA cm−2. The optimized value is obtained from ZnONPs+rGO2 (based on ZnONPs+rGO (1.7 wt%/v)), under visible light irradiation (100 mW cm−2), which is approximately 4-fold higher than that of the pure ZnONPs electrode. Moreover, the transient photocurrents were rapid, steady, prompt and reproducible during several on–off cycles of the visible light irradiation for all samples as well; no overshoots were observed at the beginning and the end of the flash. The rectangular response indicates that no grain boundaries exist in the direction of electron diffusion. The grain boundaries create deep traps to slow the electron transport and may exist at the particulate electrode.50 This finding also suggests that the excited electrons are collected efficiently in the external circuit.50
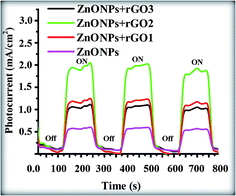 | ||
| Fig. 16 Photocurrent versus time (i–t) curves of the solar cell device based on pure ZnONPs and ZnONPs+rGO composite with different concentration ratios of GO (0.9, 1.7 and 3.3 wt%/v). | ||
To better understand the effects of the factors of crystalline quality and optical properties (NBE/DLE ratio) on the photocurrent for the ZnONPs, zinc oxide nanoparticles were synthesized without graphene oxide and in the presence of graphene oxide as shown in Table 4. It can be observed that they have direct contact with each other.
| Sample code | NBE | DLE | NBE/DLE | Photocurrent (mA cm−2) |
|---|---|---|---|---|
| ZnONPs (sample K) | 147.95 | 6441.84 | 0.0229 | 0.61 |
| ZnONPs+rGO1 (sample J) | 1589.81 | 2596.86 | 0.6122 | 1.22 |
| ZnONPs+rGO3 (sample I) | 247.31 | 1851.78 | 0.1335 | 1.17 |
| ZnONPs+rGO2 (sample E) | 6790.51 | 3307.86 | 2.0528 | 2.1 |
4.2 Mechanism
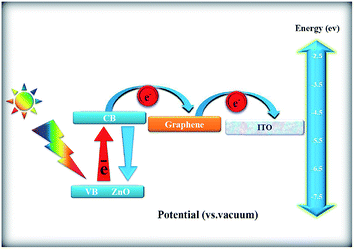
Fig. 17 shows the possible mechanism of photocurrent generation on ZnONPs+rGO composites under the visible light irradiation. As observed in the figure, the main reason for the enhancement of the photocurrent response of the ZnONPs+rGO composites is related to the stepwise structure of the energy levels constructed in the composite, which causes enhanced charge separation. As observed in Fig. 17, the conduction band and valence band for ZnONPs are −4.05 eV and −7.25 eV (vs. vacuum), respectively, and the work function of rGO is −4.8 eV.51 Therefore, ZnONPs absorb visible light to produce electron–hole pairs. These photo-induced electrons are easily transferred from the ZnO conduction band to the rGO sheets and then to the ITO substrate via a percolation mechanism; the electrons are finally scavenged by the I−/I3− pair in the electrolyte. Therefore, based on the UV-Vis and PL results, it is clear that the enhanced photocurrent in ZnONPs+rGO composites is related to rGO; these composites not only extend the photoresponse range of solar spectrum to the visible light range but also improve the interfacial electron transfer and constrain the electron–hole pair recombination of ZnONPs in ZnONPs+rGO composites. Moreover, the effect of the rGO content in the improvement of transient photocurrent plays an important role. The transient photocurrent of the ZnONPs+rGO composites decreased when the rGO content was increased beyond the optimum value. This phenomenon can be attributed to the following: (i) rGO may absorb some visible light and thus cause a light harvesting competition between ZnO and rGO with the increase in the rGO content, which leads to the decrease in the transient photocurrent, and (ii) excessive rGO can act as a centre for the recombination of electron–hole pairs instead of providing an electron pathway, as observed in the PL results in Fig. 14.515. Conclusions
A ZnONPs+rGO composite with a diameter of 20 ± 6 nm was successfully synthesized using a simple one-pot sol–gel method with the assistance of starch as a capping agent. The FTIR and Raman results clearly show the reduction of graphene oxide in the composite to reduced graphene oxide. The transient photocurrent results show that (i) ZnONPs+rGO composites enable significant improvement in the transient photocurrent under visible light irradiation compared to pure ZnO, due to the increase in the light absorption in the visible region, the decrease in the charge recombination, and the increase in charge transport; (ii) the transient photocurrent of ZnONPs+rGO composite is dependent on the weight percentage of the reduced graphene oxide in the composite and the ZnONPs+rGO composite, with 1.7 wt%/v rGO corresponding to a maximum transient photocurrent of 2.1 mA cm−2 and a maximum crystalline quality for ZnONPs+rGO2. Furthermore, for a better understanding of the conclusions on the effect of the GO concentration on the crystalline quality and factor optical properties (NBE/DLE ratio), the photocurrent, crystallite size and FWHM for the ZnONPs+rGO composite are shown in Fig. 18(a)–(d).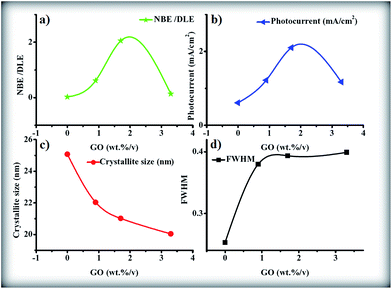 | ||
| Fig. 18 The (a) NBE/DLE, (b) photocurrent, (c) crystallite size, and (d) FWHM versus GO concentration as final conclusions. | ||
Acknowledgements
Majid Azarang gratefully acknowledges the support provided by the University of Malaya for this research work through research Grant no. PG058-2012B (Postgraduate Research Grant (PPP) – Research) and acknowledges the University of Sistan and Baluchestan, Zahedan, Iran. In addition, Ahmad Shuhaimi acknowledges Grants UM.C/625/1/HIR/MOHE/SC/06 (High Impact Research Grant-HIR), FP009-2013A (Fundamental research Grant Scheme-FRGS), and RG141-11AFR & RP007B-13AFR (University of Malaya Research Grant-UMRG).References
- A. Kongkanand, R. M. Dominguez and P. V. Kamat, Nano Lett., 2007, 7, 676–680 CrossRef CAS PubMed.
- A. K. Geim, Science, 2009, 324, 1530–1534 CrossRef CAS PubMed.
- C. Gómez-Navarro, R. T. Weitz, A. M. Bittner, M. Scolari, A. Mews, M. Burghard and K. Kern, Nano Lett., 2007, 7, 3499–3503 CrossRef PubMed.
- M. Azarang, A. Shuhaimi, R. Yousefi, A. Moradi Golsheikh and M. Sookhakian, Ceram. Int., 2014, 40, 10217–10221 CrossRef CAS PubMed.
- G. Cheng, M. S. Akhtar, O.-B. Yang and F. J. Stadler, ACS Appl. Mater. Interfaces, 2013, 5, 6635–6642 CAS.
- X. Liu, L. Pan, T. Lv, G. Zhu, Z. Sun and C. Sun, Chem. Commun., 2011, 47, 11984–11986 RSC.
- H. Cao, B. Li, J. Zhang, F. Lian, X. Kong and M. Qu, J. Mater. Chem., 2012, 22, 9759–9766 RSC.
- J. Qu, L. Shi, C. He, F. Gao, B. Li, Q. Zhou, H. Hu, G. Shao, X. Wang and J. Qiu, Carbon, 2014, 66, 485–492 CrossRef CAS PubMed.
- T.-H. Ji, M. Sun and P. Han, Carbon, 2014, 70, 319 CrossRef CAS PubMed.
- P. Yang, H. Yan, S. Mao, R. Russo, J. Johnson, R. Saykally, N. Morris, J. Pham, R. He and H.-J. Choi, Adv. Funct. Mater., 2002, 12, 323 CrossRef CAS.
- K. C. Park, D. Y. Ma and K. H. Kim, Thin Solid Films, 1997, 305, 201–209 CrossRef CAS.
- W. J. Beek, M. M. Wienk, M. Kemerink, X. Yang and R. A. Janssen, J. Phys. Chem. B, 2005, 109, 9505–9516 CrossRef CAS PubMed.
- B. Li and H. Cao, J. Mater. Chem., 2011, 21, 3346–3349 RSC.
- S. Safa, R. Sarraf-Mamoory and R. Azimirad, Phys. E, 2014, 57, 155–160 CrossRef CAS PubMed.
- W. T. Zheng, Y. M. Ho, H. W. Tian, M. Wen, J. L. Qi and Y. A. Li, J. Phys. Chem. C, 2009, 113, 9164–9168 CAS.
- J. M. Lee, Y. B. Pyun, J. Yi, J. W. Choung and W. I. Park, J. Phys. Chem. C, 2009, 113, 19134–19138 CAS.
- J. Wu, X. Shen, L. Jiang, K. Wang and K. Chen, Appl. Surf. Sci., 2010, 256, 2826–2830 CrossRef CAS PubMed.
- K. Vinodgopal, B. Neppolian, I. V. Lightcap, F. Grieser, M. Ashokkumar and P. V. Kamat, J. Phys. Chem. Lett., 2010, 1, 1987–1993 CrossRef CAS.
- T. Lv, L. Pan, X. Liu, T. Lu, G. Zhu and Z. Sun, J. Alloys Compd., 2011, 509, 10086–10091 CrossRef CAS PubMed.
- X. Huang, Z. Yin, S. Wu, X. Qi, Q. He, Q. Zhang, Q. Yan, F. Boey and H. Zhang, Small, 2011, 7, 1876–1902 CrossRef CAS PubMed.
- X. Huang, X. Qi, F. Boey and H. Zhang, Chem. Soc. Rev., 2012, 41, 666–686 RSC.
- P. V. Kamat, J. Phys. Chem. Lett., 2009, 1, 520–527 CrossRef.
- J. Zhang, J. Yu, M. Jaroniec and J. R. Gong, Nano Lett., 2012, 12, 4584–4589 CrossRef CAS PubMed.
- G. L. Li, G. Liu, M. Li, D. Wan, K. Neoh and E. Kang, J. Phys. Chem. C, 2010, 114, 12742–12748 CAS.
- Y. Feng, N. Feng and G. Du, RSC Adv., 2013, 3, 21466 RSC.
- W. S. Hummers Jr and R. E. Offeman, J. Am. Chem. Soc., 1958, 80, 1339 CrossRef.
- D. Barpuzary and M. Qureshi, ACS Appl. Mater. Interfaces, 2013, 5, 11673–11682 CAS.
- L. Wengeler, M. Schmitt, K. Peters, P. Scharfer and W. Schabel, Chem. Eng. Process., 2013, 68, 38–44 CrossRef CAS PubMed.
- Y. Ohsaki, N. Masaki, T. Kitamura, Y. Wada, T. Okamoto, T. Sekino, K. Niihara and S. Yanagida, Phys. Chem. Chem. Phys., 2005, 7, 4157–4163 RSC.
- Y. J. Kim, M. H. Lee, H. J. Kim, G. Lim, Y. S. Choi, N. G. Park, K. Kim and W. I. Lee, Adv. Mater., 2009, 21, 3668–3673 CrossRef CAS PubMed.
- Y. Zhang, N. Zhang, Z.-R. Tang and Y.-J. Xu, ACS Nano, 2012, 6, 9777–9789 CrossRef CAS PubMed.
- M. Sookhakian, Y. M. Amin, R. Zakaria, W. J. Basirun, M. R. Mahmoudian, B. Nasiri-Tabrizi, S. Baradaran and M. Azarang, J. Alloys Compd., 2015, 632, 201–207 CrossRef CAS PubMed.
- M. Azarang, A. Shuhaimi, R. Yousefi and M. Sookhakian, J. Appl. Phys., 2014, 116, 084307 CrossRef PubMed.
- U. Holzwarth and N. Gibson, Nat. Nanotechnol., 2011, 6, 534 CrossRef CAS PubMed.
- Y. Xue, H. Chen, D. Yu, S. Wang, M. Yardeni, Q. Dai, M. Guo, Y. Liu, F. Lu, J. Qu and L. Dai, Chem. Commun., 2011, 47, 11689–11691 RSC.
- W. S. Hummers and R. E. Offeman, J. Am. Chem. Soc., 1958, 80, 1339 CrossRef CAS.
- W. Zou, J. Zhu, Y. Sun and X. Wang, Mater. Chem. Phys., 2011, 125, 617–620 CrossRef CAS PubMed.
- R. Peng-Gang, Y. Ding-Xiang, J. Xu, C. Tao and L. Zhong-Ming, Nanotechnology, 2011, 22, 055705 CrossRef PubMed.
- T. Jan, J. Iqbal, M. Ismail, Q. Mansoor, A. Mahmood and A. Ahmad, Appl. Surf. Sci., 2014, 308, 75–81 CrossRef CAS PubMed.
- J. Gao, F. Liu, Y. Liu, N. Ma, Z. Wang and X. Zhang, Chem. Mater., 2010, 22, 2213–2218 CrossRef CAS.
- S. Stankovich, D. A. Dikin, R. D. Piner, K. A. Kohlhaas, A. Kleinhammes, Y. Jia, Y. Wu, S. T. Nguyen and R. S. Ruoff, Carbon, 2007, 45, 1558–1565 CrossRef CAS PubMed.
- K. Liu, J.-J. Zhang, F.-F. Cheng, T.-T. Zheng, C. Wang and J.-J. Zhu, J. Mater. Chem., 2011, 21, 12034 RSC.
- H. Yu, J. Yu, B. Cheng and M. Zhou, J. Solid State Chem., 2006, 179, 349–354 CrossRef CAS PubMed.
- T. Lv, L. Pan, X. Liu and Z. Sun, Catal. Sci. Technol., 2012, 2, 2297 CAS.
- Y. Zhang, Z. Chen, S. Liu and Y.-J. Xu, Appl. Catal., B, 2013, 140–141, 598–607 CrossRef CAS PubMed.
- X. Liu, L. Pan, Q. Zhao, T. Lv, G. Zhu, T. Chen, T. Lu, Z. Sun and C. Sun, Chem. Eng. J., 2012, 183, 238–243 CrossRef CAS PubMed.
- A. K. Zak, R. Razali, W. H. Majid and M. Darroudi, Int. J. Nanomed., 2011, 6, 1399–1403 Search PubMed.
- B. Weng, M.-Q. Yang, N. Zhang and Y.-J. Xu, J. Mater. Chem. A, 2014, 2, 9380–9389 CAS.
- A. Sadollahkhani, I. Kazeminezhad, J. Lu, O. Nur, L. Hultman and M. Willander, RSC Adv., 2014, 4, 36940–36950 RSC.
- M. Devika, N. K. Reddy and C. W. Tu, RSC Adv., 2015, 5, 2891–2899 RSC.
- M. Azarang, A. Shuhaimi, R. Yousefi and S. P. Jahromi, RSC Adv., 2015, 5, 21888–21896 RSC.
| This journal is © The Royal Society of Chemistry 2015 |

