Graphene oxide as a corrosion-inhibitive coating on magnesium alloys

Zhaozhong Qiu, Rui Wang*, Jinzhu Wu, Yushen Zhang, Yunfei Qu and Xiaohong Wu
Department of Chemistry, Harbin Institute of Technology, No. 92 West Dazhi Street, Harbin, Heilongjiang 150001, PR China. E-mail: wangrui001@hit.edu.cn; Tel: +86-15846590861

Received 3rd April 2015 , Accepted 23rd April 2015

First published on 23rd April 2015


Abstract

Graphene oxide was formed on the plasma electrolytic oxidation coatings of magnesium alloys via a self-assembly method. The graphene oxide solution was embedded into the porous structures of the coatings to reduce their porosity. The graphene oxide films acted as a physical separation, which inhibited the effects between the protected metal and corrosive media. Furthermore, the film could significantly decrease the corrosion rate compared with pristine magnesium alloy in 3.5 wt% NaCl solution.
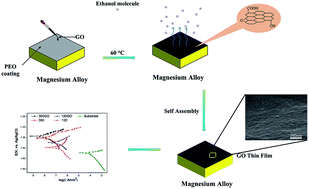

1 Introduction

Graphene, a unique two-dimensional carbon material, comprises a single layer of carbon atoms joined together by sp2 covalent bonds.1,2 It has attracted significant interest in applications such as nano-electronics,3,4 supercapacitors,5 lithium ion batteries,6 sensors,7,8 and fuel cells.9,10 Graphene is also an ideal corrosion-inhibiting material used in applications such as microelectronic components.11 The potential applications of graphene are attributed to its unique properties. First, graphene has remarkable chemical and thermal stability. Under an inert gas, it is stable at temperatures higher than 1500 °C,12–14 and it is also stable under many other conditions where other substrates would undergo rapid chemical reactions. Chen et al.15 have demonstrated that graphene can inhibit the oxidation of underlying copper metal. Second, the results16 showed that the surfaces of the sp2 carbon allotropes could form a natural diffusion barrier between the protected metal and reactants. Bunch et al.17 have found that single-atomic graphene films are impermeable to gas molecules. Thus, graphene may be adopted as an excellent candidate for the protective layer of metal. To the authors' knowledge, using graphene oxide as a passivation layer to protect the metal surfaces has not been reported to date.

In recent years, magnesium (Mg) alloys have been widely used in transport applications, such as auto construction,18 because of their low density, superior strength-to-weight ratio and easy recyclability.19,20 For example, ZK60 is the most commonly used magnesium alloy that possesses suitable mechanical properties.21 ZK60 with a naturally degradable property and the highest strength-to-weight ratio among all other metals has attracted considerable attention as a candidate for artificial human bones.22,23 However, magnesium alloys have relatively poor corrosion resistance due to their high reactivity,24–26 which limits their practical applications. The corrosion resistance of magnesium alloys remains an important issue to be addressed. Plasma electrolytic oxidation (PEO) is one of the most effective methods to enhance the corrosion and wear resistance of metals by forming a moderately thick and dense coating on the magnesium alloys.27 The PEO coating, as a barrier to the environment, can restrict the invasion of corrosive media such as Cl to effectively protect the substrate and remarkably improve the corrosion resistance of the metal. To further enhance the protective properties of the PEO coating on magnesium alloys, it is of great significance to modify the surface defects of the PEO coating. This is necessary to diminish the microcracks and micropores in the PEO coating.

One of the most versatile fabrication techniques for thin film formation is a layer-by-layer (LBL) electrostatic self-assembly through repeated and sequential immersion of a substrate into aqueous solutions of complementarily functionalized materials.28 LBL assembled films have attracted considerable attention as composite coatings either for the functionalization of surfaces with a large variety of different components or for the fabrication of electrical or optical thin film devices.29–33 Although most of the studies on LBL films are based on electrostatic interactions, the use of covalent bonds has been reported as well.34–36 These LBL multilayers display promising characteristics for the preparation of light-emitting diodes,37 sensors,38 conductive films,39 non-linear optical devices,40 and membrane materials.41 Furthermore, the application of the LBL approach for the formation of anticorrosion systems has also been reported.42–47 Recently, owing to its prominent advantages, such as simplicity, universality, and controllability on the thickness at the nanoscale level, LBL self-assembly technique has been used to fabricate graphene-based multilayers.48

Herein, we have demonstrated that graphene oxide (GO) film can be fabricated using self-assembly technology on magnesium alloy after the PEO process, which effectively inhibits the corrosion rate. In this study, before the GO coating, the magnesium alloy was treated with PEO for 120 s and 360 s (marked as 120 and 360). In this study, we have demonstrated the feasibility of drop-casting graphene oxide films onto the surfaces of magnesium alloy using the hydrogen bonded self-assembly technology, which provides a protection against surface corrosion.

2 Experimental

2.1 Preparation of PEO coatings

Rectangular coupons (25 × 20 × 5 mm2) of ZK60 magnesium alloy (mass fraction: Zn 5 wt%, Zr 0.3 wt%, Mn 0.1 wt% and balance Mg, Northeast light alloy Co., LTD.) were used as the substrate material in this study. They were abraded with 180, 600, 1000 and 2000 grit emery sheets and then cleaned with acetone before the PEO treatment. A homemade-pulsed bipolar electrical source with a power of 5 kW was used for the PEO in a water-cooled electrobath made of stainless steel, which also served as the counter electrode. The reaction temperature of the electrolytes during the processing was maintained at 20 ± 5 °C by adjusting the flow of the cooling water. An aqueous electrolyte was prepared from a solution of sodium silicate (Na2SiO3·9H2O, 20 g L−1, Beijing Yili Fine Chemicals Co., Led.), potassium hydroxide (KOH, 7 g L−1, Beijing Yili Fine Chemicals Co., Led.) and sodium fluoride (NaF, 1 g L−1, Beijing Yili Fine Chemicals Co., Led.). The duty ratios of the pulses were equal to 10%. The electronic power frequency was fixed at 1000 Hz. The applied current density was 60 A cm−2. After the PEO treatment, the samples were rinsed with deionized water and dried in the air.

2.2 Preparation of GO

Graphene oxide (GO) was synthesized using the modified Hummers method through the acid oxidation of expandable graphite (Jiangsu TianRun electronic material Co., LTD.).49 Typically, 5 g of natural graphite powder was placed into 150 mL of concentrated H2SO4 and 13.9 mL of concentrated H3PO4 at 0 °C. Subsequently, 15 g of KMnO4 was added gradually and the temperature of the solution was controlled below 15 °C. The mixture was stirred for 2 h at 35 ± 1 °C and then added into 380 mL of distilled water, and the resulting mixture was refluxed for 120 min. Subsequently, 1300 mL of H2O2 solution (1.8 wt%) was added. The primary product was suspended in water under ultrasonication for 24 h and the mixture was then filtered and washed with an aqueous solution of HCl (5 wt%) and distilled water until sulfate could not be detected with BaCl2. Finally, the resulting solution was centrifuged to retrieve the GO. The obtained supernatant was dried via evaporation of water under vacuum. To investigate the size of the GO flakes, transmission electron microscopy (TEM) images of the exfoliated graphene oxide sheets were obtained with lateral dimensions of hundreds of nanometers, as shown in Fig. 1a.
image file: c5ra05974g-f1.tif
Fig. 1 TEM images of GO: (a) graphene oxide sheets and (b) few-layer GO sheets.

2.3 Preparation of size-selected GO suspensions and preparation of PEO-GO films

The small-size GO sheets are prone to form thin films, which possess a perfect compact structure by layer-by-layer self-assembly technology. The dense GO film will be more effective to restrict the invasion of corrosive Cl ions. To prepare size-selected GO suspensions, the GO sample obtained from the heavy oxygenation was subjected to a size fractionation process involving high-speed centrifugation and successive ultrafiltration.50 First, 15 mg of GO was dispersed in 100 mL ethanol (75 wt%) and vigorously disrupted under ultrasonication for 4 h. The dispersion was then subjected to high-speed centrifugation for 5 min, which resulted in the sedimentation of roughly 50 wt% of the original sample and transformation of the dispersion color from black to faint black. The upper supernatant, which should contain single and few-layer GO flakes of relatively small sizes, was then collected and filtered successively using ultrafiltration membranes (Fig. 1b). Finally, the suspensions were allowed to stand for a certain period of time to obtain supernatant liquor for the fabrication of the GO films. GO was deposited on the magnesium alloy substrates by dip coating technology and subsequent temperature controlled drying of the film. The thickness of the film was tuned by changing the temperature of the GO dispersion as well as the dipping times. The hydrogen bonded layer-by-layer (LBL) assembling process was performed (schematically shown in Fig. 2).
image file: c5ra05974g-f2.tif
Fig. 2 Schematic illustration of the standard GO thin film preparation procedure.

2.4 Characterization of the samples

The phase composition of the PEO coating was investigated by X-ray diffraction (XRD) using Cu-Kα radiation (D/max-rB, λ = 1.54). The surface morphology of the as-prepared coating was characterized using scanning electron microscopy (SEM; Hitachi S-8010, 10 keV) and transmission electron microscopy (TEM, Hitachi, JEM-2100, 200 keV). Raman spectra of the samples were obtained using a Renishaw microspectrometer with an excitation wavelength of 633 nm.

2.5 Electrochemical measurements of the materials

Electrochemical impedance spectroscopy (EIS) and potentiodynamic polarization experiments were performed using a Princeton-4000 electrochemical analyzer. Potentiodynamic polarization curves were used to analyze the corrosive nature of the PEO and PEO-GO coatings prepared under different oxidation times during immersion in 3.5 wt% NaCl solution. Each sample was mounted on paraffin with 1 cm2 of its surface exposed. Corrosion potential and corrosion current density were obtained through the linear analysis of Tafel approximation. The signal amplitude of the EIS was 20 mV over a frequency range between 0.01 Hz and 10 kHz. Potentiodynamic polarization tests were performed at a scan rate of 1 mV s−1 with a scanning range from −150 mV to 150 mV of open circuit potential. All the electrochemical measurements were performed with a conventional three electrode system composed of the coated samples as the working electrode, a platinum plate as the auxiliary electrode and Ag/AgCl (sat. KCl) as the reference electrode. All the experiments were carried out at 23 ± 2 °C and standard atmospheric pressure.

3 Results and discussion

3.1 Characterization of the samples

The chemical composition of the as-prepared materials was determined using XRD, as shown in Fig. 3. The XRD pattern of the graphene oxide sheets displays a larger interlayer spacing than that of graphite, i.e., a major peak of GO at 10.56° corresponding to an interlayer spacing of 8.37 Å compared with a major peak of graphite at 26.63° from (002) corresponding to 3.34 Å. This phenomenon was probably due to the functional oxygen groups of GO as well as water molecules absorbed in the interlayer galleries of hydrophilic GO.51
image file: c5ra05974g-f3.tif
Fig. 3 X-ray diffraction pattern of the samples: (a) PEO-GO coating, (b) PEO, and (c) graphite.

The XRD pattern of the oxide coating formed is displayed in Fig. 3b. It is apparent that the PEO coating was mainly constituted with MgO, MgSiO3 and Mg2SiO4 phases. Fig. 4 shows a schematic illustration of the standard PEO coating preparation procedure used in this study. In the initial stage, the voltage increases evidently with time and there are no sparks, but only some tiny oxygen bubbles (reaction (1)) exist on the sample surface (anode), which indicates that the magnesium alloy substrate begins to dissolve (reaction (2)) and forms a thin passive film on the surface.

 
4OH → 2H2O + O2 + 4e (1)
 
Mg → Mg2+ + 2e (2)


image file: c5ra05974g-f4.tif
Fig. 4 Schematic illustration of the standard PEO coating preparation procedure.

With the effects of anodic voltage, an anionic coacervate was formed at the magnesium/electrolyte solution boundary. The thickness of coacervate rises with an increase in voltage. When sufficient amount of magnesium ions accumulate at the magnesium/electrolyte interface, the magnesium ions combine with SiO32− and OH to form MgSiO3, Mg(OH)2 and Mg2SiO4 in the coacervate solution. The interface reaction can be described as follows:

 
Mg2+ + 2OH → Mg(OH)2 (3)
 
Mg2+ + SiO32− → MgSiO3 (4)
 
2Mg2+ + SiO32− + 2OH → Mg2SiO4 + H2O (5)
 
Mg(OH)2 → MgO + H2O (6)

Sharma52 et al. reported that the dehydration reaction is thermodynamically endothermic. Because the instantaneous temperature in the micro-area is higher than 1000 °C,53 Mg(OH)2 in the oxide film can be decomposed into MgO and H2O.54

Fig. 5 shows the Raman spectra of the graphite and GO. The Raman spectrum of graphite demonstrates bands at ∼1370, ∼1583, ∼1620, ∼2700, and ∼3200 cm−1, designated as D, G, D′, G′, and D′′, respectively, which are in good agreement with the literature.55 The Raman spectrum of the as-deposited GO film shows a D-band at 1337 cm−1 and a broad G-band at 1600 cm−1.56 The prominent D peak may be attributed to the structural imperfections due to the attachment of hydroxyl and epoxide groups on the carbon basal plane.57 The spectrum of GO shows a shift in the G band to a higher wavenumber as compared with that of graphite. This shift was attributed to three different reasons:55 (i) overlapping of the G band with the D′ band becomes active due to the defects; (ii) the presence of isolated double bonds separated by the functional groups on the carbon network of GO; and (iii) a reduced number of sheets. For comparison, the Raman spectroscopy of graphite was also recorded (red line); the D/G intensity ratios of graphite and GO were calculated to be 0.69 and 1.37, respectively. The I(D)/I(G) intensity ratio was increased, suggesting a possible decrease in the average size of the sp2 domains. This can be explained by the fact that the graphene oxide domains created are smaller than that of graphite.57


image file: c5ra05974g-f5.tif
Fig. 5 Raman spectra (633 nm laser wavelength) of graphite and graphene oxide.

The TEM image of GO at low magnification is shown in Fig. 6a. As shown in the figure, sheet-like GO with numerous folds at the edges can be observed. TEM analysis was used to elucidate the structure of GO. An individual GO sheet exhibits a homogeneous and peculiar morphology with scrolling edges. A selected area electron diffraction (SAED) pattern of the monolayer region of the GO film is presented in Fig. 6b. Strikingly, ambiguous diffraction spots were observed to identify the crystalline order; a 6-fold pattern was consistent with a hexagonal lattice and the spots are labeled accordingly (2[1 with combining macron][1 with combining macron]0, 1[1 with combining macron]00, 0[1 with combining macron]10, [1 with combining macron][1 with combining macron]20) using the Miller-Bravais hkil notation.58


image file: c5ra05974g-f6.tif
Fig. 6 TEM results obtained for GO: (a) TEM image of GO and (b) the associated SAED pattern.

The poorly-defined diffraction rings in the SAED pattern illustrates that the crystalline state of the GO film is not completely amorphous, unlike graphene or graphite with well-defined diffraction spots in SAED. This finding further unambiguously confirms that there are some defects in the GO films. Moreover, the lack of characteristic diffraction spots corresponding to the graphite structure59 indicates that the oxygen-containing functional groups do not form super-lattice type ordered arrays,58 which is in good agreement with the abovementioned Raman analysis. The GO sheet consisting of oxygen-containing functional groups (hydroxyl and epoxide) on the carbon basal plane is a prerequisite to assemble the GO film through hydrogen bonding interactions.

Fig. 7 displays the surface morphologies of the PEO and PEO-GO composite coating obtained under different oxidation times. The surface of the PEO coating contains few micro pores and some micro cracks. Comparing Fig. 7a and c, it can be seen that pores with different shapes are distributed throughout the surface. With increasing oxidation time, the amount of pores is decreased, while the average diameter of the pores is considerably increased. In addition, the craters that occurred on the surfaces were due to the discharge energy through the channels during the PEO process and oxygen bubbles generated by the decomposition of OH (ref. 60) during the anodic electrode reaction (2) via micro-arc discharge channels.61 It should be noted that there were numerous micro-cracks on the surface (Fig. 7c), which could be due to thermal stress from the rapid solidification of molten oxide triggered by the electrolyte as a coolant. Moreover, the lower Pilling–Bedworth ratio (PBR) of magnesia (PBR is the ratio of the volume of the elementary cell of a metal oxide to the volume of the elementary cell of the corresponding metal) was also a main reason for the damage of the PEO coating on the magnesium alloys.62 The increased oxidation time results in an enhanced thickness of the coating and increased single pulse energy. The latter resulted in enlarged pore sizes after the discharged channels were cooled. As the discharge intensity was continuously increased, the amount of accumulated oxide was increased, inducing a gradual enlargement of grain size and overlapping of the nearby pores.


image file: c5ra05974g-f7.tif
Fig. 7 Surface of PEO and PEO-GO coatings on ZK60 alloy at different oxidation times: (a) 120PEO, (b) 120GO, (c) 360PEO, and (d) 360GO, (the inset figure is the corresponding magnified SEM image).

Several distinct vibrational modes of oxygen functionalities can be readily identified on the basal plane, namely, epoxides, carboxyl groups, carbonyls and hydroxyl, as a result of a high concentration of hydroxyl groups as well as stronger hydrogen bonding interactions between OH and other oxygen functionalities in close proximity.63 In the early neutron scattering studies,64–68 it has been confirmed that water is strongly bound to the basal plane of GO through hydrogen bonding interactions with the oxygen in the epoxides of GO (as shown in Fig. 8).


image file: c5ra05974g-f8.tif
Fig. 8 Proposed hydrogen bonding network formed between the oxygen functionality on GO and water, and a schematic illustration of the GO thin film reducing the porosity of PEO.

The hydrogen-bonded dimers present in the GO/ethanol solution are not separated during the adsorption process, and interlayer hydrogen bonding leads to stable multilayers. Therefore, the multilayers were formed on the PEO surfaces by the layer-by-layer hydrogen bonded assembly of GO sheets from the aqueous solution. The graphene oxide sheets assembled together to generate the graphene oxide films through hydrogen bonding interactions with the oxygen in the epoxides of the GO. Consequently, the graphene oxide solution can be dispersed completely and embedded into the porous structures to form the GO film. The surface micrographs of 120GO (Fig. 7b) and 360GO (Fig. 7d) show that the micro pores and cracks of the PEO coating disappeared after dip casting for three cycles. GO can be viewed as graphene with oxygen functional groups decorated on the basal plane and edges.69 In GO, the majority of carbon atoms bonded with oxygen are sp3 hybridized, which disrupts the extended sp2 conjugated network of the original graphene sheet. GO generates various types of defects in the graphene lattice, which blocks the electron transport and renders it electrically insulating.70 The GO film with the insulating properties can decrease the electron transport and improve the corrosion resistance of the metal.

Fig. 9 shows the cross-section images of the coatings obtained at different times. The coatings exhibit the characteristic structural properties of the PEO coating, namely, the inner layer and outer layer.71 The inner layer of the coating is compact, whereas the outer layer is relatively loose. The corrosion protection performance of the PEO coatings was directly dependent on the thickness, uniformity, density of pores and others defects. A prolonged treatment time decreased the amount of the pores, but markedly increased the thickness of the coating, which could slow down the penetration rate of the electrolyte into the PEO coating. The coating was homogeneous with an average thickness of about 9 μm for an oxidation time of 120 s and 17 μm for 360 s (Fig. 9a and c). No fracture sites appeared on the interface between the coating and substrate, indicating satisfactory adhesion. The thickness of the GO film was between 4–6 μm (Fig. 9b and d) after dip casting for 3 times, suggesting that the GO film was uniform. In the cross-section of 360GO, the pores were filled with GO, which would lead to a decrease in the contact area between the coating and the corrosion media.


image file: c5ra05974g-f9.tif
Fig. 9 Cross-sectional morphologies of the PEO and PEO-GO coatings on ZK60 alloy at different oxidation times: (a) 120PEO, (b) 120GO, (c) 360PEO, and (d) 360GO.

3.2 Electrochemical properties of the samples

Open circuit potential (OCP) as a function of immersion time was evaluated to explore the chemical stability and corrosion process of the surface layers on the magnesium alloy.72 The curves of OCP versus immersion time in 3.5 wt% NaCl solution for the 120GO and 360GO specimens are shown in Fig. 10. It can be seen that in the initial stages of immersion, it is difficult for the 120GO and 360GO films to establish stable corrosion conditions because water and the electrolyte penetrated and/or diffused through the GO film. The OCP of the 120GO film dropped rapidly and fluctuated within a wide range from −1.5 V to −1.3 V (vs. Ag/AgCl) during 0-35 h of exposure period during the corrosion process. It can be noticed that the OCP of the 360GO film displayed a relatively more positive potential and a fluctuation stage in the initial process of immersion. Graphene oxide is generated by the oxidation of graphite, which contains a wide range of oxygen functional groups73 and possesses repulsive electrostatic interactions at the edges of the platelets74 to make the GO hydrophilic. As a result, the GO film could dissolve in the electrolyte solution and be penetrated by the corrosive intermediate. As the GO coating was damaged, the corrosion of the PEO coating was obvious, which results in the fluctuation of the OCP with immersion time. After 40 h of immersion, the OCP gets stabilized, which is indicated by no significant drift in the OCP towards the active side. This finding indicated that the PEO coating could effectively protect the magnesium alloy substrate.
image file: c5ra05974g-f10.tif
Fig. 10 Open circuit potential vs. immersion time in 3.5 wt% NaCl solution: (a) 120GO and (b) 360GO.

From the equivalent circuit, the impedance of the measured system between the reference electrode (Ag/AgCl (sat. KCl)) and the working electrode (PEO coating and PEO-GO coating) consisted of three parts. The equivalent circuits75,76 (shown in Fig. 11a) consists of the solution resistance (Rs) and two constant phase elements (CPE) of the coating, namely, the outer porous layer resistance (Rp) of the PEO coating in parallel with the constant phase element Qp and the inner compact layer resistance (Rb) of the PEO coating in parallel with Qb. The two constant phase elements of the coating are also shown in Fig. 11b,77 where the solution resistance (Rs), the GO film resistance (RGO) in parallel with the constant phase element (CPE) QGO and the plasma electrolytic oxidation resistance (RPEO) of the PEO coating in parallel with QPEO are demonstrated.


image file: c5ra05974g-f11.tif
Fig. 11 Equivalent circuit related to the EIS plots of the coating in 0.1 M NaCl solution: (a) PEO and (b) PEO-GO.

With the Nyquist plots based on the equivalent circuit model, displayed in Fig. 12, an excellent fit was achieved between the experimental data and iterated results. The results of the fitting parameters of the simulative EIS spectra are presented in Table 1. We could draw a conclusion from the EIS results that the corrosion resistance of the PEO coatings was increased significantly after the self-assembly GO treatment due to the formation of graphene oxide layers on the substrate.


image file: c5ra05974g-f12.tif
Fig. 12 Nyquist plots and fitting results (solid line) for the electrochemical impedance spectra of PEO and PEO-GO in 3.5 wt% NaCl solution: (a) Nyquist, (b) and (c) bode plots.
Table 1 Fitting results of the EIS plots for the PEO-GO and PEO coatings on Zk60 magnesium alloy in 0.1 M NaCl solution
Sample Rs (Ω cm2) Qp (μΩ−1 cm−2 sn1) n1 Rp (kΩ cm2) Qi (μΩ−1 cm−2 sn2) n2 Ri (kΩ cm2)
120 7.65 0.275 0.83 4.53 0.670 0.72 287
360 4.13 0.271 0.94 24.0 0.619 0.66 698

Sample Rs (Ω cm2) QGO (μΩ−1 cm−2 sn1) n1 RGO (kΩ cm2) QPEO (μΩ−1 cm−2 sn2) n2 RPEO (kΩ cm2)
120GO 5.98 0.0271 0.91 9.34 1.06 0.60 378
360GO 1.36 0.0340 0.92 8.76 0.914 0.62 853


The fitting results also show that the polarization resistance (RPEO + RGO) of 120GO reaches up to 0.387 MΩ cm2 as compared to 0.291 MΩ cm2 of 120PEO. In addition, the sum of resistance for the PEO coating (RPEO) and GO film (RGO) of 360GO was 0.861 MΩ cm2 as compared to 0.712 MΩ cm2 of 360PEO. The different EIS behavior (corrosion resistance) of the PEO and PEO-GO coatings was attributed to their unique properties. The GO films reduced the porosity of the PEO and enhanced the corrosion resistance of the substrate. It also acted as a barrier to the electrolyte; thus, the invasion of corrosive media was prohibited, which enhanced the corrosion resistance of the magnesium alloy.

The potentiodynamic polarization curves for the coatings and the bare sample in 3.5 wt% NaCl solution are shown in Fig. 13, and the associated electrochemical data are listed in Table 2. All the data clearly indicates that the corrosion resistances of these samples with and without GO coatings are obviously different. The bare sample exhibits a corrosion current density of 0.105 mA cm−2 and an associated corrosion potential of −1.57 V vs. Ag/AgCl.


image file: c5ra05974g-f13.tif
Fig. 13 Potentiodynamic polarization behavior of PEO and PEO-GO coatings on ZK60 alloy in 3.5 wt% NaCl solution for different immersion time: (a) 0 days and (b) 7 days.
Table 2 Electrochemical data from the polarization tests for the PEO and PEO-GO coatings on ZK60 alloy in 3.5 wt% NaCl solution at different oxidation times (without immersion)
Sample Ecorr (V vs. Ag/AgCl) icorr (nA cm−2) βc (mV dec−1) βa (mV dec−1) Corrosion rate (μm y−1)
120 −1.49 728.1 −460.81 425.24 161.91
120GO −1.42 226.9 −167.89 114.24 50.48
360 −1.35 67.2 −281.00 196.28 14.95
360GO −1.33 14.5 −126.03 123.96 3.22
Substrate −1.57 105[thin space (1/6-em)]000 −198.95 34.98 2352


In contrast with the PEO coatings prepared under different oxidation times, the performance of the composite coating of PEO-GO exhibited a more positive corrosion potential and lower corrosion current density, which indicates that the corrosion resistance of ZK60 is significantly improved by the GO treatment. The corrosion potential of the coatings increased and the corrosion current density of the composite film reduced to 14.5 nA cm−2 compared with the PEO coating of ZK60 after 360 s (67.2 nA cm−2). Therefore, the GO sheets deposited on the substrates (PEO coating) significantly reduced the corrosion rate of the magnesium alloy.

The corrosion behavior of these coatings evaluated by the potentiodynamic polarization technique in 3.5 wt% NaCl solution after 7 days immersion is illustrated in Fig. 13b. The corresponding corrosion potential (Ecorr) and the corrosion current density (icorr) data are summarized in Table 3. The specimen (360PEO) has a corrosion potential of −1.35 V vs. Ag/AgCl after 7 days of exposure to the electrolyte, suggesting that there is not much degradation. For the 360GO coating, the corrosion current density (0.29 μA cm−2) measured after 7 days of immersion was almost one order of magnitude lower than that for the 360PEO coating (1.33 μA cm−2). The 120GO specimen exhibits a similar behavior. The values of the corrosion potential and corrosion current density are −1.41 V vs. Ag/AgCl and 1.99 μA cm−2, and for the 120PEO sample, the values are −1.46 V vs. Ag/AgCl and 11.93 μA cm−2, respectively.

Table 3 Electrochemical data from the polarization tests for the PEO and PEO-GO coatings on ZK60 alloy after immersion for 7 days in 3.5 wt% NaCl solution at different oxidation times
Sample Ecorr (V vs. Ag/AgCl) icorr (μA cm−2) βc (mV dec−1) βa (mV dec−1) Corrosion rate (μm y−1)
120-7d −1.46 11.93 −463.34 638.83 229.49
120GO-7d −1.41 1.99 −300.17 212.87 50.18
360-7d −1.35 1.33 −236.42 222.34 27.97
360GO-7d −1.39 0.29 −238.80 115.59 8.06
Substrate −1.57 105 −198.95 34.978 2352


The polarization curves for the GO coated samples display a sharp decrease in the anodic reaction rates, indicating that the GO film was providing protection to the underlying surface. It also reveals a decrease in the corrosion current density (icorr) and that the corrosion potential (Ecorr) shifted in the positive direction. This may be indicate that the GO film is acting primarily as an ionic barrier to the underlying Mg surface. The dominant aspect that leads to a decrease in the corrosion rate is the reduction in the kinetics of metallic ionization. The polarization curves for the graphene oxide coated samples display a decrease in the rate of the cathodic reactions. In this case, the GO film may be acting primarily as an inhibitor of the cathodic reaction (Fig. 14).78


image file: c5ra05974g-f14.tif
Fig. 14 Corrosion rates of the samples in 3.5 wt% NaCl solution obtained using the Tafel extrapolation technique for different immersion time: (a) 0 days and (b) 7 days.

As is well known, the anticorrosion mechanism provided by graphene oxide can be explained by a combination of four processes.79 First, GO coatings can make the path of permeating water more tortuous. Second, the GO coating may be used as an inhibitor in protective coatings to prevent the corrosion of the underlying metals in a corrosive medium for longer periods. Third, when functionalized graphene oxide is embedded in the coating, it can diminish the microcracks and micropores of the PEO coating to decrease the corrosive area. Finally, GO is known as a poor conducting material (∼0.021 S cm−1)80 and has a lower conductivity than the Mg alloy (∼107 S cm−1). When corrosion starts at the Mg/PEO@GO coating interface, the electrons generated by the anodic reaction move to a cathodic site and complete the corrosion reaction. Because of the lower conductivity of GO as compared to that of the Mg alloy, it may be difficult for the electrons to reach the cathodic site. This is the reason that GO can provide protection against the surface corrosion. Furthermore, GO is a very electron-rich material with sp2 hybridized carbon atoms81,82 and can possibly behave like a form of cathodic protection against the oxidation of the metal surface. The cyclic voltammograms for the reduction of GO show a large cathodic peak at −1.45 V in the first cycle with a starting potential of −0.8 V, which can be attributed to the reduction of the functional groups in the GO sheets such as –OH, −COOH and epoxides.83 The Raman spectrum of GO after reduction showed an increased D/G intensity ratio, which suggested a decrease in the size of the sp2 domains and a partially ordered crystal structure of graphene.84,85 In addition, the electrochemical reduction of GO was quick and not reversible. Because of the impermeability of graphene, the GO film after reduction acts as an excellent barrier to water, oxygen and other corrosive materials.11,15,86–88 Thus, graphene oxide is an excellent candidate as a protective layer of metal.

4 Conclusions

In summary, this study has demonstrated the corrosion resistance performance of GO films prepared using a layer-by-layer hydrogen bonded self-assembly method. GO with a decreased corrosion rate acted as a corrosion-inhibitive coating and offered a physical separation between the protected magnesium alloy and corrosion media. The corrosion current density of the composite film (360GO) was decreased to 14.5 nA cm−2 compared with the bare sample, 0.105 mA cm−2, in 3.5 wt% NaCl solution. The corrosion current density of the 360GO coating was 0.29 μA cm−2 after 7 days of immersion, which suggests that there was less degradation. Therefore, it can be concluded that the GO film can effectively improve the corrosion resistance of ZK60. Furthermore, GO films can be adapted to a large variety of surfaces with complex functionalities or architectures. Although GO film is still expensive, it can be an effective alternative to existing protective films.

Acknowledgements

This work was financially supported by the National Natural Science Foundation of China (no. 11374080).

References

  1. A. C. Neto, F. Guinea, N. M. R. Peres, K. S. Novoselov and A. K. Geim, Rev. Mod. Phys., 2009, 81, 109–166 CrossRef.
  2. D. B. Shinde, J. Debgupta, A. Kushwaha, M. Aslam and V. K. Pillai, J. Am. Chem. Soc., 2011, 133, 4168–4171 CrossRef CAS PubMed.
  3. Y. W. Son, M. L. Cohen and S. G. Louie, Nature, 2006, 444, 347–349 CrossRef CAS PubMed.
  4. P. Avouris, Z. Chen and V. Perebeinos, Nat. Nanotechnol., 2007, 2, 605–615 CrossRef CAS PubMed.
  5. K. S. Kim, Y. Zhao, H. Jang, S. Y. Lee, J. M. Kim, K. S. Kim and B. H. Hong, Nature, 2009, 457, 706–710 CrossRef CAS PubMed.
  6. E. J. Yoo, J. Kim, E. Hosono, H. S. Zhou, T. Kudo and I. Honma, Nano Lett., 2008, 8, 2277–2282 CrossRef CAS PubMed.
  7. Y. Shao, J. Wang, H. Wu, J. Liu, I. A. Aksay and Y. Lin, Electroanalysis, 2010, 22, 1027–1036 CrossRef CAS PubMed.
  8. S. Alwarappan, S. Boyapalle, A. Kumar, C. Z. Li and S. Mohapatra, J. Phys. Chem. C, 2012, 116, 6556–6559 CAS.
  9. X. Wang, L. Zhi and K. Müllen, Nano Lett., 2008, 8, 323–327 CrossRef CAS PubMed.
  10. L. Qu, Y. Liu, J. B. Baek and L. Dai, ACS Nano, 2010, 4, 1321–1326 CrossRef CAS PubMed.
  11. D. Prasai, J. C. Tuberquia, R. R. Harl, G. K. Jennings and K. I. Bolotin, ACS Nano, 2012, 6, 1102–1108 CrossRef CAS PubMed.
  12. W. A. de Heer, C. Berger, X. Wu, P. N. First, E. H. Conrad, X. Li and G. Martinez, Solid State Commun., 2007, 143, 92–100 CrossRef CAS PubMed.
  13. J. Hass, F. Varchon, J. E. Millan-Otoya, M. Sprinkle, N. Sharma, W. A. de Heer, C. Berger, P. N. First, L. Magaud and E. H. Conrad, Phys. Rev. Lett., 2008, 100, 125504 CrossRef CAS.
  14. S. Shivaraman, M. V. S. Chandrashekhar, J. J. Boeckl and M. G. Spencer, J. Electron. Mater., 2009, 38, 725–730 CrossRef CAS.
  15. S. Chen, L. Brown, M. Levendorf, W. Cai, S. Y. Ju, J. Edgeworth and R. S. Ruoff, ACS Nano, 2011, 5, 1321–1327 CrossRef CAS PubMed.
  16. J. K. Holt, H. G. Park, Y. M. Wang, M. Stadermann, A. B. Artyukhin, C. P. Grigoropoulos, A. Noy and O. Bakajin, Science, 2006, 312, 1034–1037 CrossRef CAS PubMed.
  17. J. S. Bunch, S. S. Verbridge, J. S. Alden, A. M. van der Zande, J. M. Parpia, H. G. Craighead and P. L. Mceuen, Nano Lett., 2008, 8, 2458–2462 CrossRef CAS PubMed.
  18. Z. Shi, M. Liu and A. Atrens, Corros. Sci., 2010, 52, 579–588 CrossRef CAS PubMed.
  19. M. F. He, L. Liu, Y. T. Wu, Z. X. Tang and W. B. Hu, Corros. Sci., 2008, 50, 3267–3273 CrossRef CAS PubMed.
  20. J. E. Gray and B. Luan, J. Alloys Compd., 2002, 336, 88–133 CrossRef CAS.
  21. A. Bussiba, A. A. Ben, A. Shtechman, S. Ifergan and M. Kupiec, Mater. Sci. Eng., A, 2001, 302, 56–62 CrossRef.
  22. X. H. Wu, P. B. Su, Z. H. Jiang and S. Meng, ACS Appl. Mater. Interfaces, 2010, 2, 808–812 CAS.
  23. M. I. Jamesh, G. Wu, Y. Zhao, D. R. McKenzie, M. M. Bilek and P. K. Chu, Corros. Sci., 2014, 82, 7–26 CrossRef CAS PubMed.
  24. G. L. Makar and J. Kruger, Int. Mater. Rev., 1993, 38, 138–153 CrossRef CAS PubMed.
  25. X. B. Chen, N. Birbilis and T. B. Abbott, Corros. Sci., 2012, 55, 226–232 CrossRef CAS PubMed.
  26. G. Song and A. Atrens, Adv. Eng. Mater., 2007, 9, 177–183 CrossRef CAS PubMed.
  27. J. Liang, P. B. Srinivasan, C. blawert, M. Stormer and W. Dietzel, Electrochim. Acta, 2009, 54, 3842–3850 CrossRef CAS PubMed.
  28. D. Yu and L. Dai, J. Phys. Chem. Lett., 2010, 1, 467–470 CrossRef CAS.
  29. G. Decher, Science, 1997, 277, 1232–1237 CrossRef CAS.
  30. G. Decher, M. Eckle, J. Schmitt and B. Struth, Curr. Opin. Colloid Interface Sci., 1998, 3, 32 CrossRef CAS.
  31. Z. Tang, Y. Wang, P. Podsiadlo and N. A. Kotov, Adv. Mater., 2006, 18, 3203–3224 CrossRef CAS PubMed.
  32. A. A. Mamedov, N. A. Kotov, M. Prato, D. M. Guldi, J. P. Wicksted and A. Hirsch, Nat. Mater., 2002, 1, 190–194 CrossRef CAS PubMed.
  33. Z. Tang, N. A. Kotov, S. Magonov and B. Ozturk, Nat. Mater., 2003, 2, 413–418 CrossRef CAS PubMed.
  34. N. Cini, T. Tulun, G. Decher and V. Ball, J. Am. Chem. Soc., 2010, 132, 8264–8265 CrossRef CAS PubMed.
  35. S. S. Qureshi, Z. Zheng, M. I. Sarwar, O. Fálix and G. Decher, ACS Nano, 2013, 7, 9336–9344 CrossRef CAS PubMed.
  36. R. Gill, M. Mazhar, O. Félix and G. Decher, Angew. Chem., Int. Ed., 2010, 49, 6116–6119 CrossRef CAS PubMed.
  37. W. K. Bae, J. Kwak, J. Lim, D. Lee, M. K. Nam, K. Char and S. Lee, Nano Lett., 2010, 10, 2368–2373 CrossRef CAS PubMed.
  38. E. G. R. Fernandes, L. C. Brazaca, M. L. Rodríguez-Mendez, J. A. D. Saja and V. Zucolotto, Biosens. Bioelectron., 2011, 26, 4715–4719 CrossRef CAS PubMed.
  39. M. K. Gheith, T. C. Pappas, A. V. Liopo, V. A. Sinani, B. S. Shim, M. Motamedi and N. A. Kotov, Adv. Mater., 2006, 18, 2975–2979 CrossRef CAS PubMed.
  40. K. E. Van Cott, M. Guzy, P. Neyman, C. Brands, J. R. Heflin, H. W. Gibson and R. M. Davis, Angew. Chem., Int. Ed., 2002, 41, 3236–3238 CrossRef CAS.
  41. N. A. Kotov, S. Magonov and E. Tropsha, Chem. Mater., 1998, 10, 886–895 CrossRef CAS.
  42. D. G. Shchukin, M. Zheludkevich, K. Yasakau, S. Lamaka, M. G. Ferreira and H. Moehwald, Adv. Mater., 2006, 18, 1672–1678 CrossRef CAS PubMed.
  43. D. G. Shchukin and H. Möhwald, Adv. Funct. Mater., 2007, 17, 1451–1458 CrossRef CAS PubMed.
  44. N. A. Kotov, T. Haraszti, L. Turi, G. Zavala, R. E. Geer, I. Dekany and J. H. Fendler, J. Am. Chem. Soc., 1997, 119, 6821–6832 CrossRef CAS.
  45. D. G. Shchukin, M. Zheludkevich, K. Yasakau, S. Lamaka, M. G. Ferreira and H. Moehwald, Adv. Mater., 2006, 18, 1672–1678 CrossRef CAS PubMed.
  46. E. Abdullayev, D. Shchukin and Y. Lvov, Polym. Mater. Sci. Eng., 2008, 99, 331–332 CAS.
  47. M. L. Zheludkevich, D. G. Shchukin, K. A. Yasakau, H. Möhwald and M. G. Ferreira, Chem. Mater., 2007, 19, 402–411 CrossRef CAS.
  48. H. Chen, M. B. Muller, K. J. Gilmore, G. G. Wallace and D. Li, Adv. Mater., 2008, 20, 3557–3561 CrossRef CAS PubMed.
  49. J. Zhu, D. Wang, L. Wang, X. Lang and W. You, Electrochim. Acta, 2013, 91, 323–329 CrossRef CAS PubMed.
  50. B. Zhang, L. Fan, H. Zhong, Y. Liu and S. Chen, J. Am. Chem. Soc., 2013, 135, 10073–10080 CrossRef CAS PubMed.
  51. A. Buchsteiner, A. Lerf and J. Pieper, J. Phys. Chem. B, 2006, 110, 22328–22338 CrossRef CAS PubMed.
  52. A. K. Sharma, R. U. Rani and S. M. Mayanna, Thermochim. Acta, 2001, 37, 67–75 CrossRef.
  53. Y. Zhang, C. Yan, F. Wang and W. Li, Corros. Sci., 2005, 47, 2816–2831 CrossRef CAS PubMed.
  54. R. F. Zhang and S. Zhang, Corros. Sci., 2009, 51, 2820–2825 CrossRef CAS PubMed.
  55. G. K. Ramesha and S. Sampath, J. Phys. Chem. C, 2009, 113, 7985–7989 CAS.
  56. K. N. Kudin, B. Ozbas, H. C. Schniepp, R. K. Prudhomme, I. A. Aksay and R. Car, Nano Lett., 2008, 8, 36–41 CrossRef CAS PubMed.
  57. D. Yang, A. Velamakanni, G. Bozoklu, S. Park, M. Stoller, R. D. Piner, S. Stankovich, I. Jung, D. A. Field, J. C. A. Ventrice and R. S. Ruoff, Carbon, 2009, 47, 145–152 CrossRef CAS PubMed.
  58. N. R. Wilson, P. A. Pandey, R. Beanland, R. J. Young, I. A. Kinloch, L. Gong, Z. Liu, K. Suenaga, J. P. Rourke, S. J. York and J. Sloan, ACS Nano, 2009, 3, 2547–2556 CrossRef CAS PubMed.
  59. Q. M. Su, L. Chang, J. Zhang, G. H. Du and B. S. Xu, J. Phys. Chem. C, 2013, 117, 4292–4298 CAS.
  60. A. K. Vijh, Corros. Sci., 1971, 11, 411–417 CrossRef CAS.
  61. A. K. Sharma, R. U. Rani, A. Malek, K. S. N. Acharya, M. Muddu and S. Kumar, Met. Finish., 1996, 94, 16–27 CrossRef CAS.
  62. X. Zhou, G. E. Thompson, P. Skeldon, G. C. Wood, K. Shimizu and H. Habazaki, Corros. Sci., 1999, 41, 1599–1613 CrossRef CAS.
  63. M. Acik, C. Mattevi, C. Gong, G. Lee, K. Cho, M. Chhowalla and Y. J. Chabal, ACS Nano, 2010, 4, 5861–5868 CrossRef CAS PubMed.
  64. D. R. Dreyer, S. Park, C. W. Bielawski and R. S. Ruoff, Chem. Soc. Rev., 2010, 39, 228–240 RSC.
  65. A. Lerf, H. He, M. Forster and J. Klinowski, J. Phys. Chem. B, 1998, 102, 4477–4482 CrossRef CAS.
  66. A. Buchsteiner, A. Lerf and J. Pieper, J. Phys. Chem. B, 2006, 110, 22328–22338 CrossRef CAS PubMed.
  67. A. Lerf, A. Buchsteiner, J. Pieper, S. Schottl, I. Dekany, T. Szabo and H. P. Boehm, J. Phys. Chem. Solids, 2006, 67, 1106–1110 CrossRef CAS PubMed.
  68. A. Lerf, H. He, T. Riedl, M. Forster and J. Klinowski, Solid State Ionics, 1997, 101, 857–862 CrossRef.
  69. G. Eda, C. Mattevi, H. Yamaguchi, H. Kim and M. Chhowalla, J. Phys. Chem. C, 2009, 113, 15768–15771 CAS.
  70. H. C. Schniepp, J. L. Li, M. J. McAllister, H. Sai, M. Herrera-Alonso, D. H. Adamson, R. K. Pruhomme, R. Car, D. A. Saville and I. A. Aksay, J. Phys. Chem. B, 2006, 110, 8535–8539 CrossRef CAS PubMed.
  71. A. Němcová, P. Skeldon, G. E. Thompson, S. Morse, J. Čížek and B. Pacal, Corros. Sci., 2014, 82, 58–66 CrossRef PubMed.
  72. H. Duan, K. Du, C. Yan and F. Wang, Electrochim. Acta, 2006, 51, 2898–2908 CrossRef CAS PubMed.
  73. S. Park, J. An, J. W. Suk and R. S. Ruoff, Small, 2010, 6, 210–212 CrossRef CAS PubMed.
  74. G. K. Ramesha and S. Sampath, J. Phys. Chem. C, 2009, 113, 7985–7989 CAS.
  75. J. Liang, P. Bala Srinivasan, C. Blawert and W. Dietzel, Corros. Sci., 2009, 51, 2483–2492 CrossRef CAS PubMed.
  76. T. S. Lim, H. S. Ryu and S. H. Hong, Corros. Sci., 2012, 62, 104–111 CrossRef CAS PubMed.
  77. M. Mandal, A. P. Moon, G. Deo, C. L. Mendis and K. Mondal, Corros. Sci., 2014, 78, 172–182 CrossRef CAS PubMed.
  78. N. T. Kirkland, T. Schiller, N. Medhekar and N. Birbilis, Corros. Sci., 2011, 56, 1–4 CrossRef PubMed.
  79. S. J. Richard Prabakar, Y. H. Hwang, E. G. Bae, D. K. Lee and M. Pyo, Carbon, 2013, 52, 128–136 CrossRef CAS PubMed.
  80. D. R. Dreyer, S. Park, C. W. Bielawski and R. S. Ruoff, Chem. Soc. Rev., 2010, 39, 228–240 RSC.
  81. J. Liu, S. Fu, B. Yuan, Y. Li and Z. Deng, J. Am. Chem. Soc., 2010, 132, 7279–7281 CrossRef CAS PubMed.
  82. S. Stankovich, D. A. Dikin, G. H. Dommett, K. M. Kohlhaas, E. J. Zimney, E. A. Stach and R. S. Ruoff, Nature, 2006, 442, 282–286 CrossRef CAS PubMed.
  83. Y. Zhang, X. Xiao, Y. Sun, Y. Shi, H. Dai, P. Ni and L. Wang, Electroanalysis, 2013, 25, 959–966 CrossRef CAS PubMed.
  84. S. Stankovich, D. A. Dikin, R. D. Piner, K. A. Kohlhaas, A. Kleinhammes, Y. Jia, Y. Wu, S. T. Nguyen and R. S. Ruoff, Carbon, 2007, 45, 1558 CrossRef CAS PubMed.
  85. S. Guo, D. Wen, Y. Zhai, S. Dong and E. Wang, ACS Nano, 2010, 4, 3959–3968 CrossRef CAS PubMed.
  86. R. V. Dennis, L. T. Viyannalage, A. V. Gaikwad, T. K. Rout and S. Banerjee, Am. Ceram. Soc. Bull., 2013, 92, 18–24 CAS.
  87. S. Böhm, Nat. Nanotechnol., 2014, 9, 741–742 CrossRef PubMed.
  88. R. K. Singh Raman, P. Chakraborty Banerjee, D. E. Lobo, H. Gullapalli, M. Sumandasa, A. Kumar and M. Majumder, Carbon, 2012, 50, 4040–4045 CrossRef CAS PubMed.

This journal is © The Royal Society of Chemistry 2015