One-pot synthesis of 2-thenoyltrifluoroacetone surface functionalised SrF2:Eu3+ nanoparticles: trace level detection of water†
Debasish Ghosha and
Meitram Niraj Luwang*ab
aChemical Engineering and Process Development Division, National Chemical Laboratory, Pune – 411008, India. E-mail: mn.luwang@ncl.res.in; Fax: +91 20 2590 2621; Tel: +91 20 2590 2950
bAcademy of Scientific and Innovative Research (AcSIR), Anusandhan Bhawan, Rafi Marg, New Delhi-110001, India
First published on 21st May 2015
Abstract
This work reports the one pot synthesis of 2-thenoyltrifluoroacetone (TTA) surface functionalised SrF2:Eu3+ nanoparticles. The nanoparticles were characterised by X-ray diffraction (XRD), infra-red (IR), UV-absorption, transmission electron microscopy (TEM), and photoluminescence studies. Sensitization of Eu3+ ion by TTA in SrF2 nanoparticle matrix gives an enhanced luminescence in dry aprotic solvents like tetrahydrofuran (THF), acetonitrile (AN), dichloromethane (DCM) etc. We studied the effect of trace quantity of water on luminescence of the particles in THF solvent. Even a trace level of water content in the solvent is able to quench the luminescence significantly and quenching enhances with addition of more and more water. This approach of luminescence quenching strategy of detecting a minute trace level of water molecules has a potential application in the estimation of water in various dry organic solvents like THF.
1. Introduction
It is well established that 2-thenoyltrifluoroacetone (TTA) can sensitise a large number of lanthanide ions e.g., Nd3+, Sm3+, Eu3+, Tb3+, Ho3+, Tm3+, Yb3+, Er3+ etc. and these complexes give visible (Sm3+, Eu3+, Tb3+) or infrared (Nd3+, Ho3+, Tm3+, Yb3+, Er3+) luminescence depending upon the nature of the lanthanide ion.1–5 Lanthanide complexes have been widely used for clinical diagnostics, biotechnology discoveries,6,7 light-emitting devices,8–10 etc. over the past few decades. But the complexes suffer from quenching of the excited state of the lanthanide ion by the vibrational overtones of –OH, –NH, and –CH groups present in the organic molecule or in the medium.11 To protect lanthanide ions from being quenched by water or other solvent molecule and for practical applications, it is advantageous to embed luminescent lanthanide complexes in a matrix. Till date, lanthanide complexes have been successfully embedded in silica gel,12 inorganic–organic hybrid materials,13 liquid crystals,14 and mesoporous silica.15 In the lanthanide doped nanoparticles, lanthanide ion is embedded in an inorganic host material that protects lanthanide ion from environmental quenching. In order to enhance the luminescence of such lanthanide doped nanoparticles, their surface is decorated with sensitising organic molecules such as benzoic acid,16 p-aminobenzoic acid,17 1,2,4,5-benzenetetracarboxylic acid.18 These organic molecules have very high light absorbing ability and efficient energy transfer ability to the lanthanide ions. Thus it overcomes the drawback of low molar absorptivity associated with the 4f → 4f transitions of lanthanides. This phenomenon of sensitization of lanthanide ions to achieve an enhanced luminescence through efficient energy transfer from organic molecules is known as “antenna effect”. TTA has been used to sensitise the embedded Eu3+ ion in Y2O3,19 YPO4,20 and TiO2,21 nanoparticles.In this work Eu3+ ion doped SrF2 nanoparticles has been sensitised by TTA molecule. The host materials having very low phonon energies are of paramount importance as the quenching of the lanthanide excited state by the host material in nonradiative (multiphonon) relaxation way is very much reduced in such type of hosts. Strontium fluoride (SrF2) has a very low cut-off phonon energy (∼350 cm−1) which makes it a suitable host for sensitised lanthanide luminescence.22 Sensitization (343 nm excitation) resulted 65 times enhancement in luminescence of surface functionalised nanoparticles in dry organic solvents compared to the direct excitation (395 nm) of Eu3+ in the nanoparticles. We studied the effect of addition of trace quantity of water into the dry solvents and observed significant quenching of luminescence. This luminescence quenching phenomenon may be utilised to measure water content in organic solvents. There are a number of chemical reactions involving organolithiums,23 Grignard reagents,24 alkali metals,25 etc., which are extremely sensitive to moisture and water is an important quality control factor for pharmaceuticals.26 Thus detection of water in organic solvent has been a centre of attention of many chemists over the last decades. Tetrahydrofuran (THF), dichloromethane (DCM), acetonitrile (AN), dimethyl sulphoxide (DMSO) etc. are among the most commonly used solvents worldwide. In 1935 the German chemist Karl-Fischer invented a method for the detection of water, which is known as the most accurate method till the date.27 Still chemists all over the globe are trying to develop simple, convenient and sensitive technology in this field. Recently a number of sensors have been developed by some groups, e.g., colorimetric indicators based on UV spectroscopy,28 microgap impedance sensor based on cyclic voltammetry (CV) and electrochemical impedance spectroscopy (EIS),29 fluorescence sensor,30 Fluorescence PET (photo-induced electron transfer) sensors,31 trisulfur anionic radicals as colour sensor,32 etc. But these methods use very expensive instruments. Herein, we report a simple and convenient technique that can be used to detect trace level of water in organic solvents by utilizing Eu3+ doped SrF2 nanoparticles.
2. Experimental section
2.1 Reagents and materials
Strontium nitrate (Sr(NO3)2) (99.995%), europium(III) nitrate pentahydrate (Eu(NO3)3·5H2O) (99.9%), ammonium fluoride (NH4F) (99.99%), 2-thenoyltrifluoroacetone (TTA) (99%), anhydrous tetrahydrofuran (THF) (99.9%) are obtained from Sigma Aldrich. Anhydrous citric acid, dichloromethane (DCM), acetonitrile (AN), dimethyl sulphoxide (DMSO) and sodium hydroxide (NaOH) pellets are obtained from Merck and double distilled water was used for all the experiments.2.2 Synthesis of the particles
Recently, lanthanide doped SrF2 nanoparticles using citrate as capping agent was synthesised through hydrothermal route by Pedroni et al.33 Herein, a simple one pot co-precipitation technique for the synthesis of 2-thenoyltrifluroacetone functionalised SrF2:Eu3+ nanoparticles having different concentration of Eu3+ (2.6, 4, 6, 8 and 10 at%) has been reported. In a typical synthesis process, stoichiometric amount of Sr(NO3)2 and Eu(NO3)3 along 1 g of citric acid were dissolved in 25 ml water in 250 ml round bottom flask. The solution was stirred at 60 °C for half an hour and then 5 ml solution of 2.5 mmol ammonium fluoride was added and refluxed at 80 °C for an hour. 1 g TTA dissolved in 40 ml NaOH was added drop wise and refluxed at 110 °C for two more hours. The particles were collected by centrifugation at 12![[thin space (1/6-em)]](https://www.rsc.org/images/entities/char_2009.gif) 000 rpm for 15 minutes, washed with water and twice with methanol and then dried over night at room temperature. The sample was heated at 120 °C for another 4 hours in an oven to get a dry sample.
000 rpm for 15 minutes, washed with water and twice with methanol and then dried over night at room temperature. The sample was heated at 120 °C for another 4 hours in an oven to get a dry sample.
2.3 Preparation of sample for luminescence study
50 mg of the surface functionalised nanoparticles (SrF2:Eu3+(8%)@TTA) was taken in a dry 250 ml volumetric flask equipped with a septum and 250 ml dry THF was added to the flask by syringe. The resulting solution was sonicated for 15 minutes to disperse the particles nicely into the solvent. The nanodispersion was taken out by syringe for photoluminescence experiments. Similarly, various samples (10 mg/50 ml) were prepared in THF with different doping concentration of Eu3+ ions (2.6, 4, 6, 8, 10 at%) to check the effect of lanthanide concentration.Samples prepared in various solvents (AN, DMSO, DCM, MeOH, EtOH and H2O) were analysed to check the effect of solvent on luminescence of SrF2:Eu3+(8%)@TTA. All the nanodispersion under study was freshly prepared before each experiment.
2.4 Sample preparations for water estimation
10, 13, 20, 30, 40, 60, 70 μl of water were taken in separate 10 ml volumetric flasks equipped with septum. 10 ml of the nanodispersion (50 mg in 250 ml) in THF was added by syringe to each of the flask and sonicated for five minutes. The samples were taken out by syringe for photoluminescence measurements to check the effect of water content on the luminescence properties of SrF2:Eu3+@TTA nanoparticles.2.5 Characterisation
The X-ray diffraction (XRD) of powder samples was examined on a Xpert-Philips diffractometer using Cu Kα radiation (λ = 0.15405 nm) powder X-ray diffraction (PANalytical X'Pert Pro dual goniometer diffractometer) with filtered Cu Kα at 40 kV and 30 mA and X'celerator solid state detector. The diffraction pattern is obtained at room temperature in Bragg–Brentano geometry. Powder samples were mounted on a sample holder and scanned in the range 2θ = 5 to 90.The functional characteristics of the nanoparticles were recorded using Fourier Transform Infrared Spectrometer (Perkin-Elmer, Q-50000 GX Spectrometer). The recording of spectrum was done in the wavenumber range from 4000 to 400 cm−1. Powder samples were studied by making thin pellets with potassium bromide (KBr). All the UV-visible measurement are done in Shimadzu UV-1601 PC UV Visible double beam spectrophotometer.
All the luminescence spectra were recorded at room temperature using an EDINBURGH instrument FLS920 equipped with 450 W Xenon lamp having Peltier element cooled red sensitive Hamamatsu R955 PMT and a 100 W microsecond flash lamp.
High resolution transmission electron microscopy (HRTEM) studies of the nanoparticles were done on A FEITECNAI 3010 electron microscope operating at 300 kV (Cs = 0.6 mm, resolution 1.7 Å). Samples were crushed and dispersed in isopropanol before depositing onto a holey carbon grid.
3. Results and discussion
3.1 Phase analysis
XRD analysis as shown in Fig. 1a shows that cubic phase (JCPDS 06-0262) SrF2 particles were formed. Even at higher doping concentration of Eu3+ (10 at%), no extra peak is observed. This indicates successful doping of europium (Eu3+) ion in the host matrix of SrF2. J. Meuldijk et al. reported that a Ln3+ ion substitutes a Sr2+ ion in SrF2 nanocrystal. The excess positive charge on the lanthanide ion is compensated by an extra F− ion that occupies the centre site of the F− simple cubic sub-lattice.34,35 The ionic radii of Sr2+ and Eu3+ are 1.39 and 0.950 Å respectively.36 Substitution of a larger ion by a smaller ion tends to shrink the unit cell volume while the repulsion of interstitial F− ions tries to expand the unit cell volume. To investigate the influence of doping on the lattice parameters, unit cell volume at different doping concentrations were calculated and tabulated in Table 1. No appreciable variation in the unit cell volume with the variation of doping concentration is observed. Crystallite size of the nanoparticles were calculated using Scherrer equation (d = kλ/β![[thin space (1/6-em)]](https://www.rsc.org/images/entities/char_2009.gif) cos
cos![[thin space (1/6-em)]](https://www.rsc.org/images/entities/char_2009.gif) θ), where λ is the X-ray wavelength (0.154 nm), β is the full width at half-maximum (fwhm) of a diffraction peak, θ is the diffraction angle, k is a constant (0.89).37 Crystallite size of the nanoparticles is in the range of 10–12 nm.
θ), where λ is the X-ray wavelength (0.154 nm), β is the full width at half-maximum (fwhm) of a diffraction peak, θ is the diffraction angle, k is a constant (0.89).37 Crystallite size of the nanoparticles is in the range of 10–12 nm.
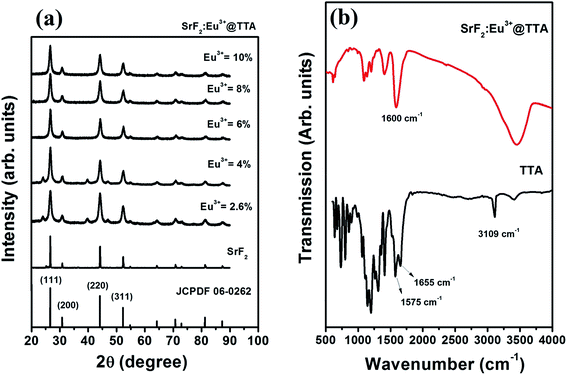 | ||
| Fig. 1 (a) XRD spectra for SrF2 and SrF2:Eu3+@TTA nanoparticles at various doping concentration (Eu3+ = 2.6, 4, 6, 8 and 10 at%) along with JCPDS 06-0262; (b) IR spectra of TTA and SrF2:Eu3+(8%)@TTA. | ||
| Sl. no. | Sample | Crystallite size (nm) | Lattice parameter (a) | Unit cell volume (Å3) |
|---|---|---|---|---|
| 1 | SrF2 | 94.0 | 5.794 | 194.50 |
| 2 | SrF2:Eu3+@TTA – 2.6% | 10.0 | 5.792 | 194.26 |
| 3 | SrF2:Eu3+@TTA – 4% | 11.0 | 5.789 | 194.07 |
| 4 | SrF2:Eu3+@TTA – 6% | 12.0 | 5.782 | 193.30 |
| 5 | SrF2:Eu3+@TTA – 8% | 10.7 | 5.788 | 193.98 |
| 6 | SrF2:Eu3+@TTA – 10% | 11.0 | 5.791 | 194.23 |
3.2 IR study
A comparison of IR spectra of 2-thenoyltrifluoroacetone (TTA) and SrF2:Eu3+@TTA nanoparticles is shown in the Fig. 1b. The stretching vibration of –CH2– (3109 cm−1) for 2-thenoyltrifluroacetone is absent in SrF2:Eu3+@TTA nanoparticle, which indicates the presence of enolate form of TTA in the nanoparticle.38 It is well established that metal chelates of β-diketones show two strong bands in the range of 1500–1650 cm−1.39 The higher frequency band is attributed to the chelated carbonyl group while that at lower frequency is for carbon–carbon double bonds. A few authors also indicated only one strong band in this region.40,41 They assigned this band to carbon–carbon double bond. In our work, only one strong peak is observed at around 1590 cm−1. This peak can be assigned to C![[double bond, length as m-dash]](https://www.rsc.org/images/entities/char_e001.gif) C bond. The other bands, observed at 1300–1100 cm−1, represent C–F and C–S stretching vibrations of the TTA ligand.42 Ya. M. Kimelfeld et al. reported that five membered heterocyclic thiophene shows a strong absorption at around 1400 cm−1, resulting from the vibration of the double bonds of the ring.43 In both the spectra for pure TTA and the surface functionalised particles, strong bands at around 1404 cm−1 are observed due to thiophene ring. The peak centred at ∼3450 cm−1 arises from the –OH group present in the sample. The above analysis confirms the successful surface functionalization of SrF2:Eu3+ by 2-thenoyltrifluoroacetone.
C bond. The other bands, observed at 1300–1100 cm−1, represent C–F and C–S stretching vibrations of the TTA ligand.42 Ya. M. Kimelfeld et al. reported that five membered heterocyclic thiophene shows a strong absorption at around 1400 cm−1, resulting from the vibration of the double bonds of the ring.43 In both the spectra for pure TTA and the surface functionalised particles, strong bands at around 1404 cm−1 are observed due to thiophene ring. The peak centred at ∼3450 cm−1 arises from the –OH group present in the sample. The above analysis confirms the successful surface functionalization of SrF2:Eu3+ by 2-thenoyltrifluoroacetone.
3.3 Morphology analysis
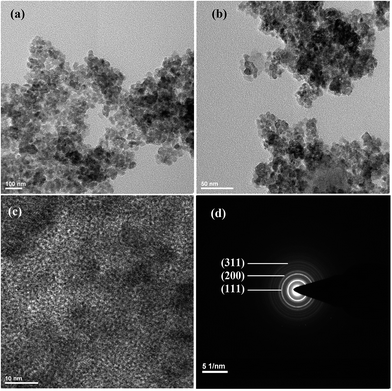
Fig. 2a–c shows high resolution transmission electron microscopy (HRTEM) images of surface functionalised SrF2:Eu3+(8%)@TTA NPs which have the morphology of spherical shape. The images show that the nanoparticles are quite agglomerated. The average size of individual spherical nanoparticle is about 7 nm which is in good agreement with the value calculated from XRD (10–12 nm). The lattice fringes are clearly observed and the experimentally observed d-spacing is found to be 0.29 nm which coincides with the (200) plane of cubic phase (JCPDS 06-0262) SrF2 particles. Crystalline nature is well understood from the selected area (electron) diffraction (SAED) pattern (Fig. 2d) of the particles and the major diffraction has been assigned to their corresponding planes.3.4 Absorption and excitation study
Comparative study of the UV absorption spectra of SrF2, TTA, and SrF2:Eu3+@TTA is given in Fig. 3a. UV absorption spectrum of TTA in alkaline aqueous medium shows two broad absorption bands having maxima at 263 nm and 340 nm. These two peaks are devoted to the π–π* transitions of thiophene ring and the carbonyl group respectively.44 SrF2 does not show any UV absorption in 200–400 nm wavelength range. UV spectrum of surface functionalised nanoparticles in tetrahydrofuran (THF) medium shows a broad absorption spectra having maximum at 343 nm. This is due to the TTA molecules co-ordinated on the surface of the nanoparticles. A comparison of UV spectra of surface functionalised nanoparticles in water and THF along with that for TTA in water has been given in Fig. 3b. Patterns of the spectra of the particles in water and THF are not same. In water, intensity of the broad peak in the range 300 to 390 nm reduces significantly and intensity of the peak at 260 nm enhances. This phenomenon may be explained by considering the removal of enolic form of TTA from the surface of the particles in diketonic form as the diketonic TTA in water has much lower intensity in 300–390 nm region compared to that in 240–300 nm and further supported by excitation spectra measurement in presence of trace quantity of water in THF (discuss later in Fig. 6c).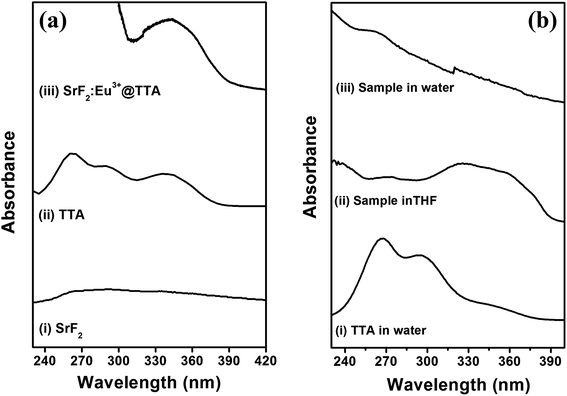 | ||
| Fig. 3 Absorption spectra of (a) SrF2, TTA and SrF2:Eu3+@TTA along with (b) the spectra of TTA in water, SrF2:Eu3+@TTA in THF and water. | ||
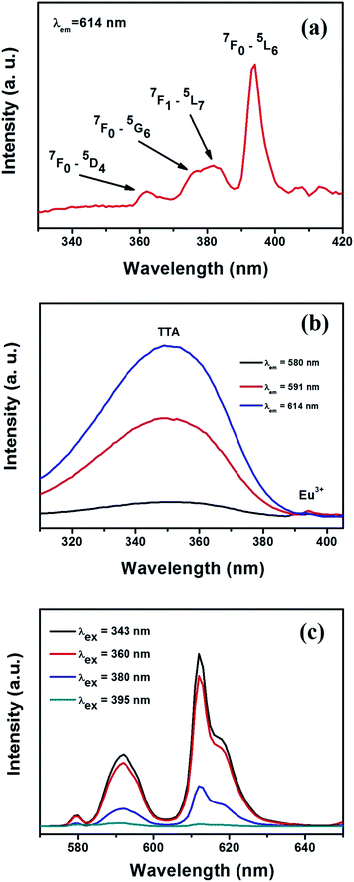
Excitation spectrum of SrF2:Eu3+ nanoparticles (Fig. 4a) were recorded by monitoring the emission at 614 nm. The spectrum shows a number of peaks at 361, 376/381, and 395 nm, which correspond to 7F0 → 5D4, 7F0 → 5G6, 7F1 → 5L7, 7F0 → 5L6 transitions of Eu3+ respectively.45 Among these peaks the strongest one is observed at 395 nm which has been used to excite Eu3+. Excitation spectra of SrF2:Eu3+@TTA were recorded by monitoring emissions at 580, 591 and 614 nm and have been shown in Fig. 4b. Patterns of all the spectra are almost same. In the spectra, peaks for TTA and Eu3+ (395 nm) are seen. Intensity of the peaks for TTA ranging from 300 to 390 nm is lowest for 580 nm and highest for 614 nm.
3.5 Photoluminescence studies
Forbidden character of f–f transitions in Eu(III) ion results in low absorption coefficient and hence poor luminescence intensity when they are directly excited by 395 nm wavelength. It is well established that 2-thenoyltrifluoroacetone is a very good sensitiser for Eu3+ ion. To examine this sensitization process, the functionalised nanoparticle dispersion in dry THF was excited by two different wavelengths, 343 nm at which TTA shows a strong absorption and 395 nm which is used to excite Eu3+ ion directly. Almost 65 times enhancement is observed in sensitised luminescence as compared with that of the direct excitation as shown in Fig. 4c. On excitation by 343 nm wavelength, sensitiser TTA molecule excite from singlet ground state (S0) to an excited singlet state (S1) with energy gap of 3.12 eV (25![[thin space (1/6-em)]](https://www.rsc.org/images/entities/char_2009.gif) 116 cm−1). The excited molecule then undergoes a non-radiative relaxation process, known as inter system crossing (ISC) to a comparatively more stable triplet state (T1) of energy 2.35 eV (18
116 cm−1). The excited molecule then undergoes a non-radiative relaxation process, known as inter system crossing (ISC) to a comparatively more stable triplet state (T1) of energy 2.35 eV (18![[thin space (1/6-em)]](https://www.rsc.org/images/entities/char_2009.gif) 917 cm−1).46 Excited triplet state of TTA can efficiently transfer energy to the low laying 5D levels of Eu3+. Subsequent radiative transition from 5D to 7F level gives characteristic emission of Eu3+. The luminescence peaks are assigned as 5D0 → 7F0 (580 nm), the magnetic-dipole transition, 5D0 → 7F1 (591 nm) and the electric-dipole transition 5D0 → 7F2 (614 nm). The electrical transition is only allowed at low symmetries with no centre of symmetry and very sensitive to the surroundings of the Eu3+ ion. The relative intensity ratio of electric dipole transition (5D0 → 7F2) to magnetic dipole transition (5D0 → 7F1), known as asymmetric ratio, IAS, is used as an effective parameter to understand symmetry around the Eu3+ ion. The higher is the ratio, the lower is the site symmetry.47,48 Variation in luminescence intensity with variation in excitation wavelength has been investigated and shown in Fig. 4c. Corresponding asymmetric ratio values are given in Table 2. Asymmetric ratio value is almost 2 when it is excited with a wavelength (343, 360 and 380 nm) falling under the absorption band of TTA (300–390 nm) of the surface functionalised particles. But the value is only 0.58 when the excitation wavelength is 395 nm. High asymmetric ratio indicates that excitation in the absorption band of TTA gives luminescence from those Eu3+ ions which are in a high asymmetric environment at the surface of the nanoparticles and co-ordinated to TTA molecules. Low value of asymmetric ratio upon 395 nm excitation indicates the luminescence from Eu3+ ions which are in more symmetric environment in the interior of the particles. It has been reported that in case of Eu(oleate)x(TTA)y complexes the asymmetry ratio increases from 6.2 to 14 as the coordination of TTA increases from y = 1 to an expected maximum of y = 3.20 In the present case change in asymmetric ratio for various excitation wavelength is very small. This change is not the result of change in the number of TTA attached to Eu3+ but originates due to the difference in surrounding environment of Eu3+ ions.
917 cm−1).46 Excited triplet state of TTA can efficiently transfer energy to the low laying 5D levels of Eu3+. Subsequent radiative transition from 5D to 7F level gives characteristic emission of Eu3+. The luminescence peaks are assigned as 5D0 → 7F0 (580 nm), the magnetic-dipole transition, 5D0 → 7F1 (591 nm) and the electric-dipole transition 5D0 → 7F2 (614 nm). The electrical transition is only allowed at low symmetries with no centre of symmetry and very sensitive to the surroundings of the Eu3+ ion. The relative intensity ratio of electric dipole transition (5D0 → 7F2) to magnetic dipole transition (5D0 → 7F1), known as asymmetric ratio, IAS, is used as an effective parameter to understand symmetry around the Eu3+ ion. The higher is the ratio, the lower is the site symmetry.47,48 Variation in luminescence intensity with variation in excitation wavelength has been investigated and shown in Fig. 4c. Corresponding asymmetric ratio values are given in Table 2. Asymmetric ratio value is almost 2 when it is excited with a wavelength (343, 360 and 380 nm) falling under the absorption band of TTA (300–390 nm) of the surface functionalised particles. But the value is only 0.58 when the excitation wavelength is 395 nm. High asymmetric ratio indicates that excitation in the absorption band of TTA gives luminescence from those Eu3+ ions which are in a high asymmetric environment at the surface of the nanoparticles and co-ordinated to TTA molecules. Low value of asymmetric ratio upon 395 nm excitation indicates the luminescence from Eu3+ ions which are in more symmetric environment in the interior of the particles. It has been reported that in case of Eu(oleate)x(TTA)y complexes the asymmetry ratio increases from 6.2 to 14 as the coordination of TTA increases from y = 1 to an expected maximum of y = 3.20 In the present case change in asymmetric ratio for various excitation wavelength is very small. This change is not the result of change in the number of TTA attached to Eu3+ but originates due to the difference in surrounding environment of Eu3+ ions.
| Sl. no. | Excitation wavelength (λex) | Integrated area | Asymmetric ratio, IAS (Ae/Am) | |
|---|---|---|---|---|
| Magnetic dipole transition, Am (591 nm) | Electric dipole transition, Ae (614 nm) | |||
| 1 | 343 nm | 9![[thin space (1/6-em)]](https://www.rsc.org/images/entities/char_2009.gif) 234 234![[thin space (1/6-em)]](https://www.rsc.org/images/entities/char_2009.gif) 400 400 |
18![[thin space (1/6-em)]](https://www.rsc.org/images/entities/char_2009.gif) 569 569![[thin space (1/6-em)]](https://www.rsc.org/images/entities/char_2009.gif) 800 800 |
2.01 |
| 2 | 360 nm | 8![[thin space (1/6-em)]](https://www.rsc.org/images/entities/char_2009.gif) 006 006![[thin space (1/6-em)]](https://www.rsc.org/images/entities/char_2009.gif) 730 730 |
16![[thin space (1/6-em)]](https://www.rsc.org/images/entities/char_2009.gif) 135 135![[thin space (1/6-em)]](https://www.rsc.org/images/entities/char_2009.gif) 100 100 |
2.01 |
| 3 | 380 nm | 2![[thin space (1/6-em)]](https://www.rsc.org/images/entities/char_2009.gif) 270 270![[thin space (1/6-em)]](https://www.rsc.org/images/entities/char_2009.gif) 920 920 |
4![[thin space (1/6-em)]](https://www.rsc.org/images/entities/char_2009.gif) 558 558![[thin space (1/6-em)]](https://www.rsc.org/images/entities/char_2009.gif) 620 620 |
2.00 |
| 4 | 395 nm | 464![[thin space (1/6-em)]](https://www.rsc.org/images/entities/char_2009.gif) 637 637 |
270![[thin space (1/6-em)]](https://www.rsc.org/images/entities/char_2009.gif) 380 380 |
0.58 |
Fig. 5a shows luminescence enhancement due to increase in Eu3+ ion concentration in the SrF2 nanoparticles. The enhancement is observed till 8% concentration of Eu3+ but it abruptly reduces at 10%. Observed luminescence quenching at 10% may be explained by direct energy migration of excitation along a chain of Eu3+. With increase in dopant concentration Eu–Eu distance decreases and thus Eu3+ → Eu3+ energy migration becomes more effective and typically this is one of the most important mechanisms for luminescence concentration quenching.49
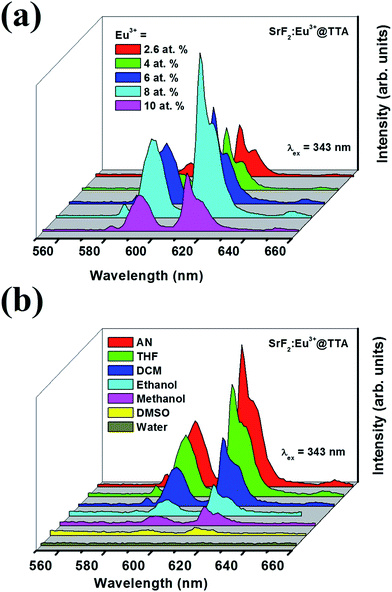 | ||
| Fig. 5 Photoluminescence spectra of SrF2:Eu3+@TTA nanoparticles at (a) different doping concentrations of Eu3+ ion and (b) in different solvents at 343 nm excitation. | ||
3.6 Effect of solvent on sensitised luminescence
Solvent plays an important role on the luminescence intensity of the nanoparticles as shown in Fig. 5b. Upon excitation with 343 nm light, high luminescence is observed in polar aprotic solvents like acetonitrile (AN), tetrahydrofuran (THF) and dichloromethane (DCM) whereas it reduces in polar protic solvents like MeOH and water. Repeated experiments show that luminescence intensity is poor in dry polar aprotic dimethyl sulphoxide (DMSO) solvent. In polar protic solvents like MeOH and H2O, abrupt change in luminescence may be explained by considering detachment of TTA from the particle surface and thermal quenching of the excited state of Eu3+ by –OH group.503.7 Estimation of water in THF
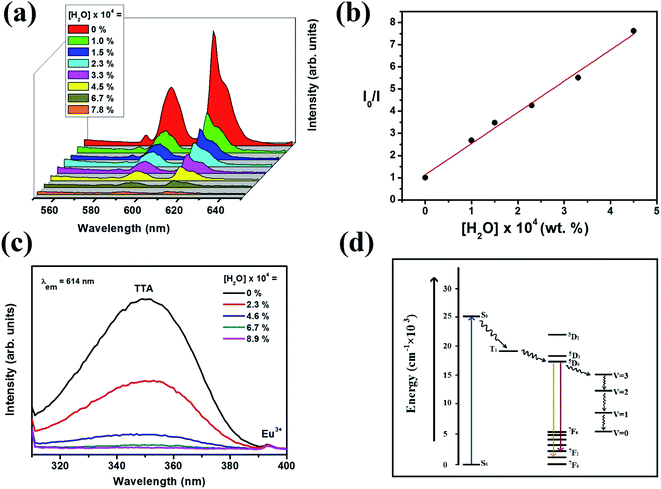
Sensitised luminescence of the nanoparticles in dry THF quenches upon addition of water as shown in the Fig. 6a. Percentage quenching of 5D0 → 7F2 (614 nm) luminescence has been calculated using the formula (I0 − I)/I0 × 100%, where I0 is the maximum fluorescence intensity of the functionalised nanoparticles in dry THF and I is after addition of water to THF. Just addition of 1 × 10⁻⁴% by weight of water reduces the luminescence intensity by 63 percent. Further additions of water show gradual quenching in the luminescence intensity. Addition of 7.8 × 10⁻⁴% by weight of water reduces the luminescence by 95%. Change in asymmetric ratio upon addition of water has been given in Table S1 (ESI†). Although water quenches luminescence intensity abruptly but change in asymmetric ratio is negligible. Sensitised luminescence always get generated from surface Eu3+ housed in asymmetric environment and attached to TTA molecules. Thus addition of water does not change asymmetric ratio significantly. Plot of I0/I vs. concentration (Q) shown in Fig. 6b follows a linear relation, I0/I = 1.134 + 14![[thin space (1/6-em)]](https://www.rsc.org/images/entities/char_2009.gif) 081.69[Q], as determined by the least-squares fitting method with a correlation coefficient (R2) of >0.99. Thus at low water concentration, quenching follows the simple Stern–Volmer relationship, I0/I = 1 + kQ[Q] and the binding constant (kQ) is 14
081.69[Q], as determined by the least-squares fitting method with a correlation coefficient (R2) of >0.99. Thus at low water concentration, quenching follows the simple Stern–Volmer relationship, I0/I = 1 + kQ[Q] and the binding constant (kQ) is 14![[thin space (1/6-em)]](https://www.rsc.org/images/entities/char_2009.gif) 081. At high concentration of water (6.7 × 10⁻⁴%) the plot shows upward curvature as shown in Fig. S1 (ESI†).
081. At high concentration of water (6.7 × 10⁻⁴%) the plot shows upward curvature as shown in Fig. S1 (ESI†).
Effect of addition of trace quantity of water on the excitation spectra of surface functionalised particles has been shown in Fig. 6c. Addition of 2.3 × 10⁻⁴% by weight of water reduces the TTA peak intensity to almost half. Further addition of water reduces the peak intensity gradually. When 8.9 × 10⁻⁴% of water is added the peak intensity reduces to almost zero. These UV and excitation studies confirm that addition of water into nano dispersion in THF removes the TTA ligands from the particle surface.
Mechanism of quenching of luminescence upon addition of water has been studied with the aid of UV and excitation experiments. Results of both experiments have been discussed in Section 3.4. The observations give an indication of removal of attached TTA molecules from the surface of the particles by water molecules. Enolic form of TTA molecule gets attached on the surface of the particles through formation of complex with the Eu3+ ions. Upon addition of water surface attached TTA molecules transform into diketonic form from enolic form and hence lose direct connectivity with Eu3+ ions (Scheme 1). Detachment of the sensitiser molecule from Eu3+ ion prevents energy transfer from TTA to Eu3+ ion and hence reduces luminescence intensity. This is the most prominent reason for luminescence quenching. In addition, we may consider little contribution to quenching phenomenon from deactivation of excited state of Eu3+ by –OH oscillators. Removal of TTA molecule from surface gives an opportunity to the added water molecules to come in contact with the Eu3+ ions on the surface of the nanoparticles. It is well established that the excited states of the lanthanides such as Eu(III), Tb(III) and Yb(III) are quenched by water molecules co-ordinated to the lanthanide ion.51–54 Vibronic coupling of Ln(III) ion excited states with the –OH oscillators of coordinated water molecules provides a facile path for radiationless energy transfer from lanthanide to the vibrational overtones of –OH as shown in the Fig. 6d. Thus water quenches luminescence by removing TTA molecules and deactivating the Eu3+ ion excited state. This quenching phenomenon may be used to measure water content in organic solvent. Stern–Volmer plot shown in Fig. 6b can be utilised for quantification of water in THF. Limit of detection of water by this method is 1 × 10⁻⁴% by weight.
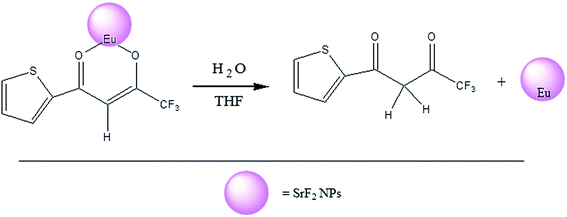 | ||
| Scheme 1 Schematic diagram for the stripping of the TTA from the nanoparticle surface on interaction with water. | ||
4. Conclusion
Very small (∼7 nm) spherical Eu3+ doped SrF2 nanoparticles were prepared by a simple co-precipitation method and they were surface functionalised with 2-thenoyltrifluoroacetone (TTA). The functionalised nanoparticles were well characterised by various experimental techniques like XRD, IR, HRTEM, UV, PL etc. Upon 343 nm excitation, the nanoparticles give enhanced sensitised luminescence due to efficient energy transfer from the sensitiser TTA molecule to Eu3+. Effect of solvent medium was observed on the luminescence intensity of the particles. Enhanced luminescence of the particles in dry THF reduces upon addition of water mainly due to removal of the TTA ligands from the surface of the particles by water molecules. Vibronic coupling of Eu(III) ion excited states with the –OH oscillators may also have some little contribution to the quenching phenomenon. The variation of the photoluminescence properties of SrF2:Eu3+@TTA nanoparticles on interaction with trace amount of water molecules in dry solvent can have potential application to estimate small quantity of water in organic solvent.Conflict of interest
The authors declare no competing financial interest.Acknowledgements
The authors appreciate the support from the NCL Research Start-up Grant. One of the authors (D Ghosh) would like to thank Council of Scientific and Industrial Research (CSIR) for research fellowship. Dr R. S. Ningthoujam, BARC. Mumbai is kindly acknowledged for the photoluminescence measurement.References
- P. Lenaerts, K. Driesen, R. V. Deun and K. Binnemans, Chem. Mater., 2005, 17, 2148–2154 CrossRef CAS.
- S. Dang, L.-N. Sun, H.-J. Zhang, X.-M. Guo, Z.-F. Li, J. Feng, H.-D. Guo and Z.-Y. Guo, J. Phys. Chem. C, 2008, 112, 13240–13247 CAS.
- G. Yu, Y. Liu, X. Wu and D. Zhu, Chem. Mater., 2000, 12, 2537–2541 CrossRef CAS.
- X. Zhang, S. Wen, S. Hu, Q. Chen, H. Fong, L. Zhang and L. Liu, J. Phys. Chem. C, 2010, 114, 3898–3903 CAS.
- Y.-F. Yuan, T. Cardinaels, K. Lunstroot, K. V. Hecke, L. V. Meervelt, C. G. Walrand, K. Binnemans and P. Nockemann, Inorg. Chem., 2007, 46, 5302–5309 CrossRef CAS PubMed.
- L. Zhang, Y. Wang, Z. Ye, D. Jin and J. Yuan, Bioconjugate Chem., 2012, 23, 1244–1251 CrossRef CAS PubMed.
- F.-B. Wu, S.-Q. Han, C. Zhang and Y. F. He, Anal. Chem., 2002, 74, 5882–5889 CrossRef CAS.
- J. Yu, L. Zhou, H. Zhang, Y. Zheng, H. Li, R. Deng, Z. Peng and Z. Li, Inorg. Chem., 2005, 44, 1611–1618 CrossRef CAS PubMed.
- F. Liang, Q. Zhou, Y. Cheng, L. Wang, D. Ma, X. Jing and F. Wang, Chem. Mater., 2003, 15, 1935–1937 CrossRef CAS.
- R. Reyes, M. Cremona, E. E. S. Teotonio, H. F. Brito and O. L. Malta, Chem. Phys. Lett., 2004, 396, 54–58 CrossRef CAS PubMed.
- J. Zhang, C. M. Shade, D. A. Chengelis and S. Petoud, J. Am. Chem. Soc., 2007, 129, 14834–14835 CrossRef CAS PubMed.
- L. R. Matthews and E. T. Kobbe, Chem. Mater., 1993, 5, 1697–1700 CrossRef CAS.
- P. A. Tanner, B. Yan and H. Zhang, J. Mater. Sci., 2000, 35, 4325–4328 CrossRef CAS.
- K. Binnemans and C. Gorller-Walrand, Chem. Rev., 2002, 102, 2303–2345 CrossRef CAS PubMed.
- A. P. Duarte, L. Mauline, M. Gressier, J. Dexpert-Ghys, C. Roques, J. M. A. Caiut, E. Deffune, D. C. G. Maia, I. Z. Carlos, A. A. P. Ferreira, S. J. L. Ribeiro and M. J. Menu, Langmuir, 2013, 29, 5878–5888 CrossRef CAS PubMed.
- J. Wang, Z. Wang, X. Li, S. Wang, H. Mao and Z. Li, Appl. Surf. Sci., 2011, 257, 7145–7149 CrossRef CAS PubMed.
- D. Ghosh and M. Niraj Luwang, RSC Adv., 2015, 5, 10468–10478 RSC.
- S. Li, X. Zhang, Z. Hou, Z. Cheng, P. Ma and J. Lin, Nanoscale, 2012, 4, 5619–5626 RSC.
- L. Ji, N. Chen, G. Du, M. Yan and W. Shi, Ceram. Int., 2014, 40, 3117–3122 CrossRef CAS PubMed.
- J. Chen, Q. Meng, P. S. May, M. T. Berry and C. Lin, J. Phys. Chem. C, 2013, 117, 5953–5962 CAS.
- P. M. Sirimanne and Y. B. Cheng, J. Lumin., 2009, 129, 563–565 CrossRef CAS PubMed.
- N. Rakov, R. B. Guimarães, D. F. Franceschini and G. S. Maciel, Mater. Chem. Phys., 2012, 135, 317–321 CrossRef CAS PubMed.
- H. J. Reich, Chem. Rev., 2013, 113, 7130–7178 CrossRef CAS PubMed.
- D. H. Smith, J. Chem. Educ., 1999, 76, 1427–1428 CrossRef CAS.
- M. M. Markowitz, J. Chem. Educ., 1963, 40, 633–636 CrossRef CAS.
- K. Grodowska and A. Parczewski, Acta Pol. Pharm., 2013, 67, 3–12 Search PubMed.
- K. Fischer, Angew. Chem., 1935, 48, 394–396 CAS.
- S. Ishihara, J. Labuta, T. Sikorsky, J. V. Burda, N. Okamoto, H. Abe, K. Ariga and J. P. Hill, Chem. Commun., 2012, 48, 3933–3935 RSC.
- J. Liang, B. Q. Chen and Y.-T. Long, Analyst, 2011, 136, 4053–4058 RSC.
- Q. Deng, Y. Li, J. Wu, Y. Liu, G. Fang, S. Wang and Y. Zhang, Chem. Commun., 2012, 48, 3009–3011 RSC.
- Y. Ooyama, A. Matsugasako, K. Oka, T. Nagano, M. Sumomogi, K. Komaguchi, I. Imae and Y. Harima, Chem. Commun., 2011, 47, 4448–4450 RSC.
- Q. Gao, Y. Xiu, G.-D. Li and J. S. Chen, J. Mater. Chem., 2010, 20, 3307–3312 RSC.
- M. Pedroni, F. Piccinelli, T. Passuello, S. Polizzi, J. Ueda, P. Haro-González, L. M. Maestro, D. Jaque, J. García-Solé, M. Bettinelli and A. Speghini, Cryst. Growth Des., 2013, 13, 4906–4913 CAS.
- J. Meuldijk, R. V. Meulen and H. W. Hartog, Phys. Rev. B: Condens. Matter Mater. Phys., 1984, 29, 2153–2159 CrossRef CAS.
- D. Chen, Y. Yu, F. Huang, P. Huang, A. Yang and Y. Wang, J. Am. Chem. Soc., 2010, 132, 9976–9978 CrossRef CAS PubMed.
- N. Takeuchi, S. Ishida, A. Matsumura and Y. I. Ishikawa, J. Phys. Chem. B, 2004, 108, 12397–12403 CrossRef CAS.
- P. Scherrer, Göttinger Nachrichten Gesell., 1918, 2, 98–100 Search PubMed.
- X.-F. Qiao and B. Yan, Inorg. Chem., 2009, 48, 4714–4723 CrossRef CAS PubMed.
- R. P. Dryden and A. Winston, J. Phys. Chem., 1958, 62, 635–637 CrossRef CAS.
- L. J. Bellamy, G. S. Spicer and J. D. H. Strickland, J. Chem. Soc., 1952, 4653–4656 RSC.
- D. N. Shigorin, Zh. Fiz. Khim., 1953, 27, 554 CAS.
- G. Malandrino, L. M. S. Perdicaro, G. Condorelli, I. L. Fragal, P. Rossi and P. Dapporto, Dalton Trans., 2006, 8, 1101–1106 RSC.
- Y. M. Kimelfeld, V. T. Aleksanyan, N. N. Magdesieva and Y. K. Yurev, Zh. Strukt. Khim., 1966, 7, 42–47 CAS.
- G.-L. Zhong and K.-Z. Yang, Langmuir, 1998, 14, 5502–5506 CrossRef CAS.
- Y. He, N. Chen and G. Du, J. Am. Ceram. Soc., 2014, 97, 1931–1936 CrossRef CAS PubMed.
- H. Xu, L.-H. Wang, X.-H. Zhu, K. Yin, G.-Y. Zhong, X.-Y. Hou and W. Huang, J. Phys. Chem. B, 2006, 110, 3023–3029 CrossRef CAS PubMed.
- W. Yu, X. Wang, N. Chen, G. Du and W. Gui, CrystEngComm, 2014, 16, 3214–3221 RSC.
- M. Shang, G. Li, X. Kang, D. Yang, D. Geng, C. Peng, Z. Cheng, H. Lian and J. Lin, Dalton Trans., 2012, 41, 5571–5580 RSC.
- O. Meza, E. G. Villabona-Leal, L. A. Diaz-Torres, H. Desirena, J. L. Rodríguez-López and E. Pérez, J. Phys. Chem. A, 2014, 118, 1390–1396 CrossRef CAS PubMed.
- M. N. Luwang, R. S. Ningthoujam, S. K. Srivastava and R. K. Vatsa, J. Am. Chem. Soc., 2011, 133, 2998–3004 CrossRef CAS PubMed.
- J. Massue, S. J. Quinn and T. Gunnlaugsson, J. Am. Chem. Soc., 2008, 130, 6900–6901 CrossRef CAS PubMed.
- M. N. Luwang, R. S. Ningthoujam, Jagannath, S. K. Srivastava and R. K. Vatsa, J. Am. Chem. Soc., 2010, 132, 2759–2768 CrossRef CAS PubMed.
- J. I. Pacold, D. S. Tatum, G. T. Seidler, K. N. Raymond, X. Zhang, A. B. Stickrath and D. R. Mortensen, J. Am. Chem. Soc., 2014, 136, 4186–4191 CrossRef CAS PubMed.
- J. Hammell, L. Buttarazzi, C.-H. Huang and J. R. Morrow, Inorg. Chem., 2011, 50, 4857–4867 CrossRef CAS PubMed.
Footnote |
| † Electronic supplementary information (ESI) available: Stern–Volmer plot of I0/I vs. [Q] of SrF2:Eu3+@TTA nanoparticles, Asymmetric ratio of the electric and magnetic dipole transition of the emission spectra of SrF2:Eu3+@TTA at different concentration of water in THF solvent. See DOI: 10.1039/c5ra08566g |
| This journal is © The Royal Society of Chemistry 2015 |

