 Open Access Article
Creative Commons Attribution 3.0 Unported Licence
Dye-sensitized solar cells with hole-stabilizing surfaces: “inorganic” versus “organic” strategies†
Nik
Hostettler
,
Iain A.
Wright
,
Biljana
Bozic-Weber
,
Edwin. C.
Constable
* and
Catherine E.
Housecroft
*
Department of Chemistry, University of Basel, Spitalstrasse 51, CH-4056 Basel, Switzerland. E-mail: catherine.housecroft@unibas.ch
First published on 27th April 2015
Abstract
Two 2,2′:6′,2′′-terpyridine ligands (9 and 10) incorporating second-generation diphenylamino-dendrons have been synthesized and characterized; one ligand contains chromophoric benzothiadiazole domains. Using the ‘surface-as-ligand, surface-as-complex’ strategy, zinc(II)-containing sensitizers [Zn(Lanchor)(Lancillary)]2+ with carboxylic or phosphonic acid anchors (1 and 2, respectively) have been assembled and tested in n-type DSCs. The solid-state absorption spectra of dye-functionalized electrodes show a broad spectral response for all the dyes with enhanced intensity for those containing the benzothiadiazole units. However, the [Zn(Lanchor)(Lancillary)]2+ dyes perform poorly, exhibiting very low values of the short-circuit current density (JSC) and open-circuit voltage (VOC). The external quantum efficiency (EQE) spectra confirm that electron injection occurs, but EQEmax is ≤3%. Non-optimal positioning of the thiadiazole domain in the dye probably contributes to the poor performances. Screening of DSCs containing FTO/TiO2 photoanodes without adsorbed dye shows that they generate small short-circuit current densities and open-circuit voltages which contribute significantly to parameters reported for badly performing dyes. An organic dye 11, structurally similar to 10 and containing a 2-cyanoacrylic acid anchor, is also reported. This exhibits a broad and intense spectral response between 300 and 600 nm, and shows efficient electron injection over a broad wavelength range. DSCs containing 11 are stable over a 17 day period and show global efficiencies of 3.93–4.57% (ca. 70% with respect to N719 set at 100%). Ground state DFT calculations reveal that the HOMO in each of [Zn(1)(9)]2+, [Zn(2)(9)]2+, [Zn(1)(10)]2+, [Zn(2)(10)]2+ and 11 is localized on the peripheral diphenylamino units, allowing for hole-transfer to the reduced electrolyte. In 11, a major contribution from the 2-cyanoacrylic acid anchoring group appears in the LUMO manifold; however, while the LUMO in each zinc(II) dye is localized on anchoring ligand 1 or 2, it is concentrated close to the metal centre which may contribute to poor electron injection.
Introduction
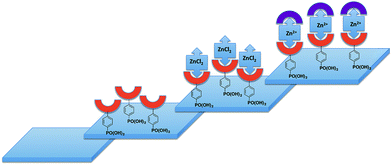
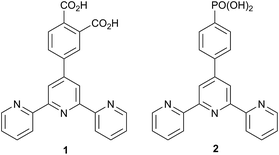
Dye-sensitized solar cells (DSCs) were developed around twenty years ago and, even at an early stage, exhibited relatively high efficiencies.1 Improvements in DSC design have increased the efficiency of the conversion of photons to electrical current.2,3 Conversion efficiency depends on optimizing the photoresponse of the dye, the electron injection, and the rate of oxidized dye regeneration. It is also essential to minimize charge recombination events.4–6 In a Grätzel n-type DSC, the LUMO of the dye must be higher than the level of the TiO2 conduction band7 (−4.0 eV), while the HOMO of the dye should be slightly lower than the HOMO of the redox couple (−4.9 eV for the archetypal I−/I3− redox shuttle).8 Design of transition metal-containing sensitizers and molecular organic dyes must take account of all the above criteria.3,9We and others are developing sensitizers for DSCs which incorporate low cost Earth-abundant metals to replace rare elements such as ruthenium.10 Copper(I) sensitizers11–26 feature strongly, but we have also reported the successful use of {Zn(tpy)2}2+-containing dyes (tpy = 2,2′:6′,2′′-terpyridine), albeit with low photon-to-current conversion efficiencies.27,28 The lability of both copper(I) and zinc(II) complexes permits sequential assembly of photoactive dyes on a semiconductor surface using the ‘surface-as-ligand, surface-as-complex’ methodology;17 ligand exchange is rapid for copper(I) but slower for zinc(II). Fig. 1 summarizes the strategy for {Zn(tpy)2}2+ sensitizers, involving initial treatment of an FTO/TiO2 surface with an anchoring tpy ligand (e.g.1 and 2, Scheme 1), followed by treatment of the surface-as-ligand with a zinc(II) salt, and finally reaction of the surface-as-complex with a chromophore-functionalized tpy ancillary ligand such as 3–7 (Scheme 1).27 Although ligand exchange in [Zn(tpy)2]2+ complexes is slow on the NMR timescale,27 once assembled, [Zn(tpy)2]2+ domains anchored to the n-type semiconductor are stable. This stepwise procedure contrasts with the preparation of heteroleptic dyes by the HETPHEN29 approach,19,21 or by the use of ligand exchange reactions involving homoleptic metal complexes.10 Advantages of the in situ stepwise strategy are a reduction in the number of synthetic steps in dye preparation and a consequential atom and financial economy16,17 for the photoactive materials.
Unlike copper(I)-containing dyes which exhibit metal-to-ligand charge transfer (MLCT) bands in the visible region, zinc(II) complexes characteristically possess absorption spectra dominated by intra-ligand transitions. In sensitizers based on {Zn(tpy)2} complexes, the zinc(II) ion acts as ‘glue’ between the anchoring and ancillary ligand domains. The advantage of the assembly principle shown in Fig. 1 is that it facilitates screening of a wide range of ligand combinations. In order that the photoresponse of the dye incorporates the visible region, it is essential that the ancillary ligand contains a chromophore. Consequently, the formation of the surface-bound {Zn(tpy)2} unit is readily monitored by an optical change.27,28
In contrast to the highly promising performance of porphyrinato zinc(II) dyes which can achieve power conversion efficiencies of up to 13%,30,31 DSCs containing {Zn(tpy)2} complexes with anchoring ligands 1 and 2, and ancillary ligands 3–7![[thin space (1/6-em)]](https://www.rsc.org/images/entities/char_2009.gif) 27,28 exhibit very low efficiencies, in part due to inadequate light-harvesting in the visible. A common strategy for enhancing light absorption is by extending the π-conjugation32 or by combining electron-donating and electron-accepting moieties in the same conjugated ligand framework (so called ‘push–pull’ dyes).33 Here, we report the development of {Zn(tpy)2} sensitizers by moving from first generation ligands 3–7 to second generation analogues 8 and 9, and to the related ligand 10 which contains a benzothiadiazole spacer (Scheme 2). The chromophoric benzothiadiazole unit is well-established in organic dyes; its electron-withdrawing characteristics result in a red-shift in the absorption maximum with respect to analogous dyes without this domain.32–36
27,28 exhibit very low efficiencies, in part due to inadequate light-harvesting in the visible. A common strategy for enhancing light absorption is by extending the π-conjugation32 or by combining electron-donating and electron-accepting moieties in the same conjugated ligand framework (so called ‘push–pull’ dyes).33 Here, we report the development of {Zn(tpy)2} sensitizers by moving from first generation ligands 3–7 to second generation analogues 8 and 9, and to the related ligand 10 which contains a benzothiadiazole spacer (Scheme 2). The chromophoric benzothiadiazole unit is well-established in organic dyes; its electron-withdrawing characteristics result in a red-shift in the absorption maximum with respect to analogous dyes without this domain.32–36
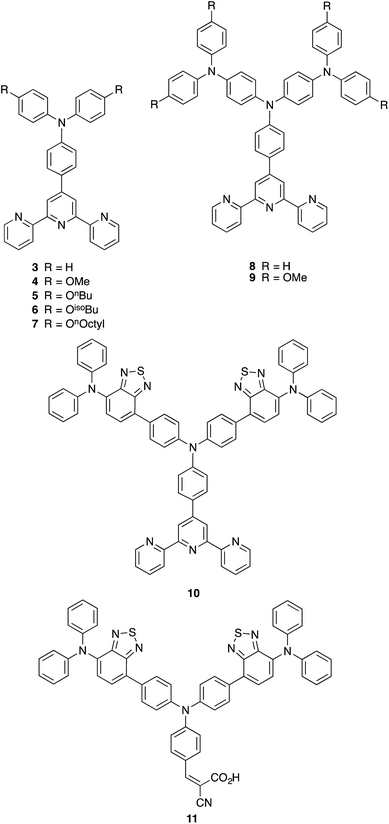 | ||
| Scheme 2 The structures of first-generation ancillary ligands 3–7, second generation ligands 8–10, and organic dye 11. | ||
Experimental
General
A Bruker Avance III-500 NMR spectrometer was used to record 1H and 13C NMR spectra, and chemical shifts were referenced to residual solvent peaks with respect to δ(TMS) = 0 ppm. MALDI-TOF mass spectra were recorded on Bruker Daltonics microflex instrument and electrospray ionization (ESI) mass spectra and high-resolution ESI mass spectra were measured using Bruker esquire 3000plus and Bruker maXis 4 G mass spectrometers. Solution absorption spectra were recorded with a Cary 5000 spectrophotometer and FT-IR spectra of solid samples on a Perkin Elmer UATR Two spectrometer. Electrochemical measurements were made using a CH Instruments 900B potentiostat with glassy carbon, platinum wire and silver wire as the working, counter, and reference electrodes, respectively. Samples were dissolved in HPLC grade CH2Cl2 (10−4 to 10−5 mol dm−3) containing 0.1 mol dm−3 [nBu4N][PF6] as the supporting electrolyte; all solutions were degassed with argon.Compound 1,27 4′-(4-bromophenyl)-2,2′:6′,2′′-terpyridine37 and 4,4′-bis(N,N-bis(4-methoxyphenyl)amino)diphenylamine11 were prepared as previously described, and compound 2 was supplied by M. Waser, FHNW, Basel. The syntheses of bis(4-(7-(diphenylamino)benzo[c][1,2,5]thiadiazol-4-yl)phenyl)amine (10a, Scheme 4) and 4-(bis(4-(7-(diphenylamino)benzo[c][1,2,5]thiadiazol-4-yl)phenyl)amino) benzaldehyde (Scheme 5) are described in the ESI.† Bis(dibenzylideneacetone)palladium(0), [Pd(dba)2] was purchased from Strem Chemicals.
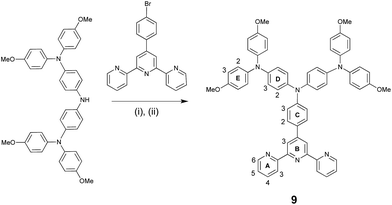 | ||
| Scheme 3 Synthetic route to compound 9. Conditions: (i) NaOtBu; (ii) [Pd(dba)2], PtBu3, toluene, 100 °C, 20 h. | ||
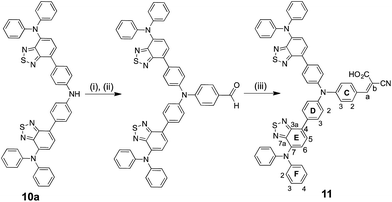 | ||
| Scheme 5 Synthetic route to compound 11. Conditions: (i) NaOtBu, 4-bromobenzaldehyde, [Pd(dba)2]; (ii) PtBu3, toluene, 100 °C, 20 h; (iii) cyanoacetic acid, piperidine, MeCN, reflux 4 days. | ||
Ground state density functional theory (DFT) calculations were performed using Spartan 14 (v. 1.1.8)38 at the B3LYP level with a 6-31G* basis set in vacuum. Initial structure minimization was carried out at a molecular mechanics or PM3 level.
Compound 9
Solid 4,4′-bis(N,N-bis(4-methoxyphenyl)amino)diphenylamine (150 mg, 0.234 mmol), 4′-(4-bromophenyl)-2,2′:6′,2′′-terpyridine (83.2 mg, 0.214 mmol), NaOtBu (67.9 mg, 0.707 mmol) and a catalytic amount of [Pd(dba)2] (4.93 mg, 8.57 μmol) were placed in a flask under N2. Dry degassed toluene (10 mL) and PtBu3 (8.57 μL 1 M solution in toluene, 8.57 μmol) were then added. The mixture was stirred for 3 days at 100 °C. The solvent was then removed under reduced pressure and the solid residue was recrystallized from acetone. The yellow solid was dissolved in CH2Cl2 (30 mL), washed with 6 M aqueous KOH (2 × 15 mL) and H2O (3 × 20 mL), and then dried over MgSO4. The solvent was removed under reduced pressure and 9 was isolated as a pale yellow solid (95.0 mg, 0.102 mmol, 47.7%). 1H NMR (500 MHz, THF-d8) δ/ppm 8.81 (s, 2H, HB3), 8.70 (m, 2H, HA3), 8.67 (ddd, J = 4.8, 1.8, 0.9 Hz, 2H, HA6), 7.89 (td, J = 7.7, 1.8 Hz, 2H, HA4), 7.75 (m, 2H, HC2), 7.35 (ddd, J = 7.5, 4.7, 1.2 Hz, 2H, HA5), 7.11 (m, 2H, HC3), 7.04 (m, 8H, HE2), 7.01 (m, 4H, HD2), 6.88 (m, 4H, HD3), 6.83 (m, 8H, HE3), 3.75 (s, 12H, HOMe). 13C NMR (126 MHz, THF-d8) δ/ppm 157.2 (CA2), 157.1 (CE4), 156.9 (CB2), 150.7 (CC1/C4), 150.5 (CC1/C4), 150.0 (CA6), 146.2 (CD4), 142.1 (CE1), 141.1 (CD1), 137.4 (CA4), 130.9 (CB4), 128.5 (CC2), 127.1 (CE2), 124.6 (CA5), 122.7 (CD3), 121.6 (CA3), 121.4 (CC3), 118.4 (CB3), 115.5 (CE3), 55.6 (COMe). UV-Vis (THF, 2.4 × 10⁻⁵ M) λmax/nm (ε/dm3 mol−1 cm−1) 296 (44![[thin space (1/6-em)]](https://www.rsc.org/images/entities/char_2009.gif) 700), 335 sh (29
700), 335 sh (29![[thin space (1/6-em)]](https://www.rsc.org/images/entities/char_2009.gif) 800), 382 sh (19
800), 382 sh (19![[thin space (1/6-em)]](https://www.rsc.org/images/entities/char_2009.gif) 200). ESI-MS positive mode: m/z: 930.9 [M + H]+ (calc. 931.4). MALDI-TOF MS m/z 931.1 [M + H]+ (calc. 931.4). HR ESI-MS positive mode: m/z 930.3884 [M]+ (calc. 930.3888), 953.3778 [M + Na]+ (calc. 953.3786). Satisfactory elemental analysis could not be obtained.
200). ESI-MS positive mode: m/z: 930.9 [M + H]+ (calc. 931.4). MALDI-TOF MS m/z 931.1 [M + H]+ (calc. 931.4). HR ESI-MS positive mode: m/z 930.3884 [M]+ (calc. 930.3888), 953.3778 [M + Na]+ (calc. 953.3786). Satisfactory elemental analysis could not be obtained.
Compound 10
Bis(4-(7-(diphenylamino)benzo[c][1,2,5]thiadiazol-4-yl)phenyl)amine (10a ESI†) (100 mg, 0.130 mmol), 4′-(4-bromophenyl)-2,2′:6′,2′′-terpyridine (55.3 mg, 0.142 mmol), NaOtBu (37.3 mg, 0.389 mmol) and [Pd(dba)2] (1.50 mg, 2.59 μmol) were placed in a flask under N2. Dry degassed toluene (10 mL) and PtBu3 (2.60 μL 1 M solution in toluene, 2.60 μmol) were added and the mixture was stirred overnight (≈16 h) at 100 °C. The hot reaction mixture was then filtered through a glass frit, which was subsequently rinsed with hot toluene. The combined solvents were removed from the filtrate under reduced pressure and the solid residue was recrystallized from acetone. Compound 10 was obtained as a red solid (40.0 mg, 37.1 μmol, 29%). 1H NMR (500 MHz, CD2Cl2) δ/ppm 8.78 (s, 2H, HB3), 8.72 (ddd, J = 4.7, 1.7, 0.9 Hz, 2H, HA6), 8.69 (m, 2H, HA3), 7.95 (m, 4H, HD3), 7.90 (overlapping m, 4H, HA4+C2), 7.66 (d, J = 7.8 Hz, 2H, HE5), 7.41–7.35 (overlapping m, 8H, HA5+D2+C3), 7.30–7.25 (overlapping m, 10H, HE6+F3), 7.11–7.05 (m, 12H, HF2+F4). 13C NMR (126 MHz, CD2Cl2) δ/ppm 156.6 (CA2+B2), 155.3 (CE3a), 152.2 (CE7a), 149.9 (CC1), 149.6 (CA6), 148.7 (CC4), 148.2 (CF1), 147.4 (CD1), 139.1 (CE4), 137.3 (CA4), 133.2 (CB4), 132.9 (CE7), 130.5 (CD3), 129.4 (CF3), 128.7 (CC2), 128.4 (CE5), 124.8 (CD2+C3), 124.7 (CE6), 124.4 (CF2), 124.3 (CA5), 123.6 (CF4), 121.5 (CA3), 118.5 (CB3), (CD4 not resolved). UV-Vis (CH2Cl2, 3 × 10⁻⁶ M) λmax/nm (ε/dm3 mol−1 cm−1) 247 (51![[thin space (1/6-em)]](https://www.rsc.org/images/entities/char_2009.gif) 200), 252 (51
200), 252 (51![[thin space (1/6-em)]](https://www.rsc.org/images/entities/char_2009.gif) 500), 304 (62
500), 304 (62![[thin space (1/6-em)]](https://www.rsc.org/images/entities/char_2009.gif) 200), 366 sh (21
200), 366 sh (21![[thin space (1/6-em)]](https://www.rsc.org/images/entities/char_2009.gif) 500), 488 (23
500), 488 (23![[thin space (1/6-em)]](https://www.rsc.org/images/entities/char_2009.gif) 000); (THF, 3 × 10⁻⁵ M) 302 (70
000); (THF, 3 × 10⁻⁵ M) 302 (70![[thin space (1/6-em)]](https://www.rsc.org/images/entities/char_2009.gif) 600), 334 sh (40
600), 334 sh (40![[thin space (1/6-em)]](https://www.rsc.org/images/entities/char_2009.gif) 600), 365 sh (27
600), 365 sh (27![[thin space (1/6-em)]](https://www.rsc.org/images/entities/char_2009.gif) 500), 489 (26
500), 489 (26![[thin space (1/6-em)]](https://www.rsc.org/images/entities/char_2009.gif) 100). MALDI-TOF MS: m/z 943.1 [M + H]+ (calc. 943.3). Found C 76.24, H 4.77, N 12.62; C69H46N10S2 requires C 76.79, H 4.30, N 12.98%.
100). MALDI-TOF MS: m/z 943.1 [M + H]+ (calc. 943.3). Found C 76.24, H 4.77, N 12.62; C69H46N10S2 requires C 76.79, H 4.30, N 12.98%.
Compound 11
Solid 4-(bis(4-(7-(diphenylamino)benzo[c][1,2,5]thiadiazol-4-yl)phenyl)amino)benzaldehyde ESI† (50.0 mg, 57.1 μmol) and cyanoacetic acid (10.7 mg, 126 μmol) were added to a flask under an N2 atmosphere. MeCN (60 mL) and a few drops of piperidine were added and the mixture was heated at reflux for 4 days. After cooling, the solvent was removed under reduced pressure and the red residue was purified by column chromatography (SiO2, CH2Cl2![[thin space (1/6-em)]](https://www.rsc.org/images/entities/char_2009.gif) :
:![[thin space (1/6-em)]](https://www.rsc.org/images/entities/char_2009.gif) MeOH 10
MeOH 10![[thin space (1/6-em)]](https://www.rsc.org/images/entities/char_2009.gif) :
:![[thin space (1/6-em)]](https://www.rsc.org/images/entities/char_2009.gif) 1). After removal of the solvent, compound 11 was isolated as a red solid (30.0 mg, 31.8 μmol, 56%). 1H NMR (500 MHz, DMSO-d6) δ/ppm 8.08 (s, 1H, Ha), 8.03 (m, 4H, HD2), 7.96 (m, 2H, HC2), 7.83 (d, J = 7.8 Hz, 2H, HE5), 7.36 (m, 4H, HD3), 7.30 (m, 8H, HF3), 7.26 (d, J = 7.7 Hz, 2H, HE6), 7.12 (m, 2H, HC3), 7.07 (m, 4H, HF4), 7.01 (m, 8H, HF2). 13C NMR (126 MHz, DMSO-d6) δ/ppm 164.0 (CC
1). After removal of the solvent, compound 11 was isolated as a red solid (30.0 mg, 31.8 μmol, 56%). 1H NMR (500 MHz, DMSO-d6) δ/ppm 8.08 (s, 1H, Ha), 8.03 (m, 4H, HD2), 7.96 (m, 2H, HC2), 7.83 (d, J = 7.8 Hz, 2H, HE5), 7.36 (m, 4H, HD3), 7.30 (m, 8H, HF3), 7.26 (d, J = 7.7 Hz, 2H, HE6), 7.12 (m, 2H, HC3), 7.07 (m, 4H, HF4), 7.01 (m, 8H, HF2). 13C NMR (126 MHz, DMSO-d6) δ/ppm 164.0 (CC![[double bond, length as m-dash]](https://www.rsc.org/images/entities/char_e001.gif) O), 154.2 (CE3a), 151.1 (CE7a), 150.3 (Ca), 150.1 (CC4), 147.3 (CF1), 145.4 (CD1), 138.3 (CE7), 133.6 (CD4), 132.4 (CC1), 132.1 (CC2), 130.4 (CD2), 129.4 (CF3), 128.7 (CE5), 127.9 (CE4), 125.4 (CD3), 124.1 (CE6), 123.6 (CF2), 123.3 (CF4), 120.6 (CC3), 118.1 (CC
O), 154.2 (CE3a), 151.1 (CE7a), 150.3 (Ca), 150.1 (CC4), 147.3 (CF1), 145.4 (CD1), 138.3 (CE7), 133.6 (CD4), 132.4 (CC1), 132.1 (CC2), 130.4 (CD2), 129.4 (CF3), 128.7 (CE5), 127.9 (CE4), 125.4 (CD3), 124.1 (CE6), 123.6 (CF2), 123.3 (CF4), 120.6 (CC3), 118.1 (CC![[triple bond, length as m-dash]](https://www.rsc.org/images/entities/char_e002.gif) N); Cb not resolved. UV-Vis (THF, 1 × 10⁻⁵ M) λmax/nm (ε/dm3 mol−1 cm−1) 310 (25
N); Cb not resolved. UV-Vis (THF, 1 × 10⁻⁵ M) λmax/nm (ε/dm3 mol−1 cm−1) 310 (25![[thin space (1/6-em)]](https://www.rsc.org/images/entities/char_2009.gif) 600), 328 sh (16
600), 328 sh (16![[thin space (1/6-em)]](https://www.rsc.org/images/entities/char_2009.gif) 900), 431 (15
900), 431 (15![[thin space (1/6-em)]](https://www.rsc.org/images/entities/char_2009.gif) 300), 482 (16
300), 482 (16![[thin space (1/6-em)]](https://www.rsc.org/images/entities/char_2009.gif) 100). MALDI-TOF MS: m/z 942.1 [M]+ (calc. 942.3). HR ESI-MS negative mode: 941.2470 [M − H]− (calc. 941.2486). Satisfactory elemental analysis could not be obtained.
100). MALDI-TOF MS: m/z 942.1 [M]+ (calc. 942.3). HR ESI-MS negative mode: 941.2470 [M − H]− (calc. 941.2486). Satisfactory elemental analysis could not be obtained.
DSC fabrication
DSCs were made using a similar method to that reported.28 Full details are given in the ESI.†Results and discussion
Ancillary ligand synthesis and characterization
We have recently reported the beneficial effects of incorporating first- or second-generation hole transporting dendrons into the periphery of 2,2′-bipyridine-based copper(I) sensitizers in DSCs,13 and the use of a co-adsorbant to alleviate steric crowding of these dyes on the semiconductor surface.16 In this and related work,12 we have found Hartwig–Buchwald aminations to be a reliable method of coupling diarylamino building blocks to 4-bromophenyl-functionalized 2,2′-bipyridine or 1,10-phenanthroline domains. We have applied an analogous strategy to prepare first generation ligands 3–7 (Scheme 2).27,28 However, after several attempts to prepare the second generation ligand 8 (Scheme 2) using a Hartwig–Buchwald amination of 4,4′-bis(N,N-diphenylamino)diphenylamine with 4′-(4-bromophenyl)-2,2′:6′,2′′-terpyridine, we were unable to isolate a pure product. We therefore turned our attention to the synthesis of the methoxy-decorated ligand 9.Hartwig–Buchwald amination of 4,4′-bis(N,N-bis(4-methoxyphenyl)amino)diphenylamine11 with 4′-(4-bromophenyl)-2,2′:6′,2′′-terpyridine (Scheme 3) ESI† yielded 9 in 43% yield after workup. The highest mass peak in the electrospray mass spectrum of 9 (m/z = 930.9) was assigned to the [M + H]+ ion, and high resolution ESI MS also confirmed the molecular mass. The 1H and 13C NMR spectra of a THF-d8 solution of 9 were consistent with the C2-symmetric structure shown in Scheme 2, and were assigned by COSY, NOESY, HMQC and HMBC methods. The aromatic region of the 1H NMR spectrum is shown in Fig. 2; the methoxy protons give rise to a singlet at δ 3.75 ppm. NOESY cross-peaks between the pairs of protons HB3/HC2, HC3/HD2 and HD3/HE2 (see Scheme 3 for labels) allowed protons in the phenyl rings to be unambiguously assigned. The assignments were confirmed using the HMBC spectrum starting with the high-frequency 13C NMR signal for CE4 (δ 157.1 ppm) which showed a strong correlation to HE2, and similarly for cross-peaks CD4/HD2 and CD1/HD3.
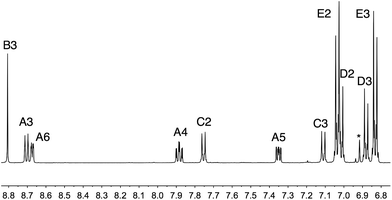 | ||
| Fig. 2 The aromatic region of the 500 MHz 1H NMR spectrum of 9 in THF-d8 (295 K). See Scheme 3 for atom labelling. * = residual impurity. | ||
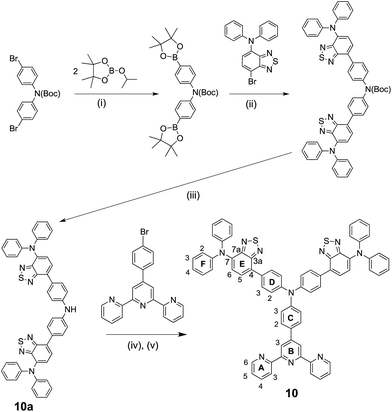
The synthetic route to compound 10 is summarized in Scheme 4. The secondary amine 10a required for a Hartwig–Buchwald amination with 4′-(4-bromophenyl)-2,2′:6′,2′′-terpyridine was prepared starting from the Boc-protected bis(4-bromophenyl)amine. Substitution of the bromo-groups for boronic acid pinacolate esters, followed by a Suzuki coupling39–41 with two equivalents of 7-(4-bromophenyl)-N,N-diphenylbenzo[c][1,2,5]thiadiazol-4-amine resulted in the formation of the Boc-protected precursor to 10a. Attempts to carry out the deprotection using excess trifluoroacetic acid failed, but heating the Boc-protected precursor42 at 210 °C in the absence of solvent gave 10a which was used in the Hartwig–Buchwald step without further purification. Compound 10 was isolated as a red solid in 29% yield. The base peak (m/z 943.1) in the MALDI-TOF mass spectrum was assigned to the [M + H]+ ion. The 1H and 13C NMR spectra were assigned using the COSY, NOESY, HMQC and HMBC spectra, with NOESY cross-peaks between pairs of protons HB3/HC2 and HE5/HD3 allowing unequivocal assignments of the protons in arene rings C, D and E (see Scheme 4).
Photophysical and electrochemical properties of 9 and 10
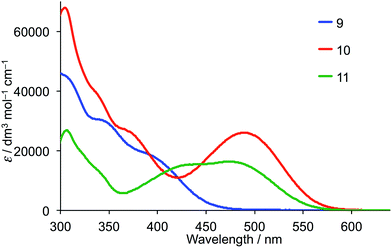
The solution absorption spectra of ancillary ligands 9 and 10 are compared in Fig. 3. Compared to the absorption spectrum of 4′-phenyl-2,2′:6′,2′′-terpyridine,43 that of 9 extends into the visible region as a result of the introduction of 4′-(4-(N,N-di(4-methoxyphenyl)amino)phenyl) substituents and consistent with the spectrum of the first generation analogue 4 (Scheme 2). Compounds 4 and 9 exhibit typical intra-ligand charge transfer (ILCT) bands with the tertiary amine functioning as an electron donor.44 Introduction of the benzothiadiazole unit in 10 extends the spectral response. The broad and intense absorption with λmax = 489 nm (εmax = 26![[thin space (1/6-em)]](https://www.rsc.org/images/entities/char_2009.gif) 100 dm3 mol−1 cm−1) arises from charge transfer45,46 and the lower energy bands from π* ← π transitions. The spectrum is consistent with those of the related compounds.45,46
100 dm3 mol−1 cm−1) arises from charge transfer45,46 and the lower energy bands from π* ← π transitions. The spectrum is consistent with those of the related compounds.45,46
Compounds 9 and 10 are electrochemically active and cyclic voltammetric (CV) data are presented in Table 1 and in Fig. S1;† processes are reversible unless otherwise stated. The reduction process at −1.96 V in 10 (absent in 9) arises from reversible reduction of the benzothiadiazole unit.45,47 The reversible oxidations are centred on the diphenylamine units. Of the oxidations observed for 9 or 10, the lowest potential process (+0.22 V) is for 9 which is consistent with the presence of the electron-releasing methoxy substituents. In order to support these conclusions, density functional theory (DFT) calculations were run at the B3LYP/6-31G* level. The orbital compositions of the HOMO and LUMO of each of 9 and 10 are shown in Fig. 4. The HOMO in 9 is delocalized over the 4,4′-bis(N,N-bis(4-methoxyphenyl)amino)diphenylamino dendron (Fig. 4a), and the compositions of the HOMO−1 and HOMO−2 are similar (Fig. S2†). The LUMO is based on the tpy domain (Fig. 4b) and the associated reduction process is presumably outside the solvent accessible window. In 10, the orbital contributions to the HOMO manifold (Fig. 4 and S2†) are similar to those on 9, and both the LUMO (Fig. 4d) and LUMO+1 are localized on the benzothiadiazole units.
| Compound | E ox1/2/V | E ox1/2/V | E ox1/2/V | E red1/2/V |
|---|---|---|---|---|
| 9 | +0.22 | +0.70qr | +1.06irr | |
| 10 | +0.37 | +0.52 | +0.69 | −1.96 |
| 11 | +0.47 | +0.55 | +0.71 | −1.91 |
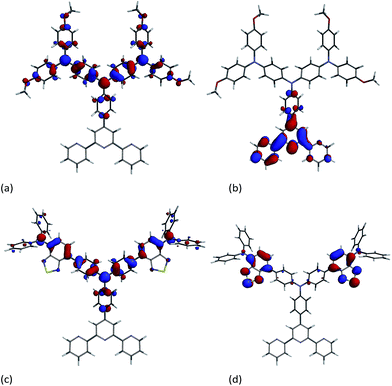 | ||
| Fig. 4 Molecular orbital compositions of the (a) HOMO in 9; (b) LUMO in 9, (c) HOMO in 10, and (d) LUMO in 10. | ||
DSC fabrication and performance
Heteroleptic surface-bound [Zn(Lanchor)(Lancillary)]2+ complexes were assembled in a stepwise manner on an FTO/TiO2 electrode using our ‘surfaces-as-ligands’ strategy.17,28 The electrode was initially immersed in a DMSO solution of 1![[thin space (1/6-em)]](https://www.rsc.org/images/entities/char_2009.gif) 27 or 2
27 or 2![[thin space (1/6-em)]](https://www.rsc.org/images/entities/char_2009.gif) 48 (Scheme 1), and then the ligand-functionalized electrode was dipped into an EtOH solution of ZnCl2 to give a surface bound [Zn(Lanchor)Cl2] complex (Fig. 1). Finally, the electrode was dipped for ca. 43 hours in either a CH2Cl2 solution of 9 or a THF solution of 10, the solvent being chosen according to the solubility of the ancillary ligand. During this dipping cycle, the initially colourless TiO2 layer changed to yellow-orange. The colour persisted when the electrode was dried, consistent with the formation of a surface-bound [Zn(Lanchor)(Lancillary)]2+ complex (Fig. 1). We note that the protonation state of surface-bound 1 and 2 is ambiguous and formulation of the dyes as [Zn(1)(9)]2+, [Zn(1)(10)]2+, [Zn(2)(9)]2+ and [Zn(2)(10)]2+ assumes full protonation.
48 (Scheme 1), and then the ligand-functionalized electrode was dipped into an EtOH solution of ZnCl2 to give a surface bound [Zn(Lanchor)Cl2] complex (Fig. 1). Finally, the electrode was dipped for ca. 43 hours in either a CH2Cl2 solution of 9 or a THF solution of 10, the solvent being chosen according to the solubility of the ancillary ligand. During this dipping cycle, the initially colourless TiO2 layer changed to yellow-orange. The colour persisted when the electrode was dried, consistent with the formation of a surface-bound [Zn(Lanchor)(Lancillary)]2+ complex (Fig. 1). We note that the protonation state of surface-bound 1 and 2 is ambiguous and formulation of the dyes as [Zn(1)(9)]2+, [Zn(1)(10)]2+, [Zn(2)(9)]2+ and [Zn(2)(10)]2+ assumes full protonation.
A set of electrodes prepared using TiO2 without a scattering layer was prepared in the same manner as those used in the DSCs, and their solid state absorption spectra were recorded. The spectra of dyes [Zn(1)(9)]2+ and [Zn(2)(9)]2+ are essentially identical, as are those of [Zn(1)(10)]2+ and [Zn(2)(10)]2+ (Fig. 5), consistent with the fact that, above 350 nm, the ancillary ligands dominate the absorption. The beneficial effects of the thiadiazole units are seen in the enhanced absorbance above 400 nm, with maxima at 472 nm for [Zn(1)(10)]2+ and 465 nm for [Zn(2)(10)]2+. These maxima correlate with the charge transfer band at 489 nm in the solution spectrum of ligand 10 (Fig. 3). Fig. 5 also shows the solid-state absorption spectrum of an electrode with adsorbed dye N719, confirming that while the spectral response of the dyes is enhanced by incorporating the thiadiazole domains, it remains inferior to that of N719.
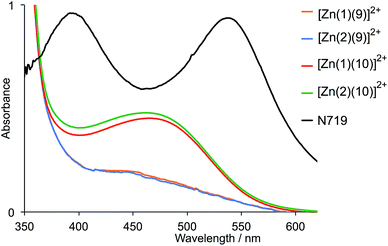 | ||
| Fig. 5 Solid-state absorption spectra of FTO/TiO2 electrodes functionalized with the dyes [Zn(1)(9)]2+, [Zn(2)(9)]2+, [Zn(1)(10)]2+, [Zn(2)(10)]2+ or N719. | ||
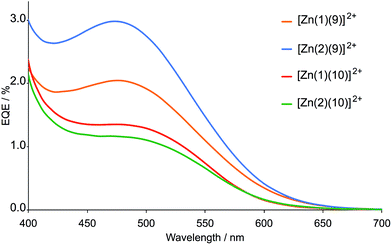
The DSC measurements were made using sealed and fully masked49–51 cells with an I−/I3− redox couple. Parameters of cells containing the zinc(II)-based dyes were compared with those of a DSC containing N719 (Table 3 and 4). Duplicate cells were measured for each dye and the efficiencies of the DSCs were remeasured 2, 3 and 10 or 17 days after sealing. External quantum efficiency (EQE) spectra are shown in Fig. 6. For clarity, only the EQE spectrum of the DSC with the highest EQEmax for each pair of cells is shown; the same trend in values is observed for both cells, differences falling within the limits of the errors of the measurements. Fig. 7 shows plots of the short-circuit current density (JSC) against open-circuit voltage (VOC) for DSCs containing [Zn(1)(10)]2+ and [Zn(2)(10)]2+.
| Anchored dye | Cell | J SC/mA cm−2 | V OC/mV | ff/% | η/% | Relative η/% |
|---|---|---|---|---|---|---|
| On the day of sealing the cell | ||||||
| [Zn(1)(9)]2+ | 1 | 0.53 | 380 | 67 | 0.14 | 1.80 |
| [Zn(1)(9)]2+ | 2 | 0.55 | 375 | 68 | 0.14 | 1.80 |
| [Zn(2)(9)]2+ | 1 | 0.82 | 415 | 68 | 0.23 | 3.00 |
| [Zn(2)(9)]2+ | 2 | 0.82 | 408 | 68 | 0.23 | 3.00 |
| N719 | 17.17 | 635 | 70 | 7.68 | 100 | |
| 3 days After sealing the cell | ||||||
| [Zn(1)(9)]2+ | 1 | 0.44 | 377 | 69 | 0.11 | 1.38 |
| [Zn(1)(9)]2+ | 2 | 0.45 | 374 | 69 | 0.12 | 1.51 |
| [Zn(2)(9)]2+ | 1 | 0.81 | 427 | 69 | 0.24 | 3.02 |
| [Zn(2)(9)]2+ | 2 | 0.70 | 407 | 67 | 0.19 | 2.39 |
| N719 | 16.72 | 674 | 71 | 7.94 | 100 | |
| 10 days After sealing the cell | ||||||
| [Zn(1)(9)]2+ | 1 | 0.43 | 375 | 68 | 0.11 | 1.36 |
| [Zn(1)(9)]2+ | 2 | 0.45 | 380 | 69 | 0.12 | 1.48 |
| [Zn(2)(9)]2+ | 1 | 0.81 | 428 | 70 | 0.24 | 2.96 |
| [Zn(2)(9)]2+ | 2 | 0.71 | 407 | 68 | 0.20 | 2.47 |
| N719 | 16.71 | 690 | 70 | 8.11 | 100 | |
| Anchored dye | Cell | J SC/mA cm−2 | V OC/mV | ff/% | η/% | Relative η/% |
|---|---|---|---|---|---|---|
| On the day of sealing the cell | ||||||
| [Zn(1)(10)]2+ | 1 | 0.52 | 366 | 64 | 0.12 | 1.70 |
| [Zn(1)(10)]2+ | 2 | 0.52 | 390 | 67 | 0.13 | 2.02 |
| [Zn(2)(10)]2+ | 1 | 0.45 | 396 | 67 | 0.12 | 1.70 |
| [Zn(2)(10)]2+ | 2 | 0.46 | 385 | 67 | 0.12 | 1.70 |
| N719 | 14.93 | 632 | 68 | 6.42 | 100 | |
| 3 days After sealing the cell | ||||||
| [Zn(1)(10)]2+ | 1 | 0.43 | 385 | 68 | 0.11 | 1.69 |
| [Zn(1)(10)]2+ | 2 | 0.43 | 382 | 70 | 0.11 | 1.69 |
| [Zn(2)(10)]2+ | 1 | 0.43 | 412 | 70 | 0.13 | 1.99 |
| [Zn(2)(10)]2+ | 2 | 0.43 | 388 | 69 | 0.11 | 1.69 |
| N719 | 14.82 | 646 | 68 | 6.52 | 100 | |
| 17 days After sealing the cell | ||||||
| [Zn(1)(10)]2+ | 1 | 0.38 | 382 | 70 | 0.10 | 1.62 |
| [Zn(1)(10)]2+ | 2 | 0.38 | 383 | 70 | 0.10 | 1.62 |
| [Zn(2)(10)]2+ | 1 | 0.40 | 416 | 72 | 0.12 | 1.95 |
| [Zn(2)(10)]2+ | 2 | 0.41 | 400 | 70 | 0.11 | 1.72 |
| N719 | 13.96 | 643 | 69 | 6.15 | 100 | |
| J SC/mA cm−2 | V OC/mV | ff/% | η/% | Relative η/% | |
|---|---|---|---|---|---|
| On the day of sealing the cell | |||||
| Cell 1 | 0.31 | 460 | 69 | 0.10 | 1.56 |
| Cell 2 | 0.43 | 503 | 71 | 0.16 | 2.50 |
| N719 | 14.93 | 632 | 68 | 6.42 | 100 |
| 3 days After sealing the cell | |||||
| Cell 1 | 0.37 | 474 | 70 | 0.12 | 1.84 |
| Cell 2 | 0.39 | 485 | 71 | 0.13 | 1.99 |
| N719 | 14.82 | 646 | 68 | 6.52 | 100 |
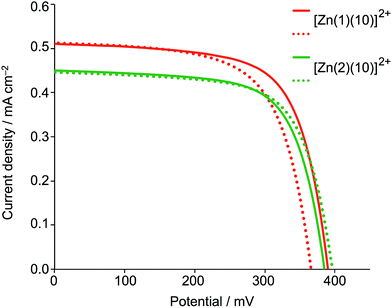 | ||
| Fig. 7 J–V curves for duplicate DSCs containing the dyes [Zn(1)(10)]2+ and [Zn(2)(10)]2+ measured on the day of assembling the cells. | ||
Good fill factors (ff) of ca. 70%. were obtained for all the DSCs (Table 2 and 3), but values of VOC are low (ca. 400 mV, Table 2 and 3, and Fig. 7). Values of JSC were <1 mA cm−2 (compared with 15–17 mA cm−2 for N719). The DSCs show very low EQE values (≤3%, Fig. 6), and in contrast to the enhanced absorption of the dyes containing ligand 10versus9, the trends in values of EQEmax are reversed (compare Fig. 5 and 6). This is consistent with the lower values of JSC for the dyes containing ancillary ligand 10 (Table 2 and 3). We rationalize this observation in terms of the positioning of the thiadiazole domain in the ancillary ligand. Although it leads to enhanced absorption in the visible region, its electron-withdrawing effect reduces electron transfer from the ancillary ligand over the metal centre and subsequently reduces electron injection into the TiO2.
The choice of anchoring ligand makes little difference to the performance of the dyes containing ancillary ligand 10. However, a combination of ancillary ligand 9 with phosphonic acid anchor 2 leads to slightly better dye performance than with carboxylic acid anchor 1 (Table 1). Both JSC and (to a lesser extent) VOC are enhanced on going from carboxylic to phosphonic acid anchor. However, for all the dyes, performance was disappointingly poor, although better than with first generation ancillary ligands 4–7.28
In order to verify the validity of the DSC measurements, parameters of two blank cells (i.e. FTO/TiO2 without adsorbed dye) were recorded (Table 4). A comparison of data in Tables 2–4 demonstrates that there are negligible differences between the parameters obtained for the blank cells and some of the DSCs containing the zinc(II) dyes. The results underline the difficulties of measuring parameters for poorly performing sensitizers. However, we note that the EQE spectra of dyes [Zn(1)(9)]2+, [Zn(2)(9)]2+, [Zn(1)(10)]2+ and [Zn(2)(10)]2+ confirm that electron injection (albeit small) does occur. Only for [Zn(2)(9)]2+ was the efficiency higher than the blank cell and this is due to a higher value of JSC.
HOMO and LUMO characteristics of the zinc(II) dyes
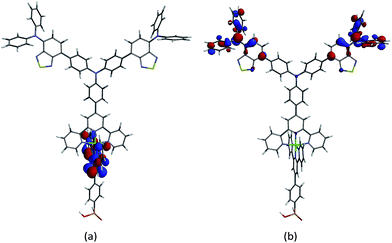
Ground state DFT calculations on the zinc(II) dyes [Zn(2)(9)]2+ and [Zn(2)(10)]2+ were carried out to gain some insight into their poor DSC performances. In a detailed theoretical study of two representative bis(diimine) copper(I) sensitizers, we demonstrated that the calculated absorption spectra of the dyes depend upon the atomic orbital basis set (6-311++G** basis set on all atoms, 6-311++G** on copper and 6-31G* basis set on C, H and N, or 6-31G* basis set on all atoms) but that the influence on the orbital compositions of the HOMOs and LUMOs are little altered.52 For a qualitative evaluation of the MOs of [Zn(1)(9)]2+, [Zn(1)(10)]2+, [Zn(2)(9)]2+ and [Zn(2)(10)]2+, we have used a 6-31G* basis set on all atoms.15In their ground state, each of the complexes exhibits a LUMO centred on the anchoring ligand (Fig. 8a and Fig. S3a–S5a†) although it is localized on the tpy domain rather than the carboxylic or phosphonic acid units which would be optimal for electron injection. The HOMO is localized on the peripheral diphenylamino groups of the ancillary ligand (Fig. 8b and Fig. S3b–S5b†) which should facilitate hole-transfer over these domains to the reduced electrolyte. In each complex, the characters of the filled MOs lying immediately below the HOMO are also dominated by contributions from the peripheral groups of the ancillary ligands.
From the zinc(II) dye containing 10 to organic dye 11
Although the poor performances of the zinc(II) dyes containing second generation ancillary ligands 9 and 10 were discouraging, we decided to capitalize on the absorption properties imparted by dendron 10a by combining this domain with a 2-cyanoacrylic acid anchoring unit to give the organic dye 11 (Scheme 2). Compound 11 was prepared by the route shown in Scheme 5. 4-Bromobenzaldehyde and 10a were reacted under Hartwig–Buchwald amination conditions, and the resulting aldehyde treated with 2-cyanoacetic acid in the presence of piperidine in a Knoevenagel condensation.53 Compound 11 was isolated as a red solid in 56% yield.The highest mass peak envelope in the negative mode high resolution ESI mass spectrum of 11 was observed at m/z 941.2470, consistent with the [M − H]− ion. The 1H and 13C NMR spectra were assigned using NOESY, COSY, HMQC and HMBC spectra. The 2-cyanoacrylic acid anchoring group was characterized by 13C NMR resonances with the C![[double bond, length as m-dash]](https://www.rsc.org/images/entities/char_e001.gif) O and C
O and C![[triple bond, length as m-dash]](https://www.rsc.org/images/entities/char_e002.gif) N groups at δ 164.0 and 118.1 ppm, respectively. The 1H NMR spectrum is shown in Fig. 9, and is consistent with the presence of the benzothiadiazole units and two generations of amino domains. The cyclic voltammogram of 11 was recorded in CH2Cl2 and exhibited a reversible reduction at −1.91 V; this potential is close to that for the first reduction of 10 (Table 1) and is assigned to a benzothiadiazole-based process. Within the solvent accessible window, compound 11 exhibits three oxidation processes at potentials similar to those for 10 (Table 1) and are, presumably, based on the diphenylamino-containing domains. These assignments are corroborated by the results of the DFT calculations discussed below.
N groups at δ 164.0 and 118.1 ppm, respectively. The 1H NMR spectrum is shown in Fig. 9, and is consistent with the presence of the benzothiadiazole units and two generations of amino domains. The cyclic voltammogram of 11 was recorded in CH2Cl2 and exhibited a reversible reduction at −1.91 V; this potential is close to that for the first reduction of 10 (Table 1) and is assigned to a benzothiadiazole-based process. Within the solvent accessible window, compound 11 exhibits three oxidation processes at potentials similar to those for 10 (Table 1) and are, presumably, based on the diphenylamino-containing domains. These assignments are corroborated by the results of the DFT calculations discussed below.
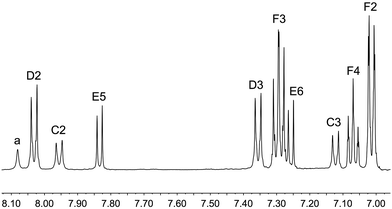 | ||
| Fig. 9 The 500 MHz 1H NMR spectrum of 11 in DMSO-d6 (295 K). See Scheme 5 for atom labelling. | ||
The solution absorption spectrum of 11 (Fig. 3) is dominated by intense high energy bands assigned to π* ← π transitions and a broad CT band with maxima at 431 and 482 nm. The solid-state absorption spectrum of an FTO/TiO2 electrode (which appears bright red by eye) consists of a very broad and intense CT band centred at 460 nm (Fig. S6†) and shows extended spectral response in the red region with respect to the solution absorption (Fig. 3).
Two DSCs incorporating 11 as the sensitizer, and a reference electrode with N719 were fabricated. The performance data in Table 5 confirm the reproducibility of the DSCs and reveal that sensitizer 11 achieves photon-to-current conversion efficiencies that are ≈70% relative to 100% for N719. The J–V curves in Fig. 10 demonstrate good fill factors, and high values of both JSC and VOC. The DSCs were monitored over a 17 day period and remained stable; no bleaching of the cells was observed. The antenna structure in 11 and the presence of the electron-withdrawing thiadiazole domains contribute to effective electronic communication and electron injection. The EQE spectra for the two DSCs containing 11 (Fig. 11) confirm with enhanced electron injection across a broad spectral region. The broad EQE spectrum correlates well with the solid-state absorption spectrum (Fig. S6†). Moving the thiadiazole units closer to the anchoring domain should have beneficial effects and we are currently investigating this and other structural modifications as a means of enhancing dye performance.
| J SC/mA cm−2 | V OC/mV | ff/% | η/% | Relative η/% | |
|---|---|---|---|---|---|
| On the day of sealing the cell | |||||
| Cell 1 | 10.12 | 613 | 71 | 4.40 | 68.6 |
| Cell 2 | 10.23 | 613 | 71 | 4.48 | 69.8 |
| N719 | 14.93 | 632 | 68 | 6.42 | 100 |
| 2 days After sealing the cell | |||||
| Cell 1 | 9.73 | 599 | 72 | 4.21 | 64.6 |
| Cell 2 | 10.16 | 624 | 72 | 4.57 | 70.1 |
| N719 | 14.82 | 646 | 68 | 6.52 | 100 |
| 17 days After sealing the cell | |||||
| Cell 1 | 9.04 | 598 | 73 | 3.93 | 63.7 |
| Cell 2 | 9.55 | 610 | 72 | 4.21 | 68.5 |
| N719 | 13.96 | 643 | 69 | 6.15 | 100 |
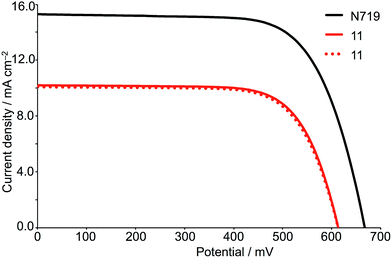 | ||
| Fig. 10 J–V curves for DSCs containing 11 compared to N719, measured on the day of assembling the cells. | ||
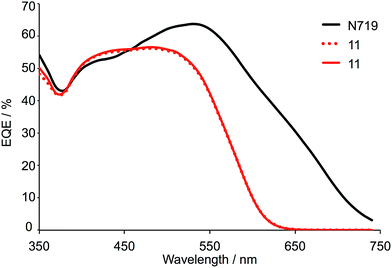 | ||
| Fig. 11 EQE spectra of DSCs containing 11 compared to N719, measured on the day of assembling the cells. | ||
HOMO and LUMO characteristics of organic dye 11
Ground state DFT calculations on 11 reveal that the LUMO and LUMO+1 are close in energy and their combined character is predominantly localized on the 2-cyanoacrylic acid anchoring domain and on the benzothiadiazole groups (Fig. 12a). The HOMO is delocalized as depicted in Fig. 12b, while the HOMO−1 possesses character mainly on the peripheral diphenylamino units. The orbital compositions of the HOMO and LUMO manifolds correspond to what is required, respectively, for efficient hole-transfer over the peripheral diphenylamino units to the reduced electrolyte, and localization of the electron on the anchoring domain after excitation. A distinction between the characteristics of the lowest lying virtual MOs in dye 11 and the four zinc(II) complexes is the dominant contribution from the anchor domain in 11 (Fig. 12a) versus the localization of the LUMO close to the metal centre in the heteroleptic dyes (Fig. 8a).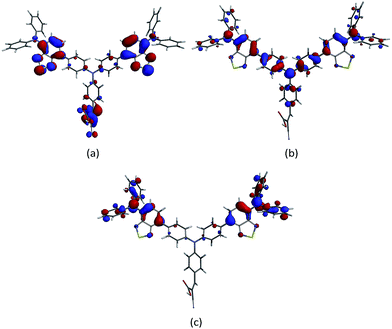 | ||
| Fig. 12 Molecular orbital compositions in compound 11 of (a) the summation of LUMO and LOMO+1, (b) HOMO, and (c) HOMO−1. | ||
Conclusions
Two tpy ligands 9 and 10 incorporating second-generation diphenylamino-dendrons have been synthesized and characterized. Using the ‘surface-as-ligand, surface-as-complex’ strategy, the sensitizers [Zn(1)(9)]2+, [Zn(2)(9)]2+, [Zn(1)(10)]2+ and [Zn(2)(10)]2+ have been assembled and tested in n-type DSCs. The solid-state absorption spectra of dye-functionalized electrodes confirm a broad spectral response for all the dyes with enhanced intensity for the dyes containing ancillary ligand 10. A change from the carboxylic acid anchor 1 to phosphonic acid anchor 2 has little effect on light absorption. The dyes perform poorly, with very low JSC and VOC. The EQE spectra confirm that [Zn(1)(9)]2+ and [Zn(2)(9)]2+ exhibit better electron injection than [Zn(1)(10)]2+ and [Zn(2)(10)]2+. In part, this is probably a consequence of the non-optimal positioning of the thiadiazole domain in the dye. Interpretation of the DSC parameters for this set of dyes highlights a problem that is often ignored when reporting global efficiencies of poor dyes; DSCs incorporating FTO/TiO2 photoanodes without adsorbed dye generate small short-circuit current densities and open-circuit voltages which contribute to parameters reported for inefficient dyes.Organic dye 11 is structurally similar to ancillary ligand 10 and has an excellent spectral response in the range 300–600 nm. EQE data for 11 evidence efficient electron injection over a broad wavelength range, comparable with N719 except above 600 nm. DSCs containing 11 are stable over at least 17 days and show global efficiencies of 3.93–4.57% (ca. 70% with respect to N719 set at 100%).
Ground state DFT calculations demonstrate that each of [Zn(1)(9)]2+, [Zn(2)(9)]2+, [Zn(1)(10)]2+, [Zn(2)(10)]2+ and 11 possesses a HOMO localized on the peripheral diphenylamino units. In 11, a dominant contribution from the 2-cyanoacrylic acid anchoring group appears in the lowest lying virtual MOs; in each zinc(II) dye, the LUMO resides on the anchoring ligand but is concentrated on the tpy domain close to the metal centre which may militate against good electron injection.
Acknowledgements
We acknowledge the European Research Council (Advanced Grant 267816 LiLo), the Swiss National Science Foundation (200020_144500 and as part of the NCCR Molecular Systems Engineering) and the University of Basel for support, and thank M. Waser, FHNW, Basel for the preparation of ligand 2. Sebastian Furer and Dr Collin D. Morris are acknowledged for help with ESI MS, and Dr Heinz Nadig is thanked for recording high resolution mass spectra.Notes and references
- B. O'Regan and M. Grätzel, Nature, 1991, 353, 737 CrossRef.
- A. Hagfeldt and M. Grätzel, Chem. Rev., 1995, 95, 49 CrossRef CAS.
- S. K. Balasingam, M. Lee, M. G. Kang and Y. Jun, Chem. Commun., 2013, 49, 1471 RSC.
- H. J. Snaith, Adv. Funct. Mater., 2010, 20, 13 CrossRef CAS.
- T. Stergiopoulos and P. Falaras, Adv. Energy Mater., 2012, 2, 616 CrossRef CAS.
- G. Boschloo and A. Hagfeldt, Acc. Chem. Res., 2009, 42, 1819 CrossRef CAS PubMed.
- Z.-S. Wang, K. Sayama and H. Sugihara, J. Phys. Chem. B, 2005, 109, 22449 CrossRef CAS PubMed.
- P. Qin, X. Yang, R. Chen, L. Sun, T. Marinado, T. Edvinsson, G. Boschloo and A. Hagfeldt, J. Phys. Chem. C, 2007, 111, 1853 CAS.
- A. Hagfeldt, G. Boschloo, L. Sun, L. Kloo and H. Pettersson, Chem. Rev., 2010, 110, 6595 CrossRef CAS PubMed.
- B. Bozic-Weber, E. C. Constable and C. E. Housecroft, Coord. Chem. Rev., 2013, 257, 3089 CrossRef CAS , and references therein.
- B. Bozic-Weber, S. Brauchli, E. C. Constable, S. O. Fürer, C. E. Housecroft and I. A. Wright, Phys. Chem. Chem. Phys., 2013, 15, 4500 RSC.
- B. Bozic-Weber, E. C. Constable, S. O. Fürer, C. E. Housecroft, L. J. Troxler and J. A. Zampese, Chem. Commun., 2013, 49, 7222 RSC.
- S. Y. Brauchli, B. Bozic-Weber, E. C. Constable, N. Hostettler, C. E. Housecroft and J. A. Zampese, RSC Adv., 2014, 4, 34801 RSC.
- F. J. Malzner, S. Y. Brauchli, E. Schönhofer, E. C. Constable and C. E. Housecroft, Polyhedron, 2014, 82, 116 CrossRef CAS.
- F. J. Malzner, S. Y. Brauchli, E. C. Constable, C. E. Housecroft and M. Neuburger, RSC Adv., 2014, 4, 48712 RSC.
- S. Y. Brauchli, F. J. Malzner, E. C. Constable and C. E. Housecroft, RSC Adv., 2014, 4, 62728 RSC.
- E. Schönhofer, B. Bozic-Weber, C. J. Martin, E. C. Constable, C. E. Housecroft and J. A. Zampese, Dyes Pigm., 2015, 115, 154 CrossRef.
- S. Y. Brauchli, E. C. Constable and C. E. Housecroft, Dyes Pigm., 2015, 113, 447 CrossRef CAS.
- M. Sandroni, M. Kayanuma, A. Planchat, N. Szuwarski, E. Blart, Y. Pellegrin, C. Daniel, M. Boujtita and F. Odobel, Dalton Trans., 2013, 42, 10818 RSC.
- M. Sandroni, M. Kayanuma, M. Rebarz, H. Akdas-Kilig, Y. Pellegrin, E. Blart, H. Le Bozec, C. Daniel and F. Odobel, Dalton Trans., 2013, 42, 14628 RSC.
- M. Sandroni, L. Favereau, A. Planchat, H. Akdas-Kilig, N. Szuwarski, Y. Pellegrin, E. Blart, H. Le Bozec, M. Boujtita and F. Odobel, J. Mater. Chem. A, 2014, 2, 9944 CAS.
- C. L. Linfoot, P. Richardson, T. E. Hewat, P. Moudam, M. M. Forde, A. Collins, F. White and N. Robertson, Dalton Trans., 2010, 39, 8945 RSC.
- T. E. Hewat, L. J. Yellowlees and N. Robertson, Dalton Trans., 2014, 43, 4127 RSC.
- K. A. Wills, H. J. Mandujano-Ramirez, G. Merino, D. Mattia, T. Hewat, N. Robertson, G. Oskam, M. D. Jones, S. E. Lewis and P. J. Cameron, RSC Adv., 2013, 3, 23361 RSC.
- L. N. Ashbrook and C. M. Elliott, J. Phys. Chem. C, 2013, 117, 3853 CAS.
- M. S. Lazorski and F. N. Castellano, Polyhedron, 2014, 82, 57 CrossRef CAS.
- B. Bozic-Weber, E. C. Constable, N. Hostettler, C. E. Housecroft, R. Schmitt and E. Schönhofer, Chem. Commun., 2012, 48, 5727 RSC.
- N. Hostettler, S. O. Fürer, B. Bozic-Weber, E. C. Constable and C. E. Housecroft, Dyes Pigm., 2015, 116, 124 CrossRef CAS.
- See for example: M. Schmittel and A. Ganz, Chem. Commun., 1997, 999 RSC; M. Schmittel, H. Ammon, V. Kalsani, A. Wiegrefe and C. Michel, Chem. Commun., 2002, 2566 RSC.
- L.-L. Li and E. W.-G. Diau, Chem. Soc. Rev., 2013, 42, 291 RSC.
- S. Mathew, A. Yella, P. Gao, R. Humphry-Baker, B. F. E. Curchod, N. Ashari-Astani, I. Tavernelli, U. Rothlisberger, M. K. Nazeeruddin and M. Grätzel, Nat. Chem., 2014, 6, 242 CrossRef CAS PubMed.
- A. Mishra, M. K. R. Fischer and P. Bäuerle, Angew. Chem., Int. Ed., 2009, 48, 2474 CrossRef CAS PubMed.
- B.-G. Kim, K. Chung and J. Kim, Chem.–Eur. J., 2013, 19, 5220 CrossRef CAS PubMed.
- H.-H. Chou, Y.-C. Chen, H.-J. Huang, T.-H. Lee, J. T. Lin, C. Tsai and K. Chen, J. Mater. Chem., 2012, 22, 10929 RSC.
- J.-J. Kim, H. Choi, J.-W. Lee, M.-S. Kang, K. Song, S. O. Kang and J. Ko, J. Mater. Chem., 2008, 18, 5223 RSC.
- D. H. Lee, M. J. Lee, H. M. Song, B. J. Song, K. D. Seo, M. Pastore, C. Anselmi, S. Fantacci, F. De Angelis, M. K. Nazeeruddin, M. Grätzel and H. K. Kim, Dyes Pigm., 2011, 91, 192 CrossRef CAS.
- J. Wang and G. S. Hanan, Synlett, 2005, 1251 CAS.
- Spartan'14, Wavefunction, Inc., Irvine, CA 92612 Search PubMed.
- J.-J. Kim, H. Choi, J.-W. Lee, M.-S. Kang, K. Song, S. O. Kang and J. Ko, J. Mater. Chem., 2008, 18, 5223 RSC.
- M. Katono, M. Wielopolski, M. Marszalek, T. Bessho, J.-E. Moser, R. Humphry-Baker, S. M. Zakeeruddin and M. Grätzel, J. Phys. Chem. C, 2014, 118, 16486 CAS.
- R. Misra, P. Gautam and S. M. Mogin, J. Org. Chem., 2013, 78, 12440 CrossRef CAS PubMed.
- Z. J. Wang, S. Ghasimi, K. Landfester and K. A. I. Zhang, Chem. Commun., 2014, 50, 8177 RSC.
- T. Mutai, J.-D. Cheon, S. Arita and K. Araki, J. Chem. Soc., Perkin Trans. 2, 2001, 1045 RSC.
- K. A. Walters, Y.-J. Kim and J. T. Hupp, J. Electroanal. Chem., 2003, 554–55, 449 CrossRef.
- See for example: K. R. Thomas, J. T. Lin, M. Velusamy, Y.-T. Tao and C.-H. Chuen, Adv. Funct. Mater., 2004, 14, 83 CrossRef CAS.
- R. Misra and P. Gautam, Org. Biomol. Chem., 2014, 12, 5448 CAS.
- J.-M. Raimundo, P. Blanchard, H. Brisset, S. Akoudad and J. Roncali, Chem. Commun., 2000, 939 RSC.
- F. C. Krebs and M. Biancardo, Sol. Energy Mater. Sol. Cells, 2006, 90, 142 CrossRef CAS.
- H. J. Snaith, Energy Environ. Sci., 2012, 5, 6513 Search PubMed.
- H. J. Snaith, Nat. Photon., 2012, 6, 337 CrossRef CAS.
- E. Zimmermann, P. Ehrenreich, T. Pfadler, J. A. Dorman, J. Weickert and L. Schmidt-Mende, Nat. Photon., 2014, 8, 669 CrossRef CAS.
- B. Bozic-Weber, V. Chaurin, E. C. Constable, C. E. Housecroft, M. Meuwly, M. Neuburger, J. A. Rudd, E. Schönhofer and L. Siegfried, Dalton Trans., 2012, 41, 14157 RSC.
- B. List, Angew. Chem., Int. Ed., 2010, 49, 1730 CrossRef CAS PubMed.
Footnote |
| † Electronic supplementary information (ESI) available: Syntheses of precursors to compounds 9–11; Fig. S1. CVs of ligands 9 and 10; Fig. S2–S5. Additional MO compositions for 9, 10, and zinc complexes; Fig. S6. Solid-state absorption spectrum of an FTO/TiO2/11 electrode. See DOI: 10.1039/c5ra05630f |
| This journal is © The Royal Society of Chemistry 2015 |

