DOI:
10.1039/C5RA05610A
(Paper)
RSC Adv., 2015,
5, 45679-45687
Novel bio-based flexible epoxy resin from diglycidyl ether of bisphenol A cured with castor oil maleate†
Received
30th March 2015
, Accepted 15th May 2015
First published on 15th May 2015
Abstract
The paper deals with the synthesis, thermal and electrical behavior study of a flexible epoxy resin based on castor oil maleate and diglycidyl ether of bisphenol A. Castor oil maleate was obtained via esterification of castor oil with maleic anhydride. The chemical structures of the castor oil maleate and epoxy network were confirmed by FTIR and 1H-NMR spectroscopy. Thermal decomposition of the synthesized flexible network has been studied by means of dynamic thermogravimetry in a nitrogen atmosphere up to 600 °C. Global kinetic parameter values of the thermal decomposition process were determined using the isoconversional method of Friedman. Simultaneous TG-DTA analysis indicated that the thermal decomposition process occurred in three stages, characterized by diffusion, n order and Avrami–Erofeev reaction models. Kinetic parameter determination, corresponding to each individual stage of the thermal decomposition, was also possible through a multivariate non-linear regression method. A good correlation was found between the experimental and simulated data. Evolved gas analysis was monitored by a simultaneous TG/DTA-FTIR-MS technique. Dielectric relaxation spectroscopy measurements were also undertaken.
1. Introduction
During the last few decades, the environmental impact of synthetic materials has become increasingly important. Environmental issues regarding this aspect may be partially reduced by replacing synthetic materials with others based on biorenewable resources (carbohydrates, cellulose, starch, rosin, natural rubber, turpentine, natural oils and fats).
Epoxy resins are thermosetting resins which combine good mechanical properties, reasonable thermal behaviour and superior electrical properties with excellent chemical and moisture resistance and with a good adhesion on the different substrates. They are widely used in industry as adhesives, matrices for composites and insulating materials for electrical and electronics devices.1–5 The ultimate behaviour of the cured epoxy resins depends on their chemical structures and that of other materials present in the final mixture (curing agents, plasticizers, reactive diluents, fillers, colorants). One significant drawback of the cured epoxy resins is their brittleness, as a consequence of high crosslinking density, aspect which limits some industrial applications. In order to surpass this impediment, in the initial formulation of the mixtures should be introduced a series of chemical compounds, such as thermoplastic polymers, plasticizers, epoxy oils, carboxyl-terminated copolymer of butadiene and acrylonitrile, for inducing a plasticizing effect. The introduction of such new components increases the toughness, on the one hand, and decreases other properties. These compounds may participate in the curing reaction and, by modifying the crosslinking density, lower the glass transition temperature and mechanical properties.6–12 According to the literature, epoxidized oils and some of their derivatives may be used as plasticizers and/or reactive diluents in different formulations.13–15
This paper aims to study the thermal and electrical characteristics of a flexible epoxy resin based on castor oil maleate and diglycidyl ether of bisphenol A (DGEBA). By comparison with other curing agents (amides, anhydrides, acids, etc.), COMA is obtained from renewable resources and is nontoxic. In contrast to other products with similar functions, it simultaneously acts both as a crosslinking agent and as a structural plasticizer. Due to the presence of COMA in the crosslinked resin structure, electrical insulating materials may be obtained which may be used for manufacturing electronic circuits on flexible substrates. The knowledge about the thermal stability and temperature range in which the product can be used is required. Moreover, environmental protection and the necessity of recovering the useful chemical compounds after overcoming lifetime, imposes for the substances that occur during thermal decomposition to be identified.
2. Experimental
2.1. Materials
Maleic anhydride (MA) and triethylbenzylammonium chloride (TEBAC) were purchased from Aldrich. Castor oil (CO) was a product (90% ricinoleic acid, iodine value 83 g I2 100 g−1, hydroxyl value 161 mg KOH g−1, density 950 kg m−3). DGEBA was obtained from Policolor SA Bucharest, Romania as commercial product with an epoxide number of 0.515 mol 100 g−1. All the other chemicals and solvents were reagent grade products and used without further purification.
2.2. Synthesis of castor oil/maleic anhydride (COMA)
COMA was synthesized according to the slightly modified methods reported16,17 in the literature. 98.7 g CO (0.1 mol), 26.41 g MA (0.27 mol) and 0.1 g hydroquinone, as polymerization inhibitor, were introduced into a 500 mL glass reactor equipped with mechanical stirrer, reflux condenser, thermometer, an inlet of dry nitrogen and heating system. The reaction mixture was stirred and the air evacuated under vacuum. After 20 minutes under stirring the reaction mixture was purged with N2 and heated at 80 °C for 1 h, when the MA was completely melted. The reaction was continued under stirring at the following temperatures: 2 h at 100 °C, 4 h at 120 °C and 1 h at 130 °C. Finally, the reaction mass of a brown colour was cooled at room temperature and stored in a sealed dark flask. The reaction was continued in the flask for another 2 weeks at room temperature with the aim to consume the last traces of unreacted maleic anhydride. The synthetic route is shown in Scheme 1.
 |
| | Scheme 1 The synthesis of COMA. | |
2.3. The curing of DGEBA with COMA
A flexible crosslinked network was obtained using DGEBA epoxy resin and COMA as simultaneous crosslinking agent and reactive diluent (Scheme 2). Three molar ratios between epoxy rings and carboxylic protons (1/1, 1/0.75 and 1/0.5) were used in the synthesis of flexible networks. The reagents were vigorously mixed in the presence of TEBAC as catalyst (1% reported to reactants) and degassed under vacuum for 20 minutes. Then, 1 g of reaction mixture was transferred in an aluminium form with a diameter of 22 × 10−3 m, in order to obtain a sample with a thickness of about 0.25 × 10⁻³ m, and crosslinked. The following temperature scheme was used: 1 h at 80 °C, 1 h at 100 °C, 1 h at 120 °C, 1 h at 150 °C and 3 h post curing at 180 °C. The synthesized product was characterized by means of thermal and dielectric properties.
 |
| | Scheme 2 The curing reaction of DGEBA with COMA. | |
2.4. Methods
2.4.1. Chemical characterization. The epoxide number was obtained by titration with hydrogen bromide in situ using ASTM D 1652-04 method18 and expressed in mol 100 g−1. Acid number was determined by dissolving the sample at 50 °C in toluene![[thin space (1/6-em)]](https://www.rsc.org/images/entities/char_2009.gif) :water mixture of ratio 90:10 (5% w/v concentration), further titrated with 0.1 N ethanolic KOH solution in the presence of phenolphthalein as indicator and expressed in mg KOH g−1. Also, the hydroxyl value was measured by titration according to the ASTM D4274-05 method19 and expressed in mg KOH g−1. The chemical structure of COMA was confirmed by FTIR and 1H-NMR methods. FTIR spectrum was recorded between 4000–400 cm−1 using a Vertex 70 spectrophotometer (Bruker, Germany) on KBr disks. 1H-NMR spectrum was recorded on an Avance DRX 400 (Bruker, Germany) at room temperature. The samples were prepared at concentration of 5% w/v, using deuterated chloroform as solvent, in presence of 0.05% tetramethylsilane (TMS) as internal standard. NMR chemical shifts were expressed in ppm.
:water mixture of ratio 90:10 (5% w/v concentration), further titrated with 0.1 N ethanolic KOH solution in the presence of phenolphthalein as indicator and expressed in mg KOH g−1. Also, the hydroxyl value was measured by titration according to the ASTM D4274-05 method19 and expressed in mg KOH g−1. The chemical structure of COMA was confirmed by FTIR and 1H-NMR methods. FTIR spectrum was recorded between 4000–400 cm−1 using a Vertex 70 spectrophotometer (Bruker, Germany) on KBr disks. 1H-NMR spectrum was recorded on an Avance DRX 400 (Bruker, Germany) at room temperature. The samples were prepared at concentration of 5% w/v, using deuterated chloroform as solvent, in presence of 0.05% tetramethylsilane (TMS) as internal standard. NMR chemical shifts were expressed in ppm.
2.4.2. Crosslinking density measurements. The crosslinking density of DGEBA and castor oil maleate networks obtained at a molar ratio of 1/1 was determined using swelling measurements. Seventeen solvents with solubility parameters between 7.24 up to 21.1 were tested to determine the swelling of the synthesized network. Among the tested solvents, methylene chloride proved to be the best solvent for swelling of the network. It may be assumed that the polymer–solvent interaction parameter is equal with the solubility parameter of methylene chloride respectively = 9.93 (cal cm−3)0.5, as imposed by the experimental procedure. The theoretical mass between two crosslinking points was considered to have a value of 980 g mol−1.
2.4.3. Electrical characterization. Dielectric relaxation spectroscopy (DRS) measurements were performed using Novocontrol Dielectric Spectrometer Concept 40 (Germany). Data were expressed as complex permittivity ε*(f) = ε′(f) − iε′′(f), where ε′ and ε′′ are the relative permittivity and dielectric loss, recorded by frequency scans (f) between 1 Hz to 1 MHz, at constant temperature taken at every 5 °C in the range −50 °C to 100 °C. The measurements were conducted on films about 300 μm thick and placed between two circular steel electrodes with the upper electrode having 20 mm diameter. The samples were placed inside a cryostat with controlled temperature in nitrogen atmosphere and the amplitude of AC applied voltage was 1 V.
2.4.4. Thermal characterization. The thermal degradation and evolved gases analyses were monitored using a simultaneous thermal analysis TG/DTA-FTIR-MS system (STA 449F1 Jupiter model, Netzsch Germany) equipped with a simultaneous TG/DTA sampler. The evolved gaseous composition was analyzed with a mass spectrometer QMS 403C Aëolos model (Netzsch, Germany) and a FTIR spectrophotometer Vertex-70 model (Bruker, Germany). The thermobalance was coupled with QMS through a transfer line from quartz capillary with internal diameter of 75 μm, heated at 290 °C and with the FTIR device by a transfer line made of polytetrafluorethylene with 1.5 mm diameter, heated at 250 °C. The sample (12 mg) was heated between 30 and 600 °C under nitrogen (flow rate 50 mL min−1), in Al2O3 crucible using a similar crucible as reference material. Heating rates of 5, 7.5 and 10 °C min−1 were used. FTIR spectra were recorded in the range 500–4000 cm−1. QMS spectrometer works at 10−5 mbar vacuum and electron impact ionization energy of 70 eV. The acquisition of the data was achieved in the range m/z = 1–200, measurement time of 0.5 s for one channel, resulting a time/cycle of 100 s. The identification of ion fragments (m/z) was made with the NIST Mass Spectral Database. Dynamic differential scanning calorimetry (DSC) was used for glass transition temperature value (Tg) determination. DSC measurements were conducted on a DSC 200 F3 Maia device (Netzsch, Germany). A mass of 10 mg of each sample was heated in pierced and sealed aluminium crucibles in nitrogen atmosphere at a flow rate of 50 mL min−1 and 10 °C min−1 heating rate. The temperature against heat flow was recorded. The baseline was obtained by scanning the temperature domain of the experiments with an empty pan. The instrument was calibrated with indium at various heating rates according to standard procedures. Tg was evaluated as the middle point of the glass transition domain. Tg was calculated as the intersection point of tangents to the vitrification temperature range.
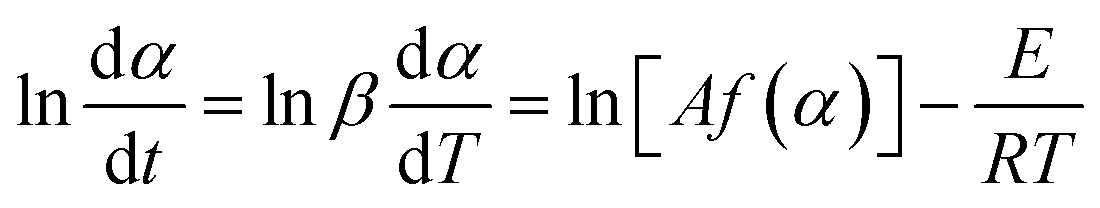
2.4.5. Kinetic investigations. The Netzsch Thermokinetics 3 software was used to process the thermogravimetric data. It was assumed that the thermal decomposition of the crosslinked flexible epoxy resin occurs according with eqn (1), where m(s) is the initial sample mass, g(g) is weight of released gaseous mixture and r(s) is the resulted solid residue.Eqn (2) describes the thermal degradation rate (dα/dt) as a function of time and of the conversion (f(α)).
| |
 | (2) |
where:
A is the pre-exponential factor (s
−1),
E is the activation energy of thermal decomposition (kJ mol
−1),
f(
α) is the conversion function,
R is the gas constant (8.314 J K
−1 mol
−1),
t is time (min) and
T is temperature (K).
The conversion degree (α) was calculated using the eqn (3).
| |
 | (3) |
where:
mi,
mt and
mf are the masses of the sample measured before degradation, at a time
t and after complete degradation.
Eqn (4) was obtained by inserting the heating rate β = dT/dt in eqn (2).
| |
 | (4) |
The differential Friedman method (eqn (5)) was used to evaluate the global kinetic parameters. The method uses shifts of TG curves with heating rate increase.20
| |
 | (5) |
From the slope of the plot ln(dα/dt) versus 1/T for α = constant the E value was obtained. Based on activation energy variation versus the conversion degree, predictions may be undertaken on the thermal degradation reaction mechanisms.21,22
3. Results and discussion
3.1. COMA synthesis and characterization
COMA was synthesized through the reaction between CO and MA according to Scheme 1. The chemical structure of COMA has been confirmed by means of FTIR and 1H-NMR spectroscopy (see Fig. S1 and S2 in ESI†).
In the CO spectrum (a), the peak from 3440 cm−1 indicates the presence of OH groups specific to this oil type. In the COMA spectrum (b), the signals from 3009 cm−1 and 1644 cm−1 are assigned to the absorption of the double bonds. The signals are indications that the unsaturation was preserved and the new double bonds were introduced. The absorption signals from 1744 cm−1 and 1247 cm−1 that are present in both spectra, are typical to the carbonyl group (C![[double bond, length as m-dash]](https://www.rsc.org/images/entities/char_e001.gif) O) from ester structure. The shoulder observed at 1700 cm−1 is assigned to the new carboxyl group appeared as a result of the reaction between CO and MA.
O) from ester structure. The shoulder observed at 1700 cm−1 is assigned to the new carboxyl group appeared as a result of the reaction between CO and MA.
The 1H-NMR signals have been attributed according to the literature.23,24 In the CO spectrum the signals from 0.78–1.70 ppm are specific to –CH3 and –CH2 protons from a, b and f positions. The methine proton connected to the hydroxyl group from c position has a signal located between 3.4–3.8 ppm. The methylene protons from the glycerol moieties (g and h) are present in 3.9–4.3 ppm range. Protons attached to the double bond belonging ricinoleic acid (d and e) appear between 5.15–5.6 ppm. In the COMA spectrum, obtained as a result of chemical reaction between the –OH groups from CO and anhydride group from MA appeared the new multiplet between 5.8–6.5 ppm with the peak at 6.312 ppm which may be assigned to the double bond protons of maleic moieties. Also, two new signals appear as peaks at 4.989 and 10.32 ppm which represents the methine proton located near the maleate group and the –COOH proton. The signal from 7.260 ppm is specific to CDCl3.
3.2. Characterization of cured flexible network
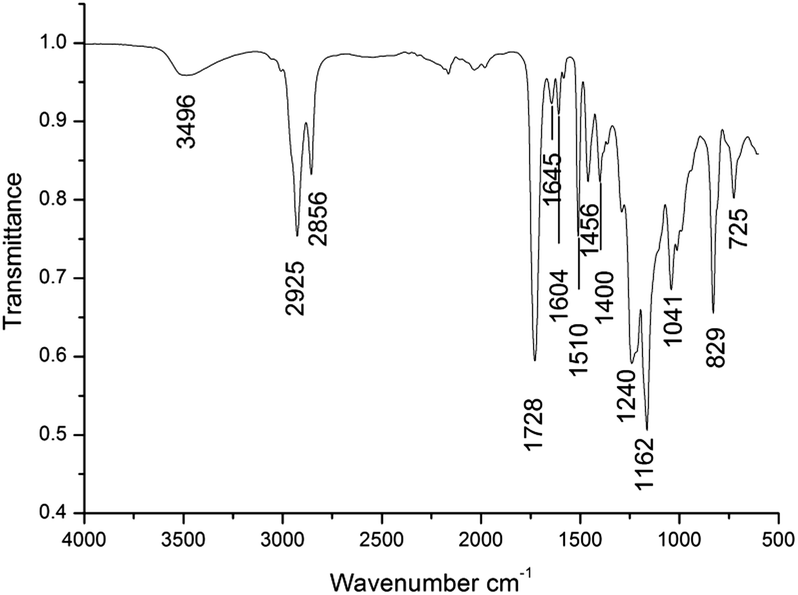
Fig. 1 shows the FTIR spectrum of the flexible crosslinked network. The vibrations were assigned using the literature data.25 After curing reactions, the absorption signals specific to carboxylic groups, located at 1695 cm−1, and to epoxy ring, located at 915 cm−1, disappeared. A new signal at 3496 cm−1, specific to hydroxylic groups, appeared as a result of the reaction between carboxylic protons and epoxy rings. Also, the signals specific to the ester groups from 1728 cm−1 (assigned to CO stretching vibrations) and the triplet from 1240, 1162, 1041 cm−1 (assigned to the stretching vibrations of C(O)–O–C from fatty and unsaturated maleic acid) appeared. On the other hand, two new signals, specific to skeletal vibrations of the aromatic ring from epoxy resin, were exhibited at 1604 and 1510 cm−1. The signal from 1645 cm−1 characterizes the stretching vibrations of CC from maleic moieties.
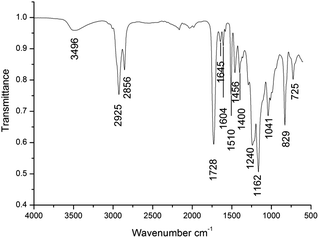 |
| | Fig. 1 The FTIR spectrum of the flexible crosslinked network. | |
The crosslinking density (n) and the molecular weight between two crosslinking points (Mc) were determined from the swelling data, using a method described in the literature.26 The obtained values were: n = 2.969 × 10⁻⁴ mol cm−3 and Mc = 3300 g mol−1. The value of 3.36 for the rate between experimental and theoretical values of Mc suggests that in the cross-linked polymer structure, only a few carboxylic groups contributed to the formation of crosslinks.
The flexibility of the obtained networks was confirmed by the low Tg values (−15 °C for 1/1 ratio, −8 °C for 1/0.75 ratio and −2 °C for 1/0.5 ratio) (see Fig. S3 in ESI†). It may be observed that the increase of COMA content lowers the Tg network values. This behaviour is a consequence of internal plasticizing effect introduced by COMA.
3.3. Dielectric relaxation spectroscopy
In order to study the molecular chain mobility, which directly relates to flexibility, DRS measurements were further performed at various increasing temperatures. Dielectric results for the studied sample in the Tg range are shown in Fig. 2 as dielectric constant ε′ and dielectric loss ε′′ vs. temperature at selected frequencies in the 1 Hz to 1 MHz interval. Both representations are dominated by α-relaxation process attributed to the micro-Brownian segmental motion of the polymer backbone and associated with the Tg. The step increase of ε′ and the peak in ε′′ represent shifts to higher temperature with increasing frequency as characteristic to dielectric relaxations. From the positioning of the relaxation in the vicinity of the Tg and its intensity, i.e. at 1 Hz, ε′ increases from about 4 to 8, while ε′′ increases with more than one order of magnitude characteristic to intense dipolar activity. These are indicators that the observed relaxation represents the dynamic glass transition. At higher temperatures, and especially at lower frequencies, the process is followed and overlapped by the significant increase of both parameters, caused by increased mobility of the charge carriers that give rise to interfacial polarization and conductivity losses.27 For the lowest measurement frequency (1 Hz), the peak in ε′′(T) associated with dynamic glass transition is located at −9 °C. This proves the elastic nature of the crosslinked network.
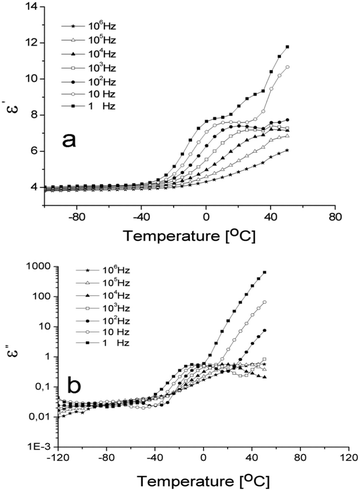 |
| | Fig. 2 Temperature dependence of ε′ (a) and dielectric loss ε′′ (b) at several frequencies in 1 Hz to 1 MHz range. | |
3.4. Thermal behavior
Fig. 3 presents the TG and DTG curves recorded at three heating rates. The increase of heating rate causes shifts in thermograms towards higher temperature domains. The data extracted from thermograms, such as: the temperature corresponding to 5% mass loss (T5%), the temperature corresponding to 50% mass loss (T50%), the temperatures that correspond to the maximum decomposition rates extracted from DTG curves (TmI, TmII), together with the appropriate mass loss (WmI, WmII), the final temperature at the end of the decomposition process (Tf) and the final residue mass (Wrez) are shown in Table S1 (see ESI†). As observed from Table S1,† the values T5%, T50%, TmI, TmII increased with the increase of heating rate, whilst the range Tf–Ti decreases. Also, an increase of residue weight with heating rates is shown. The phenomena are justified by the thermal inertia that accompanies heating rate increase.
 |
| | Fig. 3 TG and DTG curves recorded at three heating rates. | |
3.5. Kinetic analysis of thermal degradation process
E and lgA values calculated with the isoconversional method of Friedman are shown in Fig. 4 as a function of α. The E values vary with α, with lower than 10% deviations for α values raging between 0.1 and 0.86. Due to the presence of at least two peaks in the shape of DTG curves and the E values increase on the entire range of α variation, the thermal degradation process is complex, as observed in Fig. 3 and 4.
 |
| | Fig. 4 Variation of E and lgA values, calculated with Friedman method, with α. | |
Netzsch Thermokinetics software has been used to establish the thermal degradation mechanisms and the kinetic and statistics parameters. Based on TG data recorded at three different heating rates, the differential equations included in the software were numerically solved and the kinetic parameters of thermal degradation processes have been iteratively optimized. Several models28 of thermal decomposition reactions and the corresponding conversion functions are presented in Table S2 (see ESI†). The calculations were performed for the range of the conversion degree between 0.1 and 0.86 using the conversion functions shown in Table S2.† Based on TG and DTG curves (Fig. 3) and on the variation of E values with α (Fig. 4), it may be considered that the thermal degradation of the studied product occurs in a three step mechanism, as shown in eqn (6)
| |
 | (6) |
A multiple nonlinear regression method was used to find the most suitable form of the conversion function f(α) and the best values of kinetic parameters. Choosing the most appropriate model was based on statistical parameters (Fcrit. and correlation coefficient) which provide the best fit between calculated and experimental data. The calculated results are presented in Table 1. The first stage of thermal decomposition is characterized by TmI values of 288, 298, 312 °C and mass losses of 3.6, 3.2, 3.9% and are controlled by four-dimensional diffusion (Ginstling–Brounstein) (D4) mechanism. The values of E and lgA are 124 kJ mol−1 and 6.531 s−1 respectively. During this stage there exists the possibility of volatile substances loss to be accompanied by recombinations of the cleavage products, leading to change in the diffusion rate towards the sample surface. The next stage is controlled by conversion an nth order conversion function (Fn) with E = 98 kJ mol−1, lgA = 12.1 s−1 and n = 0.114. Reaction order (n) values close to zero suggest that thermal degradation occurs by releasing of small molecules as effect of random fragmentation of macromolecular chains, accompanied by possible cyclizations. The main step of thermal decomposition is also controlled by the Fn kinetic model with E = 238 kJ mol−1, lgA = 15.71 s−1 and n = 2.02. An n value close to 2 indicates that thermal degradation occurs by random scission of the polymeric chains accompanied by formation of small molecular compounds and shorter polymer fragments.29 The overlapping of theoretical curves calculated on the basis of kinetic parameters from Table 1 with the experimental data is given in Fig. 5. There is a very good fit between the theoretical curves and the experimental ones on the entire temperature range, thus proving the appropriateness of the kinetic models describing the thermal decomposition reactions. Exothermic heat effects accompany all three stages of thermal degradation, as one may observe from the shape of the DTA curve and the first derivative curve (DDTA) (see Fig. S4 in ESI†). The exothermic signals positions depend on the heating rates. The peaks that correspond to the exothermal signals were located between 310 and 329 °C for the first step, 361–385 °C for the second step and 445–460 °C for the third step, according to the DDTA curves. Exothermic signals confirm that thermal degradation is accompanied by cyclizations and chemical bonds recombination between chain fragments.
Table 1 Kinetic and statistic parameters calculated by multiple non-linear regression method, for the most probable mechanisms of thermal degradation
| t:f,f with kinetic model D3-Fn-An |
t:f,f with kinetic model D4-Fn-Fn |
| Parameter |
Value |
Parameter |
Value |
| logA1 (s−1) |
8.284 |
logA1 (s−1) |
6.531 |
| E1 (kJ mol−1) |
157 |
E1 (kJ mol−1) |
124 |
| logA2 (s−1) |
14.11 |
logA1 (s−1) |
12.12 |
| E2 (kJ mol−1) |
92 |
E2 (kJ mol−1) |
98 |
| n2 |
1.147 |
n2 |
0.114 |
| logA3 (s−1) |
12.12 |
logA3 (s−1) |
15.71 |
| E3 (kJ mol−1) |
94 |
E3 (kJ mol−1) |
238 |
| n3 |
1.426 |
n3 |
2.02 |
| FollReact 1 |
0.519 |
FollReact 1 |
0.176 |
| FollReact 2 |
0.164 |
FollReact 2 |
0.142 |
| Correlation coefficient |
0.999227 |
Correlation coefficient |
0.999882 |
| t-Critical (0.95; 629) |
1.955 |
t-Critical (0.95; 629) |
1.955 |
 |
| | Fig. 5 Overlapping of theoretical and calculated TG curves, based on the kinetic parameters. | |
3.6. Lifetime prediction from thermochemical data
The lifetime, defined as the time for 5% or 10% mass loss at a given temperature30,31 was calculated using “Thermokinetics 3” software. The values of mass losses are important criteria for using the product as electrical insulating material.21 Lifetime values calculated with kinetic model t:f,f; D4-Fn-Fn are shown in Table S3 (see ESI†). The lifetime of the studied product is strongly influenced by temperature. The lifetime varies for 5% mass loss 3000 h at 130 °C and 12 h at 200 °C. For 10% mass loss it increases up to more than four times. In terms of product lifetime (1.8 × 10⁵ minutes), authors found it to be situated between the values presented in the literature for epoxy resins based on diglycidyl ether of bisphenol A (7.08 × 10⁴ and 9.5 × 10⁵ minutes).21,32 On the other hand, the relatively low lifetime is a consequence of the lower obtained experimental crosslinking degree value compared to the theoretical one. Aliphatic structure of COMA is susceptible to thermal degradation, contributing to lowering of lifetime.
3.7. Evolved gases analysis
Volatile compounds released during thermal degradation were identified by FTIR and MS techniques.
3.7.1. FTIR analysis of evolved gases. The gaseous compounds evolved during the thermal decomposition processes may be observed from the FTIR 3D plot recorded at 10 °C min−1 heating rate (see Fig. S5 in ESI†). It may be seen that the thermal degradation occurs in at least two stages accompanied by evolution of volatile products, confirming the results obtained in the kinetic analysis section. The Gram–Schmidt curve, obtained by integrating the absorbance values of volatile products from FTIR spectra versus temperature, shows two peaks at 313 °C and 450 °C corresponding to the maximum quantity of gases released, as it shown in Fig. 6. The volume of gases evolved at 450 °C is much higher than the volatiles recorded at 313 °C. The identification of the volatile products composition evolved as a result of thermal degradation processes was made using the IR spectra extracted at 313 °C and 450 °C from 3D graph (Fig. 7). The FTIR signals were assigned using the literature data.25,33,34 The absorption signals appeared in the range 3772–3548 cm−1 with peaks located at 3734 and 3629 cm−1 may be assigned to water vapours traces. The signal from 3253 cm−1 was attributed to the presence of some compounds such as: alcohols, phenols and acetylene derivatives. The absorbance from 2360 cm−1 indicated the presence of CO2 among the degradation products.
 |
| | Fig. 6 The TG and Gram–Schmidt curves of the studied sample, recorded at 10 °C min−1. | |
 |
| | Fig. 7 FTIR spectra of evolved gases recorded at 313 °C and 450 °C. | |
The stretching vibrations of carbonyl groups from structures such as anhydrides are present at 1795 cm−1. The signals located between 1227 and 1050 cm−1 and 894 cm−1 were attributed to some traces of gases with ester, ether and aromatic structures. The FTIR spectrum recorded at 450 °C (b) exhibits many new signals. In this temperature range, the presence of water vapours and of carbon dioxide also has been identified. The new signals between 3100–2800 cm−1 with peaks at 3017, 2933 and 2871 cm−1 are specific to the stretching vibrations of CH, CH2 and CH3 from aliphatic fragments. The signal specific to carbonyl groups was shifted to lower wavenumbers (1779 cm−1) and expanded compared with the spectrum (a). This behaviour is due to the presence of new carbonyl compounds among evolved gases. The absorption peaks from 1606 and 1509 cm−1 are specific to deformation vibrations of C–H bonds and stretching vibrations of CC bonds from aromatic ring. Also, signals between 940 and 700 cm−1 with the peaks at 902, 823 and 746 cm−1 characterize substituted aromatic rings. The signals with medium intensity from 1261, 1177 and 1117 cm−1 confirm the release of additional quantities of compounds with ester structure.
3.7.2. MS analysis. The MS spectra of the main gases resulted during thermal degradation, recorded at 313 °C and 450 °C are shown in Fig. 8. MS spectrum of the gaseous products evolved at 313 °C showed five signals with ion fragment values recorded at m/z: 98, 54, 44, 26 and 12. The signals were assigned to the maleic anhydride (m/z = 98, 54 and 26) and to carbon dioxide (m/z = 44 and 12). The presence of compounds with anhydride structure and of carbon dioxide in the gaseous mixture evolved at 313 °C has been also confirmed by FTIR spectrum. Fig. 9 shows the evolution of ion fragments as a function of temperature, which is specific to maleic anhydride and carbon dioxide. The similar shape of ionic fragments variation with temperature suggests a good assignment of the signals. It may be observed that the release of maleic anhydride occurs in the range 265–540 °C with maximum rates at 334 and 453 °C while the evolution of carbon dioxide occurs between 300 and 505 °C with maximum rates at 300 and 436 °C. MS spectrum recorded at 450 °C exhibits a larger number of signals by comparison with the one recorded at 313 °C, due to thermal degradation process advancement. The maximum molecular weight of the fragments resulted during the thermal degradation process presents an m/z = 161. Table 2 presents the main chemical structures identified in MS spectra recorded at 450 °C. There were identified 16 chemical species with molecular weights between 18 and 120 amu. Low intensity signals with molecular weights higher than 120 amu could not be identified. The data obtained by MS technique were also confirmed by FTIR analysis.
 |
| | Fig. 8 The MS spectra of the main evolved gases recorded at 313 °C and 450 °C. | |
 |
| | Fig. 9 Evolution of ion fragments specific to maleic anhydride and carbon dioxide as a function of temperature. | |
Table 2 The main chemical compounds identified in the gaseous fraction recorded at 450 °C
| Compound name |
The main m/z values |
Molecular formula/molecular weight |
| Benzene-(1-methylethyl) |
120, 105, 103, 79, 77, 51, 39 |
C9H12/120 |
| α-Methylstyrene |
118, 117, 115, 103, 91, 78, 77, 51, 39 |
C9H10/118 |
| 1-Heptanal |
96, 81, 70, 57, 55, 44, 43, 41, 39, 29, 27 |
C7H14O/114 |
| Phenol |
94, 66, 65, 40, 39 |
C6H6O/94 |
| 1,3,6-Heptatriene |
94, 91, 79, 77, 53, 51, 39 |
C7H10/94 |
| Acrolein |
56, 55, 37, 29, 28, 27 |
C3H4O/56 |
| Butadiene |
54, 53, 50, 39, 28, 27 |
C4H6/54 |
| Acetaldehyde |
44, 43, 29, 15 |
C2H4O/44 |
| Propane |
44, 43, 29, 28, 27 |
C3H8/44 |
| Carbon dioxide |
44, 28, 16, 12 |
CO2/44 |
| Propene |
42, 41, 39, 27 |
C3H6/43 |
| Methanol |
32, 31, 29, 28, 15 |
CH4O/32 |
| Ethane |
30, 29, 28, 27, 26 |
C2H6/30 |
| Carbon monoxide |
28, 16, 12 |
CO/28 |
| Ethene |
28, 27, 26 |
C2H4/28 |
| Water |
18, 17, 16 |
H2O/18 |
4. Conclusions
A flexible crosslinked epoxy resin network based on COMA and DGEBA was synthesized. COMA was obtained through an esterification process of castor oil with maleic anhydride. The structures of COMA and of epoxy network were confirmed by FTIR and 1H-NMR methods. Thermal behaviour of the epoxy network, studied by means of simultaneous TG/DTA-FTIR-MS in nitrogen atmosphere, indicated three stages of thermal decomposition. The isoconversional Friedman method was applied for global kinetic parameters values determination. According to the applied kinetic method, E values increased with α in the range 0.1–0.86. This aspect, correlated with the presence of more than two peaks in the DTG curves, suggests a complex thermal degradation process. Multivariate non-linear regression method indicated that the thermal decomposition mechanism was characterized by diffusion, n order and Avrami–Erofeev reaction models. The E values characterizing each individual stage of thermal decomposition varied in the range 92–238 kJ mol−1. Experimental and simulated data were in a good correlation. The TG-FTIR-MS data of the main evolved gases indicated the presence of maleic anhydride, carbon dioxide, water vapours, alcohols, phenols, ester, ether and aromatic structures. Dielectric relaxation spectroscopy measurements presented a α-relaxation process attributed to a micro-Brownian segmental mobility of the polymer main chain, associated with the glass transition.
Acknowledgements
Three of the authors (Dan Rosu, Liliana Rosu and Cristian-Dragos Varganici) acknowledge the financial support of a grant of the Romanian National Authority for Scientific Research, CNCS-UEFISCDI, Project Number PN-II-ID-PCE-2011-3-0187.
References
- C. A. May, Epoxy Resins Chemistry and Technology, Marcel Dekker Inc., New York, 2nd edn, 1988 Search PubMed.
- E. M. Petrie, Epoxy Adhesive Formulations, McGraw-Hill Publishing, New York, 2006 Search PubMed.
- Q. Yang, X. P. Yang, X. D. Li, L. Shi and G. Sui, RSC Adv., 2013, 3, 7452–7459 RSC.
- J. P. Pascault and R. J. J. Williams, Epoxy Polymers – New Materials and Innovations, WILEY-VCH Verlag GmbH & Co. KGaA, Weinheim, 2010 Search PubMed.
- C. D. Wright and J. M. Muggee, in Structural Adhesives, Chemistry and Technology, ed. S. R. Hartson, Plenum Press, New York, 1986, ch. 3, pp. 113–180 Search PubMed.
- R. Bagheri and R. A. Pearson, Polymer, 1996, 37, 4529–4538 CrossRef CAS.
- J. Jang and S. Shin, Polymer, 1996, 36, 1199–1207 CrossRef.
- F. Mustata, I. Bicu and C. N. Cascaval, J. Polym. Eng., 1997, 17, 491–506 CAS.
- F. Mustata, N. Tudorachi and I. Bicu, Ind. Eng. Chem. Res., 2013, 52(48), 17099–17110 CrossRef CAS.
- P. Czub, Macromol. Symp., 2006, 533, 245–246 Search PubMed.
- F. Mustata and I. Bicu, J. Appl. Polym. Sci., 2010, 115(3), 1787–1796 CrossRef CAS PubMed.
- H. Miyagawa, M. Misra, L. T. Drzal and A. K. Mohanty, J. Polym. Environ., 2005, 13(2), 87–96 CrossRef CAS PubMed.
- S. K. Sahoo, S. Mohanty and S. K. Nayak, RSC Adv., 2015, 5, 13674–13691 RSC.
- P. Czub, Polym. Adv. Technol., 2009, 20(3), 194–208 CrossRef CAS PubMed.
- J.-M. Pin, N. Sbirrazzouli and A. Mija, ChemSusChem, 2015, 8, 1232–1243 CrossRef CAS PubMed.
- H. J. Wang, M. Z. Rong, M. Q. Zhang, J. Hu, H. W. Chen and T. Czigány, Biomacromolecules, 2008, 9, 615–623 CrossRef CAS PubMed.
- P. Mazo, D. Estenoz, M. Sponton and L. Rios, J. Am. Oil Chem. Soc., 2012, 89, 1355–1361 CAS.
- ASTM D 1652–04, Standard Test Method for Epoxy Content of Epoxy Resins, 2004 Search PubMed.
- ASTM D4274-05, Standard Test Methods for Testing Polyurethane Raw Materials: Determination of Hydroxyl Numbers of Polyols, ASTM International, West Conshohocken, 2005 Search PubMed.
- H. L. Friedman, J. Polym. Sci., Part C: Polym. Symp., 1965, 6, 183–195 CrossRef PubMed.
- P. Budrugeac and E. Segal, Polym. Degrad. Stab., 2008, 93, 1073–1080 CrossRef CAS PubMed.
- D. Rosu, L. Rosu and M. Brebu, J. Anal. Appl. Pyrolysis, 2011, 92, 10–18 CrossRef CAS PubMed.
- M. A. Saied, S. H. Mansour, M. Eweis, M. Z. El-Sabee, A. L. G. Saad and K. N. Abdel Nour, Eur. J. Lipid Sci. Technol., 2008, 110, 926–934 CrossRef CAS PubMed.
- H. J. Wang, M. Z. Rong, M. Q. Zhang, J. Hu, H. W. Chen and T. Czigány, Biomacromolecules, 2008, 9, 615–623 CrossRef CAS PubMed.
- R. M. Silverstein, F. X. Webster and D. J. Kiemle, Spectrometric Identification of Organic Compounds, Wiley & Sons, Inc., Hoboken, 7th edn, 2005 Search PubMed.
- L. H. Sperling, Introduction to Physical Polymer Science, Wiley-Interscience, John Willey & Sons, Inc. Publication, Hoboken, New Jersey, 4th edn, 2006 Search PubMed.
- Broadband Dielectric Spectroscopy, ed. F. Kremer and A. Schoenhal, Berlin Heidelberg, Springer Verlag, 2003 Search PubMed.
- J. Opferman, J. Therm. Anal. Calorim., 2000, 60, 641–658 CrossRef.
- D. Rosu, N. Tudorachi and L. Rosu, J. Anal. Appl. Pyrolysis, 2010, 89, 152–158 CrossRef CAS PubMed.
- IEC 216-2, Guide for the Determination of Thermal Andurance Properties of Electrical Insulating Materials. Part 2; Choice of test criteria, IEC Central Office, Geneva, 1990 Search PubMed.
- X. G. Li and M. R. Huang, Polym. Degrad. Stab., 1999, 64, 81–90 CrossRef CAS.
- L. Nunez and M. Villanueva, J. Therm. Anal. Calorim., 2005, 80, 141–146 CrossRef CAS PubMed.
- NIST Chemistry Webbook Standard Reference Database Number 69, 2011, http://webbook.nist.gov/chemistry.
- M. Worzakowska, J. Therm. Anal. Calorim., 2014, 118, 511–521 CrossRef CAS.
Footnote |
| † Electronic supplementary information (ESI) available: Figures containing FTIR and 1H-NMR spectra of CO and COMA, DTA and DDTA curves and FTIR 3D plot of evolved gaseous compounds of the crosslinked epoxy network. Tables containing data evaluated from TG and DTG curves, reaction types and conversion functions and lifetime prediction from thermochemical data. See DOI: 10.1039/c5ra05610a |
|
| This journal is © The Royal Society of Chemistry 2015 |
Click here to see how this site uses Cookies. View our privacy policy here.