 Open Access Article
Fabrication of superhydrophobic thin films on various substrates using SiO2 nanoparticles coated with polydimethylsiloxane: towards the development of shielding layers for gas sensors†
Eun Ji
Park‡
,
Bo Ra
Kim‡
,
Dae Keun
Park
,
Sang Wook
Han
,
Dae Han
Kim
,
Wan Soo
Yun
and
Young Dok
Kim
*
Department of Chemistry, Sungkyunkwan University, 440-746 Suwon, Republic of Korea. E-mail: ydkim91@skku.edu
First published on 28th April 2015
Abstract
Superhydrophobic membranes with high gas permeability were prepared and characterized. Materials such as a metal mesh, paper, fabric and polytetrafluoroethylene were dip-coated in a hexane-based solution of SiO2 nanoparticles coated with polydimethylsiloxane (PDMS). The dip-coating provided a superhydrophobic characteristic to the surfaces of our membranes with water contact angles exceeding 160°. On the other hand, a high membrane permeability of CO2 and dimethyl methylphosphonate vapor were obtained, indicating that our preparation method is useful for the fabrication of gas sensor shielding layers that allow selective permeation of gas vapors from gas/aqueous-liquids mixtures.
Introduction
Superhydrophobicity refers to the surface property of a water contact angle exceeding 150°, which can result from a combination of dual surface roughness and hydrophobic surface functionality.1–4 A hierarchical surface structure forming dual surface roughness can minimize the contact area between the solid surface and a water droplet, resulting in water repellant properties.A superhydrophobic surface can be prepared by patterning a flat solid and hydrophobic surface, resulting in a hierarchal surface structure.5,6 Alternatively, distribution of hydrophobic nanoparticles can result in a superhydrophobic surface, since nanoscale surface roughness due to the intrinsic particle size superposes the (sub) micrometer-scale roughness formed by the agglomeration of nanoparticles.7–9 Diverse strategies for a more facile and economic fabrication of superhydrophobic surfaces have been developed, and the improved chemical and mechanical stability of superhydrophobic surfaces have received broad interest.10–16
Superhydrophobicity is of great interest in various fields. Superhydrophobic foams can be used for selectively isolating oil from oil/water mixtures, and this technology is related to efficient removal of spilled oil from global waters.17–19 Superhydrophobic surfaces can also show self-cleaning behaviors, i.e., dust particles existing on superhydrophobic surfaces can be swept away from the surface by rolling water droplets.20–23 When such self-cleaning properties can be combined with high optical transparency of thin films, many interesting applications become possible, such as in photovoltaic panels.24–26
Many chemical sensors, playing a crucial role in environmental science and technology, are based on the detection of vapors, and these sensors are often easily contaminated by the introduction of aqueous liquids.27–29 A shielding layer in the aperture of the sensor can be used to protect the sensor from aqueous liquids and allow selective permeation of gas molecules, which can ultimately protect the vapor sensor from the fatal contamination by aqueous liquid. In the present study, we developed a wet-chemical process for the preparation of such shield layers, thereby inhibiting permeation of aqueous liquids and allowing gas transmission. Our method is based on simple and cost-effective wet-chemical dip coating and SiO2 nanoparticles coated by polydimethylsiloxane (PDMS).30–35
Experiments
Materials
Silica nanoparticles (Degussa, Aerosil 200, mean particle size = 24 nm), hexane (DAEJUNG, purity = 100%), ethanol (DAEJUNG, purity = 95%) and fluidic PDMS (Dow Corning, Sylgard 184) were used as received. The average molecular weight (Mn), weight average molecular weight (Mw) and polydispersity index (PDI) of PDMS used in this work were ∼4200 g mol−1, ∼14![[thin space (1/6-em)]](https://www.rsc.org/images/entities/char_2009.gif) 000 g mol−1 and 3.3, respectively (measured by gel permeation chromatography; GPC, Agilent 1100s). Two types of polytetrafluoroethylene (PTFE) membranes were purchased from Meari, one with pore size of 0.2 μm and membrane thickness of 30 μm (PTFE-1) and the other one 5, and 100 μm of the respective values (PTFE-2). Stainless steel-meshes with different pore sizes (100 mesh and 165 mesh) were obtained from Ehwa Chulmang, and are denoted as mesh-1 (rectangular pores with a side length of 141 μm and a wire diameter of 100 μm) and mesh-2 (rectangular pores with a side length of 100 μm, and a wire diameter of 53 μm), respectively. Paper (80 m2 g−1), cotton fabrics (fabric-1: 30 counts, fabric-2: 100 count) and umbrella fabric were obtained from a local store.
000 g mol−1 and 3.3, respectively (measured by gel permeation chromatography; GPC, Agilent 1100s). Two types of polytetrafluoroethylene (PTFE) membranes were purchased from Meari, one with pore size of 0.2 μm and membrane thickness of 30 μm (PTFE-1) and the other one 5, and 100 μm of the respective values (PTFE-2). Stainless steel-meshes with different pore sizes (100 mesh and 165 mesh) were obtained from Ehwa Chulmang, and are denoted as mesh-1 (rectangular pores with a side length of 141 μm and a wire diameter of 100 μm) and mesh-2 (rectangular pores with a side length of 100 μm, and a wire diameter of 53 μm), respectively. Paper (80 m2 g−1), cotton fabrics (fabric-1: 30 counts, fabric-2: 100 count) and umbrella fabric were obtained from a local store.
Preparation of hydrophobic silica nanoparticles
In order to fabricate PDMS-coated silica nanoparticles, a thermal vapor deposition method was used. Bare silica nanoparticles and fluidic PDMS were placed at a weight ratio of 1![[thin space (1/6-em)]](https://www.rsc.org/images/entities/char_2009.gif) :
:![[thin space (1/6-em)]](https://www.rsc.org/images/entities/char_2009.gif) 1 in a stainless steel reactor. PDMS and bare silica nanoparticles were separated with a metal mesh (30 mesh) partition (Fig. 1a). Then, the reactor was sealed with polyimide (PI) tape and heated to 300 °C for 15 h. The reactor was equipped with a power supply, k-type thermocouple, heating band, and temperature controller. Using this procedure, PDMS vapor was deposited on the surfaces of bare silica nanoparticles, forming a thin PDMS layer.
1 in a stainless steel reactor. PDMS and bare silica nanoparticles were separated with a metal mesh (30 mesh) partition (Fig. 1a). Then, the reactor was sealed with polyimide (PI) tape and heated to 300 °C for 15 h. The reactor was equipped with a power supply, k-type thermocouple, heating band, and temperature controller. Using this procedure, PDMS vapor was deposited on the surfaces of bare silica nanoparticles, forming a thin PDMS layer.
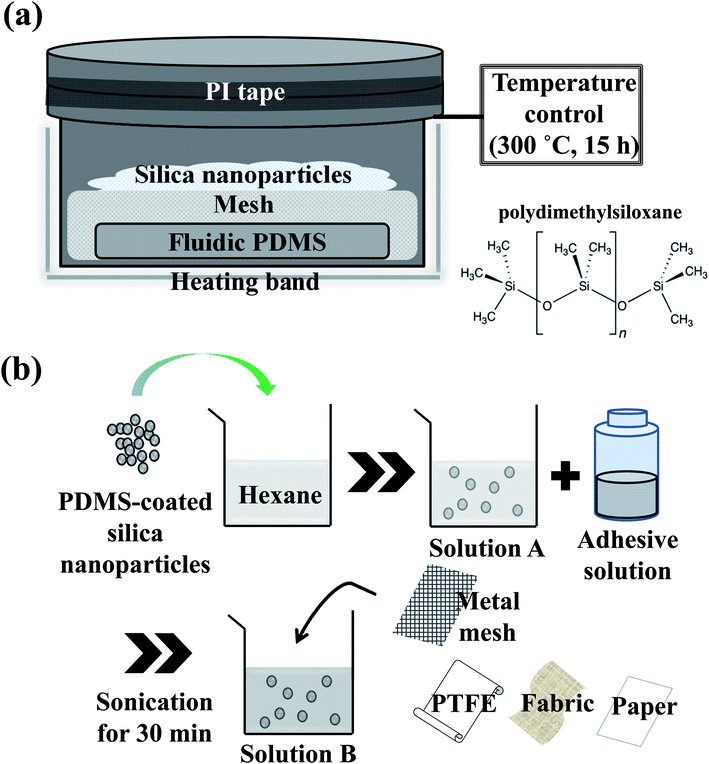 | ||
| Fig. 1 Schematic diagram of the experimental set-up for (a) the preparation of hydrophobic coating on silica nanoparticles, and (b) the preparation of dip-coating solution and superhydrophobic films. | ||
Dip coating
Solution A was prepared by dispersing PDMS-coated silica nanoparticles (0.2 g) in hexane (29 ml), and solution B was a mixture of solution A (29 ml) and an adhesive solution (1 ml), which was prepared by dissolving PDMS (1 ml) and curing agent (0.1 ml) in hexane (8 ml).Metal mesh-1 was used as a substrate for dip coating. The mesh surface was cleaned in ethanol for 10 min, wiped clean, and dried at room temperature. The mesh was dipped into solution B for 10 s, placed vertically, and dried for 5 min under atmospheric conditions. This dip coating process was repeated three times. Hereafter, the mesh-1 coated with solutions B and A are referred to as mesh-1B and mesh-1A, respectively. Other substrates, mesh-2, PTFE-1 and 2, fabric-1 and 2 and paper, were coated using the same method (Fig. 1b).
Characterizations
For the characterization of the chemical structure of bare and PDMS-coated nanoparticles, X-ray photoelectron spectroscopy (XPS) and Fourier transform infrared (FT-IR, BRUKER, Optics/vertex 70) spectroscopy were used. The XPS system was equipped with concentric hemispherical analyzer (CHA, SPECS, PHOIBOS-Has 3500) and Mg Kα-source (1253.6 eV). XPS spectra were obtained under a base pressure of 2.0 × 10⁻⁹ Torr. Static and dynamic water contact angles were measured for characterizing the surfaces consisting of PDMS-coated silica nanoparticles using a Theta optical tensiometer (KSV Instruments, Ltd.) equipped with a digital camera connected to a computer; Young–Laplace curves were employed for the fitting process required for contact angle determination. The static contact angle was measured by dropping ∼5 μl of distilled water onto the surface, and the dynamic contact angle while gradually adding and removing water from the water droplet. Contact angle hysteresis was determined by the difference between advancing and receding contact angles. The advancing contact angle is the maximum contact angle obtained upon adding water volume, while the receding contact angle is the minimum contact angle observed during receding water volume. Contact angle values were the averages of three measurements at different spots on each sample. In order to analyze structures and chemical elements of surfaces before and after dip-coating on substrates, scanning electron microscopy (SEM, JEOL, JEM-2100F) equipped with energy dispersive spectrometry (EDS) and atomic force microscopy (AFM, Park system, NX-10) were used. In order to determine the chemical stability of mesh-B, the sample was exposed to acidic (HCl (aq), pH 2.5) and basic (NaOH (aq), pH 12) solutions for 40 min or UV irradiation (VILBER LOUGMAT, UV lamp, λ = 254 nm) for 80 h.Sand abrasion test
To evaluate the mechanical resistance of fabricated dip-coating films with and without adhesives, a sand abrasion test was conducted in the following conditions: sand (20 g in each test) was dropped from a 30 cm height onto fabricated films, at a tilt angle of 45° with respect to the axis vertical to the bottom surface of the experimental set-up (Fig. 2a). Average particle size of the sand was 100 μm and its velocity at impact was about 0.22 ms−1 in our experimental conditions.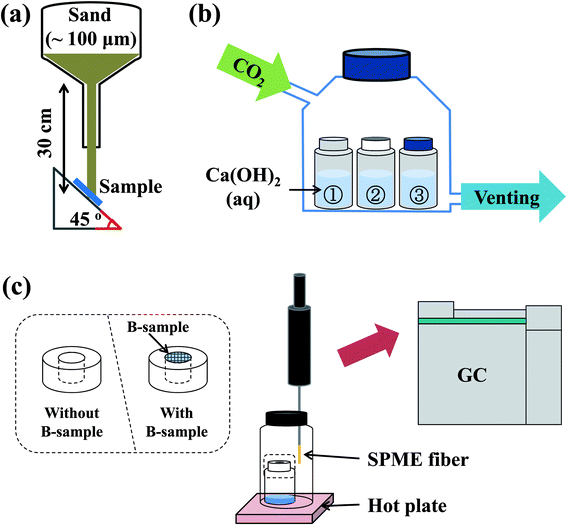 | ||
| Fig. 2 Schematic description of the experimental set-up for (a) sand abrasion experiment, (b) gas permeation test, and (c) gas permeability measurement using SPME. | ||
Gas permeation test
In order to evaluate the gas permeability of the fabricated films using solution B, a gas permeation test was performed using a CaCO3 precipitation reaction (Fig. 2b). A Ca(OH)2 aqueous solution (20 ml, 4 mM) was added to three vials, and printed letters were attached to the sidewall of the vials such that the letters could be seen. A hazy aqueous solution, which indicated the presence of a precipitate, can be formed by diffusion of CO2 gas into the vials. After sealing the glass reactor, CO2 gas was continuously flowed through the reactor at 30 pounds per square inch (psi). Information regarding gas permeability of the fabricated films was qualitatively obtained based on letter clarity.Gas permeability was quantitatively determined using solid phase micro-extraction (SPME) and gas chromatography (GC). An SPME fiber (divinylbenzene (DVB)/carboxen (CAR)/PDMS fiber, SUPELCO, 50/30 μm thickness) was placed in a vial containing a smaller vial filled with dimethyl methylphosphonate (DMMP, Sigma-Aldrich, 97%) (Fig. 2c). The smaller vial was either open or sealed with films having a superhydrophobic coating, and the DMMP vapor was extracted through the SPME fiber above the smaller vial for two minutes. During the extraction process, the vial and fiber temperature was kept at 50 °C. The extracted DMMP on the SPME fiber surface was subsequently desorbed and analyzed using gas chromatography (GC, HP 6890, Agilent Technologies).
Static column water resistance test
Static column water resistance test was performed based on ISO-811 standard method to evaluate waterproof ability of the fabricated samples. The bottom part of a column was sealed with the fabricated films and distilled water was poured from the top. The water level at which the water begins to penetrate the film was recorded and the test was performed three times for each sample.Result and discussion
Characterizations of bare and PDMS-coated silica nanoparticles
The surface chemical compositions of bare and PDMS-coated silica nanoparticle were analyzed using XPS (Fig. S1†). In the Si 2p core-level spectra, the bare sample showed a peak centered at 103 eV, and additional PDMS-coating resulted in appearance of a shoulder at ∼101 eV. The intensity of the C 1s peak centered at 284.1 eV was increased upon PDMS-coating due to the methyl group in the framework of PDMS.36 The intensity ratio of Si 2p and C 1s peaks attributed to the PDMS layer was 2.19, which is similar to the atomic ratio of Si and C in the PDMS framework. Surface functional group of bare and PDMS-coated silica nanoparticles was investigated with FT-IR (Fig. 3a). Before PDMS-coating on silica nanoparticles, a Si–O–Si asymmetric stretching band centered at 1095 cm−1 and a Si–O–Si symmetric stretching band located at 810 cm−1 were observed in the FT-IR spectra.37,38 After the PDMS-coating of bare silica nanoparticles, additional vibrational features of PDMS included an sp3 C–H stretching mode39,40 located at 3000 cm−1 and 2900 cm−1 and the CH3 deformation of Si–CH3 was observed at ∼1400 cm−1.41 Note that, in the previous study, it was confirmed that peaks of PDMS-coated silica nanoparticles prepared using the same method corresponded to those of PDMS elastomer in terms of band position, which means that PDMS-layer deposited on silica nanoparticles has no significant structural change with regard to the pristine PDMS.33 Considering the FT-IR and XPS results, one can expect that the dimethylsiloxane network of PDMS was preserved after the deposition on silica nanoparticles. In order to confirm the water-repellent properties of silica nanoparticles after PDMS coating, 0.2 g of either bare or PDMS-coated silica nanoparticles were placed in vials filled with 20 ml of distilled water. Fig. 3b shows that bare silica nanoparticles were almost completely mixed with distilled water, whereas PDMS-coated silica nanoparticles floated on the water.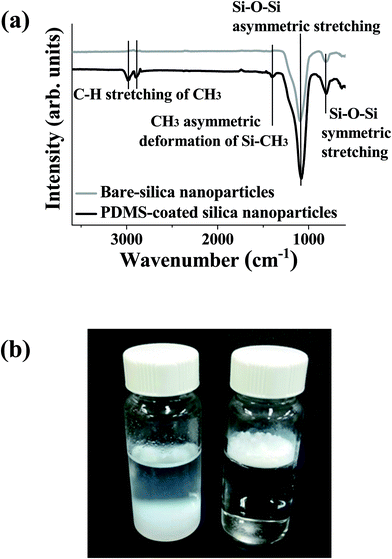 | ||
| Fig. 3 (a) FT-IR spectra of silica nanoparticles before and after PDMS-coating. (b) Images after dispersing bare (left) and PDMS-coated (right) silica nanoparticles in distilled water. | ||
Surface characterizations before and after dip-coating on substrates
The static water contact angle values (θsta) of samples before and after dip-coating in solution B and water contact angle hysteresis (θad − θre) of the substrates after dip-coating were measured for various substrates, as shown in Table 1. The θsta values of uncoated substrates were smaller than 150°, whereas those of the coated-substrates were larger than 150°. In addition, for dip-coated substrates, the water contact angle hysteresis values were determined to be less than 10° (Table 1). All substrates used in this work became superhydrophobic after dip-coating. It is worth mentioning that the use of the solutions A instead of B for the dip-coating resulted in almost the same water contact angles (result of the solution A not shown here).| Sample | Bare (°) | Coated film (°) | |||
|---|---|---|---|---|---|
| θ sta | θ sta | θ ad | θ re | θ ad − θre | |
| Mesh-1B | 117.6 | 166.0 | 162.5 | 159.1 | 3.4 |
| Mesh-2B | 113.3 | 160.4 | 161.5 | 154.0 | 7.5 |
| PTFE-1B | 137.3 | 163.2 | 162.8 | 155.1 | 7.7 |
| PTFE-2B | 138.7 | 162.3 | 159.4 | 154.8 | 4.6 |
| Paper-B | 139.2 | 162.6 | 158.9 | 156.1 | 2.8 |
| Fabric-1B | 111.1 | 163.8 | 161.2 | 154.6 | 5.6 |
| Fabric-2B | 44.0 | 161.0 | 160.7 | 155.0 | 5.7 |
The significant change in surface structure before and after dip-coating the metal mesh-1 with the solution B was confirmed with SEM images (Fig. 4). As shown in Fig. 4b, the wire of the plain metal mesh-1 was originally smooth and, after dip-coating (mesh-1B), the wires were randomly covered with PDMS-coated silica nanoparticles, which resulted in an increased roughness of the wire surface (Fig. 4c). High magnification (Fig. 4d) clearly shows that aggregation of hydrophobic-coated silica nanoparticles produced surface roughness on the micrometer scale. The EDS element mapping images (Fig. 4e and f) show that the particles adhered to the mesh-1B surface consisted of Si and C, each originating from silica nanoparticles, a PDMS thin layer present on the silica and adhesives, respectively. Since micrometer-scale roughness caused by aggregations of PDMS-coated silica nanoparticles superposes the nanoscale-roughness induced by the intrinsic sizes of individual nanoparticles, superhydrophobic surface properties are produced. Here again, the use of the solutions A and B resulted in almost the same surface morphology characterized by the SEM (SEM images of the mesh-1A are not shown here).
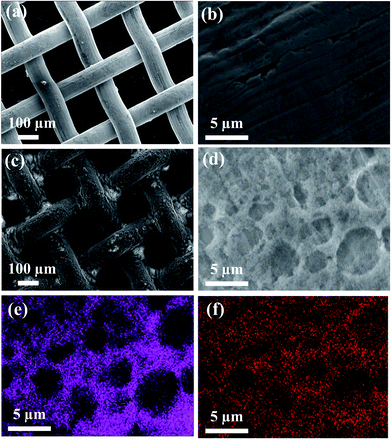 | ||
| Fig. 4 SEM images of (a) plain metal mesh-1, (b) magnified image of (a), (c) dip-coated metal mesh-1B, and (d) magnified image of (c). EDS mapping images of (e) Si and (f) C for the SEM image of (d). | ||
Surface stability after dip-coating on a substrate
In order to examine the effect of PDMS adhesive on the superhydrophobic stability, a sand abrasion test was performed for mesh-1A and mesh-1B. Fig. 5 shows the change in water contact angle as a function of the amount of sand dropped onto the surface. Prior to the test, all the samples showed superhydrophobic properties with water contact angles exceeding 160°. With an increasing amount of sand dropped onto the sample surface, the water contact angle gradually decreased due to mechanical abrasion. However, when the total amount of fallen sand exceeded 60 g, the contact angles of mesh-1A and mesh-1B showed a significant difference; after 100 g, only mesh-1B maintained a superhydrophobic property with a water contact angle of ∼150°. However, mesh-1A showed a much lower water contact angle (∼120°). This result implies that the superhydrophobic surface of mesh-1B was mechanically more stable than that of mesh-1A. Comparing the SEM images in Fig. 6 after the sand abrasion test with those of Fig. 4c and d before the test, many SiO2 nanoparticles on mesh-1A were removed during the sand abrasion test (Fig. 6b), whereas mesh-1B showed few changes in the surface structure after the sand abrasion test (Fig. 6d). This result suggests that PDMS-coated silica nanoparticles attached to mesh-1B were more stable than those bound to mesh-1A due to the existence of adhesives in the dip-coating solution B.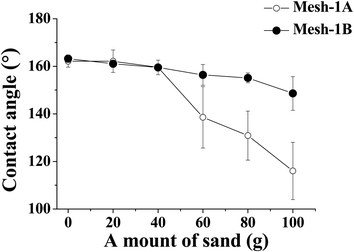 | ||
| Fig. 5 Change in water contact angle of mesh-1A and -1B as a function of amount of sand dropped onto the surface. | ||
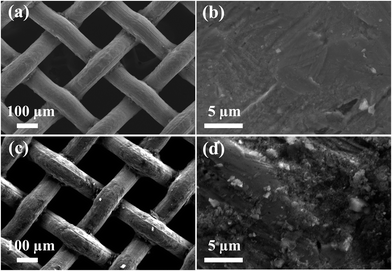 | ||
| Fig. 6 SEM images after the sand abrasion test on (a) mesh-1A, (b) magnification of (a); and (c) mesh-1B, (d) magnification of (c). | ||
In order to shed light on more details of the surface morphology of mesh-1A and mesh-1B, AFM analyses were carried out (Fig. S2†). It is clearly shown that, by dip-coating with either solution A or B, the nanometer-scale roughness has been increased by PDMS-coated silica nanoparticles covering the surface. For mesh-1A, rough feature of the surface disappeared after the sand test whereas it was maintained to some extent on mesh-1B, i.e., PDMS-coated silica nanoparticles on the surface was washed away on mesh-1A but remained intact on mesh-1B upon sand abrasion. A similar result can also be seen for PTFE substrates, even though the change in the surface morphology of paper upon dip-coating could be hardly seen, due to the intrinsically high roughness of the paper surface (Fig. S3†). For fabric, the surface roughness was so high that AFM measurement could be hardly performed. It is worth mentioning that root mean square (rms) roughness values summarized in Fig. S4† should be taken with care since the value includes the intrinsic roughness of substrates, which is quite high, and also vary much depending on the local positions of the surface. More importantly, alteration in the sub-micrometer and nanometer scale structures upon coating should be more carefully considered.
After being exposed to two different pH conditions and UV irradiation, the chemical stability of mesh-1B was evaluated by measuring the water contact angle after each treatment. The sample was immersed into either acidic (HCl (aq), pH 2.5) or basic (NaOH (aq), pH 12) solution for 40 min, washed with distilled water, and dried before measuring the water contact angle. As shown in Fig. 7a, the water contact angle did not change significantly after the acid/base treatment, i.e., the superhydrophobicity of the mesh-1B surface was sustained under harsh chemical conditions. In addition, when the surface of mesh-1B was irradiated by UV light (245 nm, 4 W) for 80 h, the surface maintained its water contact angle greater than 160° (Fig. 7b).
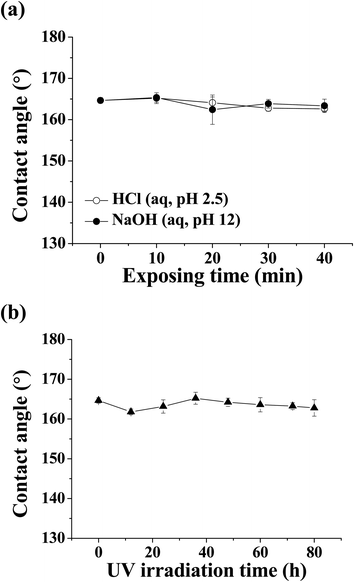 | ||
| Fig. 7 Change in water contact angle as a function of mesh-1B surface exposure to (a) acidic (HCl (aq), pH 2.5) and basic (NaOH (aq), pH 12) conditions and (b) UV irradiation. | ||
Gas permeability and waterproof ability of fabricated films
The gas permeability of mesh-1B was tested with a simple experimental design, shown in Fig. 2b: a vial without a cap (open, ①), a vial wrapped with fabricated film (②), and a vial sealed with a cap (③) were placed in a glass bottle with a branch for CO2 gas injection. In each vial was 20 ml of Ca(OH)2 aqueous solution, which produces a precipitate, CaCO3, by reacting with CO2 gas. Fig. 8 shows images of the vials before and after CO2 gas injection. Before the injection, the Ca(OH)2 aqueous solutions in each vial were clear, whereas the solutions in vials ① and ② became turbid after injecting CO2 gas at 30 psi, indicating that CO2 gas molecules had permeated through the fabricated film and reacted with Ca(OH)2 in the solution. In addition to mesh-1B, we tested CO2 gas permeability of other materials (mesh-2B, PTFE-1B and -2B, fabrics-1B and -2B, and paper-B) coated with the PDMS-coated SiO2 nanoparticles via dip-coating in solution B. In all vials wrapped with these superhydrophobic films, CaCO3 precipitations were observed, which indicates that the films offered permeability for CO2 gas.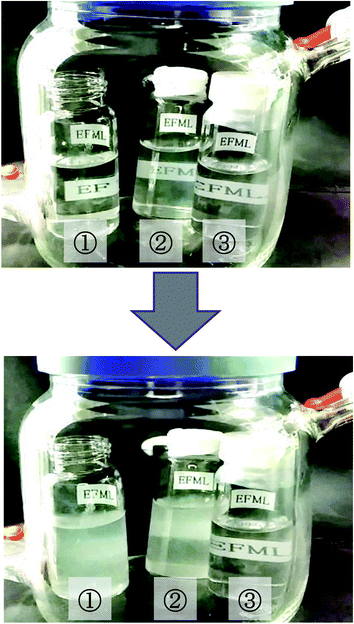 | ||
| Fig. 8 Images of vials containing Ca(OH)2 solution before (left) and after (right) the gas permeation test. ① Without cap (open), ② with a dip-coated mesh-1B, ③ with cap (sealed). | ||
Using the experimental set-up with SPME shown in Fig. 2c, the gas permeability of the solution-B-treated meshes, PTFE membranes, paper, and fabrics were quantitatively analyzed in greater depth. As shown in Table 2, the amount of DMMP vapor captured by the SPME fiber with meshes-B between DMMP liquid and SPME fiber reached over 90% of the respective value of the situation without the superhydrophobic shield. PTFE films-B reached over 70% of permeability and gas permeability of paper-B, fabric-1B and 2B were 53%, 29% and 69%, respectively. For comparison, gas permeability of a commercial umbrella fabric was tested and determined to be 40%. It is worth noting that DMMP is a chemical warfare agent, making detection of its vapor very important.32 After the gas permeability test, the water contact angle did not change significantly, and the superhydrophobic properties of the surfaces were maintained.
| Sample | Gas permeability |
|---|---|
| Mesh-1B | 100% |
| Mesh-2B | 91% |
| PTFE-1B | 71% |
| PTFE-2B | 77% |
| Paper-B | 53% |
| Fabric-1B | 29% |
| Fabric-2B | 69% |
| Umbrella | 40% |
Table 3 shows waterproof ability of the fabricated films and commercial umbrella fabric. PTFE-1B withstood the water level more than 4000 mm H2O, which was beyond the limit of our experimental condition. The PTFE-2B and fabric 2 also had higher waterproof ability compared to that of umbrella fabric, suggesting that those can completely block the penetration of water even under heavy rain. In case of meshes-B, water penetrated through mesh surface as soon as the water was poured from the 4 m height, even though the water droplet falling from a lower height did not penetrate through the mesh. The meshes-B could be the best materials for the selective permeation of gas, when only gas permeability is considered, however, when the sensor should be used under circumstance of certain water pressures, shielding layers based on PTFE can be a better choice due to its higher waterproof ability and relatively high gas permeability.
| Sample | Waterproof (mm H2O) |
|---|---|
| Mesh-1B | — |
| Mesh-2B | — |
| PTFE-1B | >4000 |
| PTFE-2B | 3300 |
| Paper-B | 190 |
| Fabric-1B | 180 |
| Fabric-2B | 733 |
| Umbrella | 402 |
It is challenging to concrete the relationship between substrate structure and gas permeability or waterproof ability. Nonetheless, it seems that both the pore structure and thickness of the substrate can have effect on gas permeability and waterproof ability. Mesh-1B, for example, has micrometer scale pore size and therefore it can easily reach the gas permeability ratio of 100%. On the other hand, although the pore size of the PTFE-1B is much smaller than that of mesh-1, the gas permeable ratio of PTFE-1B was over 70% since the film is very thin (∼30 μm). The waterproof ability can be related to not only pore size but also pore structure of the substrates. Mesh-1B has aligned micrometer scale pores with high regularity, and therefore it is hard for mesh-1B to bare the water pressure and block the water penetration. On the other hand, PTFE-1B is composed of stacks of poorly aligned nanometer scale pores connected by irregular channels, which can help the substrates endure the pressure of water column. Since superhydrophobic coating does not have much influence on the internal pore structures of films, we suggest that the gas permeability is not much influenced by the superhydrophobic coating.
Conclusions
In this work, we reported a simple and versatile method for the fabrication of superhydrophobic films with gas permeability using a dip-coating process. The high water repellent property of coated substrates was revealed by measuring the water contact angle on the film surface. Also, by adding PDMS and curing agent to the coating solution, adhesion of PDMS-coated silica nanoparticles to a substrate was enhanced. Even after being exposed to acidic and basic environments and UV-irradiation, the superhydrophobicity of the films was maintained. We also demonstrated the fabrication of a gas permeable membrane with highly water repellant properties using our method. The superhydrophobic and gas permeable membrane can be used as a shielding layer in gas sensors, thus preventing contamination of the sensor with aqueous liquids.Acknowledgements
This research was supported by the Civil-Military Technology Cooperation Program.References
- W. Barthlott, T. Schimmel, S. Wiersch, K. Koch, M. Brede, M. Barczewski, S. Walheim, A. Weis, A. Kaltenmaier, A. Leder and H. F. Bohn, Adv. Mater., 2010, 22, 2325 CrossRef CAS PubMed.
- L. Feng, S. Li, Y. Li, H. Li, L. Zhang, J. Zhai, Y. Song, B. Liu, L. Jiang and D. Zhu, Adv. Mater., 2002, 14, 1857 CrossRef CAS PubMed.
- M. Qu, B. Zhang, S. Song, L. Chen, J. Zhang and X. Cao, Adv. Funct. Mater., 2007, 17, 593 CrossRef CAS PubMed.
- A. Tuteja, W. Choi, M. Ma, J. M. Mabry, S. A. Mazzella, G. C. Rutledge, G. H. McKinley and R. E. Cohen, Science, 2007, 318, 1618 CrossRef CAS PubMed.
- Y. Lee, S. H. Park, K. B. Kim and J. K. Lee, Adv. Mater., 2007, 19, 2330 CrossRef CAS PubMed.
- T. Sun, L. Feng, X. Gao and L. Jiang, Acc. Chem. Res., 2005, 38, 644 CrossRef CAS PubMed.
- G. Caputo, B. Cortese, C. Nobile, M. Salerno, R. Cingolani, G. Gigli, P. D. Cozzoli and A. Athanassiou, Adv. Funct. Mater., 2009, 19, 1149 CrossRef CAS PubMed.
- R. A. Gittens, T. McLachlan, R. Olivares-Navarrete, Y. Cai, S. Berner, R. Tannenbaum, Z. Schwartz, K. H. Sandhage and B. D. Boyan, Biomaterials, 2011, 32, 3395 CrossRef CAS PubMed.
- J. Park, H. Lim, W. Kim and J. S. Ko, J. Colloid Interface Sci., 2011, 360, 272 CrossRef CAS PubMed.
- B. Deng, R. Cai, Y. Yu, H. Q. Jiang, C. L. Wang, J. A. Li, L. F. Li, M. Yu, J. Y. Li, L. D. Xie, Q. Huang and C. H. Fan, Adv. Mater., 2010, 22, 5473 CrossRef CAS PubMed.
- S. Ramakrishna, K. S. S. Kumar, D. Mathew and C. P. R. Nair, J. Mater. Chem. A, 2015, 3, 1465 CAS.
- X. Deng, L. Mammen, H. J. Butt and D. Vollmer, Science, 2012, 335, 67 CrossRef CAS PubMed.
- Y. C. Jung and B. Bhushan, ACS Nano, 2009, 3, 4155 CrossRef CAS PubMed.
- T. Verho, C. Bower, P. Andrew, S. Franssila, O. Ikkala and R. H. A. Ras, Adv. Mater., 2011, 23, 673 CrossRef CAS PubMed.
- D. Wang, Z. B. Zhang, Y. M. Li and C. H. Xu, ACS Appl. Mater. Interfaces, 2014, 6, 10014 CAS.
- H. X. Wang, Y. H. Xue, J. Ding, L. F. Feng, X. G. Wang and T. Lin, Angew. Chem., Int. Ed., 2011, 50, 11433 CrossRef CAS PubMed.
- C. R. Crick, J. A. Gibbins and I. P. Parkin, J. Mater. Chem. A, 2013, 1, 5943 CAS.
- C. X. Wang, T. J. Yao, J. Wu, C. Ma, Z. X. Fan, Z. Y. Wang, Y. R. Cheng, Q. Lin and B. Yang, ACS Appl. Mater. Interfaces, 2009, 1, 2613 CAS.
- F. J. Wang, S. Lei, C. Q. Li, J. F. Ou, M. S. Xue and W. Li, Ind. Eng. Chem. Res., 2014, 53, 7141 CrossRef CAS.
- W. Barthlott and C. Neinhuis, Planta, 1997, 202, 1 CrossRef CAS.
- B. Bhushan, Y. C. Jung and K. Koch, Philos. Trans. R. Soc., A, 2009, 367, 1631 CrossRef CAS PubMed.
- B. Bhushan, K. Koch and Y. C. Jung, Ultramicroscopy, 2009, 109, 1029 CrossRef CAS PubMed.
- I. Sas, R. E. Gorga, J. A. Joines and K. A. Thoney, J. Polym. Sci., Part B: Polym. Phys., 2012, 50, 824 CrossRef CAS PubMed.
- J.-G. Kim, H. J. Choi, K.-C. Park, R. E. Cohen, G. H. McKinley and G. Barbastathis, Small, 2014, 10, 2487 CrossRef CAS PubMed.
- M. Sakhuja, J. Son, H. Yang, C. S. Bhatia and A. J. Danner, Sol. Energy, 2014, 110, 231 CrossRef CAS PubMed.
- J. Son, S. Kundu, L. K. Verma, M. Sakhuja, A. J. Danner, C. S. Bhatia and H. Yang, Sol. Energy Mater. Sol. Cells, 2012, 98, 46 CrossRef CAS PubMed.
- R. N. Gillanders, M. C. Tedford, P. J. Crilly and R. T. Bailey, Anal. Chim. Acta, 2005, 545, 189 CrossRef CAS PubMed.
- C. K. Ho and R. C. Hughes, Sensors, 2002, 2, 23 CrossRef CAS PubMed.
- O. Knopfmacher, M. L. Hammock, A. L. Appleton, G. Schwartz, J. Mei, T. Lei, J. Pei and Z. Bao, Nat. Commun., 2014, 5, 2954 CrossRef PubMed.
- Y. K. Cho, E. J. Park and Y. D. Kim, J. Ind. Eng. Chem., 2014, 20, 1231 CrossRef CAS PubMed.
- Y. H. Kim, M. G. Jeong, H. O. Seo, S. Y. Park, I. B. Jeong, K. D. Kim, S. M. Cho, D. C. Lim and Y. D. Kim, Appl. Surf. Sci., 2012, 258, 7562 CrossRef CAS PubMed.
- E. J. Park, Y. K. Cho, D. H. Kim, M. G. Jeong, Y. H. Kim and Y. D. Kim, Langmuir, 2014, 30, 10256 CrossRef CAS PubMed.
- E. J. Park, K. D. Kim, H. S. Yoon, M. G. Jeong, D. H. Kim, D. C. Lim, Y. H. Kim and Y. D. Kim, RSC Adv., 2014, 4, 30368 RSC.
- E. J. Park, J. K. Sim, M. G. Jeong, H. O. Seo and Y. D. Kim, RSC Adv., 2013, 3, 12571 RSC.
- H. O. Seo, M.-G. Jung, K.-D. Kim, Y. D. Kim, D. Chan Lim and K. H. Lee, Curr. Appl. Phys., 2013, 13, 31 CrossRef PubMed.
- V. Barbier, M. Tatoulian, H. Li, F. Arefi-Khonsari, A. Ajdari and P. Tabeling, Langmuir, 2006, 22, 5230 CrossRef CAS PubMed.
- M. D. Alba, Z. Luan and J. Klinowski, J. Phys. Chem., 1996, 100, 2178 CrossRef CAS.
- J. Shen, A. Luo, L. Yao, X. Lin, B. Zhou, G. Wu and X. Ni, Mater. Sci. Eng., C, 2007, 27, 1145 CrossRef CAS PubMed.
- J. Coates, in Encyclopedia of Analytical Chemistry, ed. R. A. Meyers, Newtown, 2000, ch. 2, pp. 2–4 Search PubMed.
- A. Mata, A. Fleischman and S. Roy, Biomed. Microdevices, 2005, 7, 281 CrossRef CAS PubMed.
- G. Orcel, J. Phalippou and L. L. Hench, J. Non-Cryst. Solids, 1986, 88, 114 CrossRef CAS.
Footnotes |
| † Electronic supplementary information (ESI) available. See DOI: 10.1039/c5ra05470b |
| ‡ These authors equally contributed to this work. |
| This journal is © The Royal Society of Chemistry 2015 |
