From nanorods of palygorskite to nanosheets of smectite via a one-step hydrothermal process

Wenbo Wangac, Zhifang Zhangab, Guangyan Tianab and Aiqin Wang*ac
aCenter of Eco-materials and Green Chemistry, Lanzhou Institute of Chemical Physics, Chinese Academy of Sciences, Lanzhou 730000, P. R. China. E-mail: aqwang@licp.cas.cn; Fax: +86 931 8277088; Tel: +86 931 4968118
bUniversity of the Chinese Academy of Sciences, Beijing 100049, P. R. China
cR&D Center of Xuyi Palygorskite Applied Technology, Lanzhou Institute of Chemical Physics, Chinese Academy of Sciences, Xuyi 211700, P. R. China

Received 24th March 2015 , Accepted 22nd June 2015

First published on 22nd June 2015


Abstract

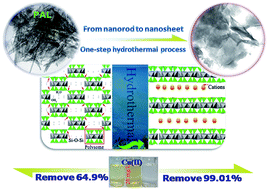
The structural evolution of silicate opens a new avenue to cognize its microstructure, intensify its properties and extend its application. Herein, the one-step transformation of palygorskite (PAL) nanorods into smectite nanosheets was successfully achieved under mild hydrothermal condition with no addition of any extra chemicals. The structural evolution of PAL at different reaction stages and the change in physico-chemical characteristics was intensively studied through field emission scanning electron microscopy (FESEM), transmission electron microscopy (TEM), X-ray diffraction (XRD), thermogravimetry (TG) and Fourier transform infrared spectroscopy (FTIR) techniques. The key factors determining the transformation process were clarified. It was found that the moderate mechanical grinding, pH values and the existence of dolomite are essential to realize the transformation, and alkaline condition may facilitate the transformation. The transformation from nanorods to nanosheets is a rebuilding process of crystals, and the c/2 slide of tetrahedrons represents the main transformation mechanism. After the hydrothermal process, the adsorption capability of RPAL for Cu(II) evidently enhanced by 167%, and 99.01% of Cu(II) ions (only 64.9% for raw PAL) can be removed from 20 mg L−1 of Cu(II) solution.

Introduction

As materials “greening the 21st century materials world”, earth-abundant silicate clay minerals have received unprecedented attention in both academic and industrial fields by virtue of their diversified crystal structure, excellent properties and eco-friendly advantages.1 These silicate materials are commonly built from the most plentiful elements on the earth (i.e., Si, O, Mg, Al, Fe, and Na) through varied assembly forms of Si(Al)O4 tetrahedrons and MO6 octahedrons (M denotes the metal element), and exhibit distinct texture, morphologies and physico-chemical features.

Palygorskite (PAL) is a special silicate clay mineral with a 2[thin space (1/6-em)]:[thin space (1/6-em)]1 ribbon-layer microstructure and a rod-like crystal habit.2 PAL is composed of ribbons of 2[thin space (1/6-em)]:[thin space (1/6-em)]1 phyllosilicate units, and each ribbon is connected to the next by the inversion of a SiO4 tetrahedron along a set of Si–O–Si bonds. The structure of the ribbon-layer phyllosilicate results in a fibrous habit, and thus forms zeolite-like channels (0.37 nm × 0.64 nm) running parallel to the fiber orientation.3 The intact PAL crystal is a tri-octahedral mineral in which the octahedral sites are all occupied by Mg2+ ions. However, the isomorphism effect that occurs during the formation process of natural PAL mineral makes some Mg2+ in the octahedral sites being partially replaced by trivalent cations, e.g., Al3+ and Fe3+ ions, to form dioctahedral or tri-/di-octahedral intermediate configurations.4 As a result, crystallographic defects could be found in the octahedral sheet of natural PAL, and a certain amount of mobile cations are also distributed in the crystal lattice as the compensation ions of the excess negative charges. So, natural PAL possesses a greater specific surface area, a higher ion-exchange capability and rich surface charges, and has been widely used as a colloidal agent,5 reinforcing agent,6 adsorbent,7 catalyst,8 and a light sensitized material,9 etc. Thus far, various methods have been employed to modify PAL for improving its properties.10 Of these, to regulate the properties of PAL by altering its crystal structure via an effective approach has recently attracted especial attention.

Hydrothermal technology has been developed as one of the most effective methods to synthesize silicates11 or regulate the structure of clay minerals.12 Some researches also concern the evolution behaviors of PAL crystals in order to explore the feasibility of transformation of the ribbon-layer mineral crystals.13 It was found that the PAL crystals may be broken and evolve as another crystal texture or morphology, but other undesirable impurity minerals, e.g., zeolites and analcite, could usually be generated during the evolution process of the PAL crystals. In addition, a high-concentration NaOH solution (pH > 12) or an extremely long reaction time (a few months) is required to trigger the transformation process. Therefore, how to achieve the evolution of PAL crystals in ambient conditions, with no addition of extra chemicals and the formation of other impurity minerals, still deserves to be explored further.

Herein, we firstly achieve the one-step transformation of PAL nanorods to nanosheets at ambient alkalescent condition (pH < 9) through a simple hydrothermal process. The transformation level can be controlled by altering the reaction time, and the transformation mechanism was intensively discussed in this paper. In addition, the effect of the crystal evolution of PAL on the adsorption properties was investigated using Cu(II) as the model adsorbate.

Experimental

Materials

PAL clay mineral was from Gaojiawa mine located in Xuyi county of Jiangsu Province, China. Magnesium sulfate heptahydrate (MgSO4·7H2O, AR grade) was purchased from Aladdin Reagent Co., Shanghai, China. All other reagents are of analytical grade, and all solutions were prepared with distilled water.

Pretreatment of natural PAL clay mineral

Natural PAL clay mineral was extruded once using a roller machine and then dispersed in distilled water under mechanical stirring (1000 rpm) to form a homogeneous suspension. The suspension was passed through a 300-mesh sieve to remove the quartz or other solid impurities. Then, the suspension was divided into two parts: the first part was directly centrifuged, dried and ball-milled for 6 h (marked as RPAL); the other part was adjusted to a pH of 5 using 0.5 mol L−1 HCl solution to remove the carbonates, and then washed, centrifuged, dried and ball-milled for 6 h (marked as APAL).

Hydrothermal reaction

RPAL powder (0.3 g) was uniformly dispersed in 60 mL of deionized water under magnetic stirring, and then the resultant suspension was transferred into a 100 mL Teflon tank, sealed and reacted at 180 °C for different time (2, 4, 8, 12, 24 and 48 h, respectively). The solid product was separated by centrifugation at 5000 rpm, fully washed and then dried at 60 °C under vacuum. The dried product was ground and passed through a 200-mesh sieve for further use. The as-prepared samples were marked as RPAL-2h, RPAL-4h, RPAL-8h, RPAL-12h, RPAL-24h and RPAL-48h, respectively. The change of pH value before and after the hydrothermal reaction was monitored using a pH-meter (FE20, Mettler Toledo, Switzerland). For a comparison, the APAL was also hydrothermally treated for 48 h at 180 °C, and the product was marked as APAL-48 h. The reaction parameters (i.e., the milling time of RPAL, reaction temperature, and pH values) were optimized and the results are shown in the ESI (Fig. S1–S5). Herein, the effect of reaction time was mainly discussed on the basis of the optimal conditions: milling time, 6 h; reaction temperature, 180 °C; pH, 8.5; solid/liquid ratio, 1/200.

Adsorption experiments

Adsorption experiments were performed by shaking the mixture of the adsorbent (0.025 g) and 25 mL of Cu(II) solution (200 mg L−1 or 20 mg L−1; pH 5) in a thermostatic shaker (THZ-98A) at 120 rpm and 30 °C, until reaching the adsorption equilibrium. The solution was rapidly separated from the solid by a 0.22 μm filter, and the concentration of Cu(II) ions in the solution was analyzed by a ICP plasma emission spectrometer (iACP 6300, Thermo Fisher, USA), and the adsorption capacity was calculated by the following eqn (1):
 
q = (C0Ce)V/m (1)
where q is the amount of Cu(II) adsorbed per unit mass of adsorbent at time t (qt, mg g−1) or at equilibrium (qe, mg g−1), V is the volume of the Cu(II) solution used (mL), C0 and Ce are the initial and final concentrations of the Cu(II) solution (mg L−1) and m is the mass of adsorbent (mg).

Characterization

FTIR spectra were recorded on a Nicolet NEXUS FTIR spectrometer in the range of 4000–400 cm−1 using KBr pellets. XRD patterns were collected on a X’pert PRO X-ray power diffractometer (PAN analytical Co., Netherlands) using Cu-Kα radiation of 0.1541 nm (40 kV, 30 mA). The surface morphologies were observed using a field emission scanning electron microscope (FESEM, JSM-6701F, JEOL, Japan) after coating the samples with a gold film. TEM images were taken on a JEM-1200 EX/S transmission electron microscope (TEM, JEOL, Tokyo, Japan). The N2 adsorption–desorption isotherms and pore structure parameters were measured on a ASAP 2010 analyzer (Micromeritics, USA) at 77 K. The specific surface area (SBET) was calculated by the BET method, the micropore volumes (Vmicro) were calculated by the t-plot method, and the average pore size (PZ) was calculated from PZ = 4V/A, where V is the total volume of pores (obtained from the volume of N2 held at the relative pressure P/P0 = 0.95) and A is the BET surface area. The zeta potential was measured using a Malvern Zetasizer Nano system with irradiation from a 633 nm He–Ne laser (ZEN3600) at 25 °C, using a folded capillary cell. The thermogravimetric analysis (TGA) was performed on a Diamond TG-DTA 6300 thermoanalyzer under a N2 atmosphere from 30 to 800 °C at a heating rate of 10 °C min−1.

Results and discussion

FESEM and TEM analysis

As shown in Fig. 1 and 2, the FESEM and TEM results clearly reveal the change in the morphology of RPAL and APAL. The obvious nanorods with a length of about 0.2–1.0 μm could be observed in the FESEM and TEM of RPAL (Fig. 1a and 2a). After the hydrothermal reaction, the number of RPAL rods gradually reduced and simultaneously the number of nanosheets increased, which implies the transformation of RPAL from nanorods to nanosheets (Fig. 1b–g and 2b–g). The transformation level can be controlled by adjusting the reaction time. At a reaction time of 2–8 h, some PAL nanorods become slightly shorter, and the sheet-like crystals begin to appear. When the reaction time increases to 12 h, the nanorods are further reduced and the proportion of sheets further increases. At a reaction time above 24 h, the RPAL nanorods were almost completely transformed to nanosheets. However, the rod-like morphology of APAL still remained after being hydrothermally treated for 48 h (Fig. 1h and 2h), with no obvious transformation of the APAL rod crystals. This reveals that the removal of the carbonate after acidification (APAL) treatment is adverse to the transformation process. This result is also proved by the FESEM analysis of RPAL after the hydrothermal reaction at different pH values. As shown in Fig. S6, RPAL does not transform under acidic conditions (pH ≤ 6), but tends to be transformed at pH > 6. As for APAL, the nanorods still keep well after the hydrothermal reaction at each pH value (Fig. S6) and each reaction time (Fig. S7), which reveals that the carbonate associated with RPAL plays an important role in the transformation of the RPAL crystals.
image file: c5ra05187h-f1.tif
Fig. 1 FESEM micrographs of (a) RPAL, (b) RPAL-2h, (c) RPAL-4h, (d) RPAL-8h, (e) RPAL-12h, (f) RPAL-24h, (g) RPAL-48h and (h) APAL-48h.

image file: c5ra05187h-f2.tif
Fig. 2 TEM micrographs of (a) RPAL, (b) RPAL-2h, (c) RPAL-4h, (d) RPAL-8h, (e) RPAL-12h, (f) RPAL-24h, (g) RPAL-48h and (h) APAL-48h.

XRD analysis

The FESEM and TEM results clearly indicate the change in the crystal morphology of RPAL and APAL after the hydrothermal reaction, but the following questions need to be explored: (i) how does the crystal change? (ii) What crystal phase was finally formed? Fig. 3 shows the XRD patterns of RPAL before and after the reaction. As can be seen, the characteristic diffraction peaks of RPAL appear at 2θ = 8.36° (d = 1.0568 nm, 110 crystal plane), 2θ = 13.89° (d = 0.6371 nm, 200 crystal plane), 2θ = 16.54° (d = 0.5355 nm, 130 crystal plane), 2θ = 19.81° (d = 0.4478, 040 crystal plane) and 2θ = 35.09° (d = 0.2555 nm, 400 crystal plane).2 After the hydrothermal reaction, the (110) and (200) diffraction peaks of RPAL gradually disappeared at the reaction time 48 h, indicating that the ribbon-layer structure of RPAL was disintegrated. Along with the reduction of the (110) peaks of RPAL, the new peak at 2θ = 6.05° (d = 1.4597 nm), ascribed to the (001) diffraction peak of smectite,14 begins to appear after being reacted for 4 h. It is obvious that the disappearance of RPAL crystal and the formation of smectite crystal simultaneously occurred during the reaction, which confirms that the formation of smectite was derived from the transformation of RPAL. The RPAL-48h sample exhibits the strongest diffraction peak of the (001) crystal plane, which indicates that the RPAL crystal was almost completely transformed to the smectite crystal at this reaction time. As for APAL, the intensity of the (110) diffraction peak has no obvious change after the hydrothermal reaction for different time (Fig. S7), indicating that the APAL crystal does not transform. It deserves to be pointed out that no new crystal phase generates during the hydrothermal reaction process, which further proves that the formation of smectite is derived from the transformation of the RPAL crystal.
image file: c5ra05187h-f3.tif
Fig. 3 XRD patterns of (a) RPAL, (b) RPAL-2h, (c) RPAL-4h, (d) RPAL-8h, (e) RPAL-12h, (f) RPAL-24h, (g) RPAL-48h and (h) APAL-48h.

The XRD analysis also proves the change of carbonate during the reaction (Fig. 3). The diffraction peak of dolomite at 2θ = 31.02° (d = 0.2881 nm)15 clearly weakens with prolonging the reaction time. Simultaneously, the peak of calcite at 2θ = 29.52° (d = 0.3024 nm) was intensified, which confirms that the dolomite also participates in the reaction. Dolomite (MgCa(CO3)2) is a crystalline mineral that is usually associated with RPAL. The decrease of dolomite and the increase of calcite in the product after the hydrothermal reaction confirmed that dolomite may transform to calcite (CaCO3), and some Mg2+ ions were slowly released during the reaction. So, it can be presumed that the transformation of the crystal is closely related to dolomite (MgCa(CO3)2), instead of calcite. This can also be confirmed by the fact that the introduction of CaCO3 into APAL does not cause the change of the APAL crystal after the hydrothermal reaction (Fig. S8). At lower pH values, RPAL can’t be transformed, and at all pH values, APAL can’t be transformed (Fig. S6). This is all attributed to the removal of dolomite by the acidification treatment.

From the XRF chemical composition analysis (Table S1), it can be seen that the content of MgO in RPAL is 6.74%, which increases to 7.40% after being reacted for 48 h. The existence of a higher content of Mg in the product confirms that the resultant product is a Mg-rich smectite. The EDS and element mapping analyses also confirmed the existence of the elements of Mg, Al and O in both RPAL and smectite, and reflect the uniform distribution of the Mg element in the smectite product (Fig. S9–S12), which confirms that the Mg elements still combine with O to form Mg–O bonds.

FTIR spectra analysis

The FTIR spectra of RPAL before and after the hydrothermal reaction are shown in Fig. 4. As can be seen, the bands of RPAL at about 3615 cm−1 (the O–H stretching vibration of Al2OH in dioctahedral coordination), 3547 cm−1 (the O–H stretching vibrations of (Fe, Mg)O–H and (Al, Mg)O–H), 1196 cm−1 (the Si–O–Si stretching vibration linking two reversible tetrahedrons) and 985 cm−1 (the Si–O–Mg asymmetric stretching vibration) almost disappeared after the hydrothermal reaction for 48 h, which confirms that the ribbon-layer structure of RPAL was broken during the reaction.16 The band at 1652 cm−1 (the H–O–H bending vibration of zeolite and bonding water molecules) shifts to a lower wavenumber region (1646 cm−1 for RPAL-2h, 1643 cm−1 for RPAL-4h, 1643 cm−1 for RPAL-8h, 1640 cm−1 for RPAL-12h, 1637 cm−1 for RPAL-24h and 1636 cm−1 for RPAL-48h).
image file: c5ra05187h-f4.tif
Fig. 4 FTIR spectra of (a) RPAL, (b) RPAL-2h, (c) RPAL-4h, (d) RPAL-8h, (e) RPAL-12h, (f) RPAL-24h, (g) RPAL-48h and (h) APAL-48h.

The characteristic bands of dolomite at 1456 cm−1 gradually weaken and shift to low-wavenumber regions (1453 cm−1 for RPAL-2h, 1451 cm−1 for RPAL-4h, 1450 cm−1 for RPAL-8h, 1450 cm−1 for RPAL-12h, 1448 cm−1 for RPAL-24h and 1429 cm−1 for RPAL-48h), indicating that the dolomite was transformed to calcite during the hydrothermal reaction. The absorbance peak of carbonate disappeared after the acid treatment, and the characteristic absorption bands of APAL have no obvious change after the hydrothermal reaction at different pH values. The absorbance bands of RPAL have no obvious change after the reaction at pH ≤ 6, but evidently changed after the reaction at pH > 6 (Fig. S4). These results are consistent with the FESEM, TEM and XRD analyses.

TG analysis

After the hydrothermal reaction, the existence state of the water molecules in the samples were changed, as confirmed by FTIR analysis. In fact, there are four kinds of water molecules in the PAL crystal, e.g., adsorbed water, zeolitic water, coordination water and structural water, which presents the main character of the ribbon-layer mineral.17–19 These water molecules are coordinated with the metal cations at the edge of the octahedron sheet and associated with other water molecules or –OH groups.20 Differing from PAL, smectite is a 2[thin space (1/6-em)]:[thin space (1/6-em)]1 sheet-shape silicate clay mineral with a sandwich configuration and exchangeable interlayer cations. The water molecules are imbedded between the layers by a hydration form with the metal cations.21 Thus, the thermal decomposition behaviors of smectite are certainly different from those of PAL.

The TGA curves of RPAL before and after the hydrothermal reaction are shown in Fig. 5. As can be seen, RPAL shows a typical five-step thermal weight-loss process.22 The mass loss of about 3.79% (30–96.63 °C) is due to the removal of the adsorbed water and the first part of the zeolitic water. The mass loss of about 1.66% (96.63–208.03 °C) is due to the removal of the residual zeolitic water. The mass loss of about 1.39% (208.03–344.14 °C) is attributed to the removal of the first part of the coordination water (OH2, M3 sites). The mass loss of about 5.2% (344.14–622.69 °C) results from the release of the residual coordination water and some of the structural water (OH), which may cause the collapse of the RPAL crystal framework at 622.69 °C and the formation of “palygorskite anhydride”.23,24 The mass loss of about 8.8% is due to the elimination of the structural water and the decomposition of carbonate. After hydrothermal treatment for 2 h and 4 h, the thermal decomposition behavior of the product is similar with that of RPAL, which implies that a lot of RPAL exists in the hydrothermal product. When increasing the reaction time above 24 h, only a three-step thermal decomposition was observed, and the total mass loss is lower than that of RPAL, which confirms that the new crystal phase was formed after a reaction time above 24 h.


image file: c5ra05187h-f5.tif
Fig. 5 TGA curves of RPAL before and after the hydrothermal reaction for different time.

N2 adsorption–desorption isotherm

Fig. 6 shows the N2 adsorption–desorption isotherms of RPAL before and after the hydrothermal reaction. All the isotherms can be classified as type-I and IV isotherms with H3-type hysteresis, according to IUPAC classification.25 The N2 adsorption amount gradually increased in the range of lower P/P0 (≤0.60 for RPAL, RPAL-4h, RPAL-8h, APAL-48h; ≤0.40 for RPAL-24h and RPAL-48h), and the adsorption–desorption curves overlap, which reveals the existence of a small amount of micropores.26 The N2 adsorption amount sharply increased when increasing the P/P0 above 0.6 (for RPAL, RPAL-4h, RPAL-8h, APAL-48h) or 0.4 (for RPAL-24h and RPAL-48h) due to the capillary condensation effect and multilayer adsorption of N2 on the mesopores (and/or macropores), which confirms the existence of slit-shape mesopores and/or macropores derived from the slit-like aggregates of plate-like particles.26–28
image file: c5ra05187h-f6.tif
Fig. 6 N2 adsorption–desorption isotherms of PAL before and after the hydrothermal reaction for 4 h, 8 h, 24 h, and 48 h.

For the RPAL sample, the hysteresis loops at the relative pressure P/P0 > 0.6 are very narrow, indicating that RPAL has a relatively broader pore size distribution, with the existence of many meso- and macropores. With the prolonging of the reaction time (≤8 h), the N2 adsorption–desorption isotherms have no obvious change in shape, and only the adsorbed amount of N2 is slightly changed. As for APAL, the shape of the isotherm of APAL-48h is almost identical to APAL, indicating that the hydrothermal reaction does not change the crystal structure of APAL. However, the isotherm of RPAL was evidently changed after the hydrothermal reaction for more than 24 h. The region of overlap of the adsorption–desorption curves is located at P/P0 ≤ 0.4, which is different from the samples RPAL-2h–8h (P/P0 ≤ 0.6). The hysteresis loops become broad when P/P0 > 0.4, which implies the diminishment of micropores and the increase of mesopores.

The pore size distributions (PSDs) can be calculated by the BJH (Barrett–Joyner–Halenda) method from the adsorption branches.29 As shown in Fig. 7, the pore size distribution curve of RPAL mainly shows two peaks: (i) the pores at 3.50–3.92 nm (the inset in Fig. 7), which arise from the close packing of the boundaries of individual rods; and (ii) the pores at about 11.95–26.98 nm, attributed to the aggregation of micro-particles and the gaps between the bundles of rods.30 The intensity and position of the first peaks of RPAL only change a little after hydrothermal reaction for 4–8 h, but shift to 3.71 nm for RPAL-24h and 3.92 nm for RPAL-48h. Simultaneously, the intensity of the peak evidently increased, which confirms that more small-size mesopores were formed after the hydrothermal reaction above 24 h. The second peaks ascribed to the mesopores appear at 23.01 nm (for RPAL), 27.61 nm (for RPAL-2h), 24.43 nm (for RPAL-4h), 22.09 nm (for RPAL-8h), 15.24 nm (for RPAL-24h), 12.06 nm (for RPAL-48h) and 29.87 nm (for APAL-48h). The intensities of the peaks follow the order of APAL-48h > RPAL-4h > RPAL > RPAL-8h > RPAL-24h > RPAL-48h. This information indicates that the transformation of RPAL nanorods to nanosheets is favorable to increase the small-size pores; whereas the hydrothermal treatment of APAL may lead to the obvious increase of mesopores.


image file: c5ra05187h-f7.tif
Fig. 7 Pore size distribution curves of PAL before and after hydrothermal treatment.

Table S2 lists the specific surface area (SBET), micropore volume (Vmicro), average pore size (PZ) and total pore volume (PV). It was revealed that the SBET, Smicro and Vmicro values decreased and the PZ and PV initially increased and then decreased with the prolonging of the reaction time. The decreasing tendency of Smicro and Vmicro is more obvious, indicating that the micropores were destroyed or transformed to mesopores during the reaction. Correspondingly, the SBET changed from 123.83 (for RPAL) to 117.81 (for RPAL-2h), 116.15 (for RPAL-4h), 105.35 (for RPAL-8h), 98.61 (for RPAL-24h) and 94.06 m2 g−1 (for RPAL-48h) due to the re-arrangement of the crystal structure.

Zeta potential

The zeta potential of RPAL before and after the hydrothermal treatment is shown in Fig. 8a. As can be seen, the zeta potentials increase from −17.9 mV to −12.1 mV with increasing reaction time up to 8 h, and then tend to be constant, which means that the surface charges do not change further when most of the RPAL rods were transformed to sheets. Fig. 8b illustrates the change in the pH values of the reaction medium. The initial pH value is about 8.94, but it sharply decreased to 8.03, 7.29, 7.2, 7.19, 6.88 and 6.79 after reaction time of 2, 4, 8, 12, 24 and 48 h, respectively. This indicates that the alkali contributes to the transformation process12c and the transformation reaction reaches equilibrium at reaction time above 24 h.
image file: c5ra05187h-f8.tif
Fig. 8 Variation of (a) zeta potentials of RPAL and (b) pH values of the reaction medium against the different reaction time.

Proposal of the transformation mechanism

As for the transformation process, the following questions deserve further explanation: (i) what factors are key to the transformation? (ii) How do the rods transform? Structurally, the formation of a 2[thin space (1/6-em)]:[thin space (1/6-em)]1-type smectite needs two essential conditions: (1) sheets composed of two continuous tetrahedral layers and one continuous octahedral layer; (2) sufficient interlayer cations.

Harder31 points out that alkali conditions and a moderate amount of Mg2+ are necessary for the formation of smectite. Kloprogge et al.32 also found that the presence of Mg2+ ions seems to be essential for the formation of smectite; even for the formation of montmorillonite that contains tiny amounts of Mg. Golden and Dixon13c also proposed that the precipitation of smectite in 0.15 mol L−1 NaOH solution is largely determined by the concentration of Mg2+ ions. It has been confirmed that the existence of dolomite (CaMg(CO3)2) is important to the transformation of the RPAL crystal. The dolomite (CaMg(CO3)2) could release free Mg2+ ions to form CaCO3. The decrease in pH values (Fig. 8b) during the reaction facilitates the disassociation of Mg2+ ions from dolomite. The moderate amount of Mg2+ ions released from dolomite promotes the transformation of PAL to smectite. In a difference to previous researches that reported that the hydrothermal evolution of a PAL crystal needs a concentrated NaOH solution,13c,33 the currently developed method may achieve the transformation of a PAL crystal to smectite at mild pH conditions.

As is known, the PAL crystal has a ribbon-layer structure, composed of two continuous tetrahedral layers and one discontinuous octahedral layer (Scheme 1). The adjacent reverse tetrahedrons are connected by Si–O–Si bonds to form pyroxene-shaped ribbons. In the smectite, the free apical O atom in the SiO4 tetrahedron is in the same direction; whereas the free O atom in the SiO4 tetrahedron of PAL was reversibly oriented, with the interval of four SiO4 units. The ribbons in the PAL crystal are attached to each other only by Si–O–Si bonds located at their four corners. If the PAL crystal was transformed to smectite crystals, the Si–O–Si bridge bonds connecting the ribbons would need to be broken, and the tetrahedrons with opposite direction also would need to be reversed to the same direction. As reported previously,34 moderate alkali attack may break the Si–O–Si bonds. Under the action of strong alkali, the Si–O–Si and Si–O–Mg bonds could be broken to form –Si–O groups,13b and the connection between two tetrahedrons may be cut off. Generally, strong alkali attack may cut off each Si–O–Si bond in the crystal framework, but the alkalescent action could only break the bonds with a relatively high potential energy, such as the Si–O–Si bonds connecting the reversible SiO4 tetrahedrons. It was revealed that the relatively higher pH values, moderate grinding and lower solid/liquid ratio could promote the transformation of RPAL crystals (see Fig. S1 and S4), because the breakage of the Si–O–Si bonds was accelerated.


image file: c5ra05187h-s1.tif
Scheme 1 Proposed mechanisms for the transformation from RPAL nanorods to nanosheets. The red arrows represent the Si–O–Si bonds as possible breakage points.

The dissolution–recrystallization process was commonly recognized as the main mechanism for the formation of a new crystal phase. If the recrystallization process occurred, the transformation process of the crystal should be very fast, and the impurity phase may be easily formed during the re-crystallization process. However, the transition state from RPAL rods to smectite sheets can be clearly observed, and no new impurity phase was formed. So, the re-arrangement process of the tetrahedrons and octahedrons in the PAL crystal may be the main mechanism. XRD analysis also confirms that the tetrahedrons in RPAL still remain during the reaction, because the (400) peak of RPAL at 2θ = 35.09° (related to the SiO4 tetrahedrons) does not obviously change after the transformation. These individual tetrahedrons tend to be re-arranged to form more stable crystals. The re-connection of the building block “polysome” (Scheme 1) follows the nearby principle, and is regularly bonded with the most adjacent Si–O tetrahedrons.12b The Al3+ and Mg2+ may participate in the formation of new Mg(O, OH)6 and Al(O, OH)6 octahedrons. PAL has a rather delicate crystal structure, and the ribbons may change to a more stable configuration by the rearrangement of tetrahedrons and octahedrons (“polysome” as the main blocks), with the c/2 glide and reestablishment of the Si–O–Si and Mg–OH–Mg bonds connecting the different “polysomes”.

Adsorption properties

As shown in Fig. 9, the adsorption properties of RPAL for Cu(II) ions were evidently enhanced after the hydrothermal treatment. The equilibrium adsorption capacity of RPAL is only 35.4 mg g−1 (initial Cu(II) concentration, 200 mg L−1), but it increases to 115.39 mg g−1 after hydrothermal treatment for 48 h. More importantly, the RPAL-48h can remove 99.01% of Cu(II) ions from a 20 mg L−1 Cu(II) solution at the dosage of 1 g L−1, which is obviously higher than that of RPAL (only 64.9%). The highly efficient removal of Cu(II) ions can also be visibly indicated by the change in color of the Cu(II) solution after adsorption (the inset in Fig. 9). It is obvious that the Cu(II) solution with an initial concentration of 20 mg L−1 shows a deep yellow color after adding neocuproine hemihydrate (the chromogenic reagent of Cu(II)). After adsorption with RPAL, the color of the solution slightly becomes lighter; whereas the solution after adsorption with RPAL-48h almost becomes colorless after adding the chromogenic reagent, which implies a much lower residual concentration of Cu(II) ions. Obviously, the resultant smectite has a relatively higher adsorption capacity than RPAL, because the cationic exchange capacity (CEC) of RPAL (22.4 mmol per 100 g) was greatly enhanced after the transformation to smectite (69.2 mmol per 100 g), which is favorable in enhancing the adsorption capacity for Cu(II) ions.
image file: c5ra05187h-f9.tif
Fig. 9 Adsorption capacity (a) and removal ratio (b) of RPAL for Cu(II) ions before and after the hydrothermal treatment for different times. The inset is the digital photos of the Cu(II) solution before and after adsorption (after adding a chromogenic reagent).

The EDS analysis and element mapping of the RPAL-48h sample after adsorption was measured to explore the adsorption mechanism (Fig. S13 and S14). Besides the Si, Al, O and Mg elements, the Cu element was also observed with a uniform distribution in the Cu(II)-loaded RPAL-48h sample. After adsorption, the specific surface area decreases from 95 to 60 m2 g−1, which implies that some pores were blocked by the adsorbed Cu(II). Meanwhile, the zeta potential of RPAL-48h becomes positive after the adsorbance of Cu(II). These results prove that the ion-exchange, electrostatic and complexing interactions of active surface groups contribute to the adsorption of Cu(II).

Conclusions

In summary, RPAL nanorods were successfully transformed to smectite nanosheets in mild alkalescent conditions by a simple one-step hydrothermal process. It was confirmed that the occurrence of crystal transfer is closely related to the dolomite that co-existed in the mineral, and that a moderate amount of Mg2+ ions and alkali conditions are essential for the transformation. The moderate grinding, a higher pH value and a longer reaction time are favorable for the transformation. The transformation level could be controlled by adjusting the reaction time, and the transformation process could be completed at a reaction time above 24 h. No new crystal phase generates during the transformation process, and a pure smectite crystal phase can be obtained. This suggests a rearrangement and transformation mechanism of the RPAL crystal, instead of a conventional recrystallization process. The adsorption properties of PAL for Cu(II) were evidently enhanced by 167%. As a whole, the transformation of the RPAL crystal into another nanomaterial opens a new avenue to recognize the microstructure (remarked as “genome”) of PAL, control the crystal morphology and develop more high-performance functional materials.

Acknowledgements

The authors would like to thank the “863” Project of the Ministry of Science and Technology, P. R. China (no. 2013AA032003) and the National Natural Science Foundation of China (no. 51403221) for financial support of this research.

References

  1. (a) Handbook of Clay Science, ed. F. Bergaya, B. K. Theng and G. Lagaly, vol. 1, Elsevier, 2011 Search PubMed; (b) S. Sinha Ray and M. Bousmina, Prog. Mater. Sci., 2005, 50(8), 962–1079 CrossRef PubMed.
  2. (a) W. D. Bradley, Am. Mineral., 1940, 25, 405–410 CAS; (b) E. Galán, J. M. Mesa and C. Sánchez, Appl. Clay Sci., 1994, 9, 293 CrossRef.
  3. (a) E. Gálan, Clay Miner., 1996, 31, 443–453 Search PubMed; (b) D. A. Mckeown, J. E. Post and E. S. Etz, Clays Clay Miner., 2002, 50, 667–680 CrossRef CAS.
  4. S. Guggenheim and M. P. S. Krekeler, The structures and microtextures of the palygorskite–sepiolite group minerals. Developments in palygorskite–sepiolite research: a new outlook on these nanomaterials, Dev. Clay Sci., 2011, 3, 3–32 CAS.
  5. (a) W. B. Wang, F. F. Wang, Y. R. Kang and A. Q. Wang, Powder Technol., 2015, 269, 85–92 CrossRef CAS PubMed; (b) J. X. Xu, W. B. Wang, A. Q. Wang and M. S. Zheng, Powder Technol., 2014, 261, 98–104 CrossRef CAS PubMed.
  6. (a) E. Ruiz-Hitzky, M. Darder, F. M. Fernandes, B. Wicklein, A. C. S. Alcântara and P. Aranda, Prog. Polym. Sci., 2013, 38, 1392–1414 CrossRef CAS PubMed; (b) L. An, Y. Pan, X. Shen, H. Lu and Y. Yang, J. Mater. Chem., 2008, 18(41), 4928–4941 RSC; (c) H. L. Lu, W. B. Wang and A. Q. Wang, RSC Adv., 2015, 5, 17775–17781 RSC.
  7. (a) A. J. Xie, L. Ji, S. P. Luo, Z. L. Wang, Y. Y. Xu and Y. Kong, New J. Chem., 2014, 38, 777–783 RSC; (b) S. S. Gupta and K. G. Bhattacharyya, RSC Adv., 2014, 4, 28537–28586 RSC.
  8. (a) J. Liu and G. K. Zhang, Phys. Chem. Chem. Phys., 2014, 16, 8178–8192 RSC; (b) W. B. Wang, F. F. Wang, Y. R. Kang and A. Q. Wang, RSC Adv., 2013, 3, 11515–11520 RSC; (c) D. Papoulis, S. Komarneni, D. Panagiotaras, A. Nikolopoulou, H. H. Li, S. Yin, S. Tsugio and H. Katsuki, Appl. Clay Sci., 2013, 83–84, 191 CrossRef CAS PubMed.
  9. (a) J. Xu, Z. H. Sun, L. Jia, B. Li, L. Zhao, X. Liu, Y. F. Ma, H. Tian, Q. Wang, W. S. Liu and Y. Tang, Dalton Trans., 2011, 12909–12916 RSC; (b) J. Xu, Y. Zhang, H. Chen, W. S. Liu and Y. Tang, Dalton Trans., 2014, 7903–7910 RSC.
  10. (a) A. S. Bhatt, P. L. Sakaria, M. Vasudevan, R. R. Pawar, N. Sudheesh, H. C. Bajaj and H. M. Mody, RSC Adv., 2012, 2, 8663–8671 RSC; (b) N. Frini-Srasra and E. Srasra, Desalination, 2010, 250, 26–34 CrossRef CAS PubMed; (c) W. B. Wang, G. Y. Tian, Z. F. Zhang and A. Q. Wang, Chem. Eng. J., 2015, 265, 228–238 CrossRef CAS PubMed; (d) J. Zhang, D. Q. Cai, G. L. Zhang, C. J. Cai, C. L. Zhang, G. N. Qiu, K. Zheng and Z. Y. Wu, Appl. Clay Sci., 2013, 83–84, 137–143 CrossRef CAS PubMed.
  11. (a) B. Milke, P. Strauch, M. Antoniettia and C. Giordano, Nanoscale, 2009, 1, 110–113 RSC; (b) Q. H. Zhao, X. Y. Liu, M. L. Sun, C. F. Du and Z. L. Liu, RSC Adv., 2015, 5, 36948–36956 RSC; (c) H. Deng and Y. Ge, RSC Adv., 2015, 5, 9180–9188 RSC.
  12. (a) K. Shen, W. Qian, N. Wang, J. Zhang and F. Wei, J. Mater. Chem. A, 2013, 1(10), 3272–3275 RSC; (b) N. Güven and L. L. Carney, Clays Clay Miner., 1979, 27(4), 253–260 Search PubMed; (c) Z. F. Zhang, W. B. Wang and A. Q. Wang, Appl. Surf. Sci., 2015, 329, 306–314 CrossRef CAS PubMed.
  13. (a) R. S. Merkl, A sedimentological, mineralogical, and geochemical study of the fuller’s earth deposits of the Miocene Hawthorne group of south Georgia-north Florida, PhD dissertation, Indiana University, Bloomington, Indiana, 1989, 182, p. 198; (b) D. C. Golden, J. B. Dixon, H. Shadfar and L. A. Kippenberger, Clays Clay Miner., 1985, 33, 44–50 CAS; (c) D. C. Golden and J. B. Dixon, Clays Clay Miner., 1990, 38, 401–408 CAS.
  14. (a) D. M. Moore and R. C. Reynolds, X-ray Diffraction and the Identification and Analysis of Clay Minerals, vol. 378, Oxford, Oxford university press, 1989 Search PubMed; (b) J. Srodon, Clays Clay Miner., 1980, 28(6), 401 CAS.
  15. M. Samtani, D. Dollimore, F. W. Wilburn and K. Alexander, Thermochim. Acta, 2001, 367, 285–295 CrossRef.
  16. (a) R. L. Frost, O. B. Locos, H. Ruan and J. T. Kloprogge, Vib. Spectrosc., 2001, 27, 1–13 CrossRef CAS; (b) V. Gionis, G. H. Kacndes, I. D. Kastritis and G. D. Chryssikos, Am. Mineral., 2006, 91, 1125–1133 CrossRef CAS; (c) M. S. Augsburger, J. C. Pedregosa, E. Strasser, E. Perino and R. C. Mercader, J. Phys. Chem. Solids, 1998, 59, 175–180 CrossRef CAS.
  17. R. Giustetto and G. Chiari, Eur. J. Miner. Process. Environ. Prot., 2004, 16, 521–532 CrossRef CAS.
  18. E. Galan and A. Singer, Development in Clay Science 3, Developments in palygorskite–sepiolite research: a new outlook on these nanomaterials., ch. 2, Elsevier, 2011 Search PubMed.
  19. B. Rhouta, E. Zatile, L. Bouna, O. Lakbita, F. Maury, L. Daoudi, M. C. Lafont, M. Amjoud, F. Senocq, A. Jada and A. A. Aghzzaf, Phys. Chem. Miner., 2013, 40, 411–424 CrossRef CAS.
  20. R. Giustetto and G. Chiari, Eur. J. Miner. Process. Environ. Prot., 2004, 16, 521–532 CrossRef CAS.
  21. M. F. Brigatti, E. Galan and B. K. G. Theng, Structures and mineralogy of clay minerals. Handbook of Clay Science, 2006, vol. 1, pp. 19–69 Search PubMed.
  22. H. B. Liu, T. H. Chen, D. Y. Chang, D. Chen, C. S. Qing, J. J. Xie and R. L. Frost, J. Therm. Anal. Calorim., 2013, 111, 409–415 CrossRef CAS PubMed.
  23. R. Guistetto and R. Compagnoni, Clay Miner., 2011, 46, 371–385 CrossRef PubMed.
  24. B. Hamdi, Etude physic-chimique de la surface des diatomites, PhD thesis, University of Science and Technology Houari Boumediene (USTHB), 1998, pp. 635–642.
  25. K. S. W. Sing, D. H. Everett, R. A. W. Haul, L. Moscou, R. A. W. Pierotti, J. Rouquérol and T. Siemieniewska, Pure Appl. Chem., 1985, 57, 603 CrossRef CAS.
  26. F. Rouquerol, J. Rouquerol and K. Sing, Adsorption by Powders and Porous Solids: Principles, Methodology and Applications, Academic Press, London, 1999 Search PubMed.
  27. A. Bakandritsos, T. Steriotis and D. Petridis, Chem. Mater., 2004, 16, 1551 CrossRef CAS.
  28. X. Z. Bu, G. K. Zhang, Y. Y. Gao and Y. Q. Yang, Microporous Mesoporous Mater., 2010, 136, 132–137 CrossRef CAS PubMed.
  29. E. P. Barrett, L. G. Joyner and P. P. Halenda, J. Am. Chem. Soc., 1951, 73, 373 CrossRef CAS.
  30. (a) T. H. Chen, X. C. Xu, A. H. Lu, S. C. Yue, J. Q. Wang and S. C. Peng, J. Rare Earths, 2003, 21, 478 Search PubMed; (b) A. Al-Futaisi, A. Jamrah and R. Al-Hanai, Desalination, 2007, 214, 327 CrossRef CAS PubMed.
  31. H. Harder, Chem. Geol., 1972, 10, 31–39 CrossRef CAS.
  32. J. T. Kloprogge, S. Komarneni and J. E. Amonette, Clays Clay Miner., 1999, 47, 529–554 CAS.
  33. S. Komarneni, Clays Clay Miner., 1989, 37, 469–473 CAS.
  34. A. Cizmek, B. Subotic and R. Aiello, et al., Microporous Mater., 1995, 4, 159–168 CrossRef CAS.

Footnote

Electronic supplementary information (ESI) available. See DOI: 10.1039/c5ra05187h

This journal is © The Royal Society of Chemistry 2015
Click here to see how this site uses Cookies. View our privacy policy here.