High apparent strengthening efficiency for reduced graphene oxide in copper matrix composites produced by molecule-lever mixing and high-shear mixing

Lidong Wanga, Ye Cuia, Bin Lia, Shuai Yanga, Ruiyu Lia, Zheng Liub, Robert Vajtai*c and Weidong Fei*ad
aSchool of Materials Science and Engineering, Harbin Institute of Technology, Harbin, 150001, China. E-mail: wdfei@hit.edu.cn; Tel: +86 451 86418647
bSchool of Materials Science & Engineering Nanyang Technological University, N4.1-01-10, 50 Nanyang Avenue, Singapore 639798
cDepartment of Materials Science and Nano Engineering, Rice University, Houston, Texas, USA 77005. E-mail: Vajtai@rice.edu; Tel: +1 713 348 5904
dSchool of Mechanical Engineering, Qinghai University, Xining 810016, China

Received 18th March 2015 , Accepted 1st June 2015

First published on 1st June 2015


Abstract

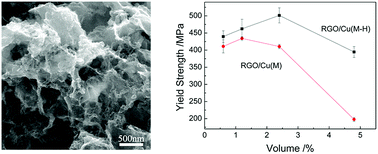
Reduced graphene oxide (RGO) reinforced copper matrix composites (RGO/Cu composites) with volume fractions of RGO from 0.6 to 4.8 vol.% were produced based on a molecular-level mixing method (MLM). High-shear mixing was introduced in the process of MLM by using a rotor-stator mixer, which could make the RGO sheets distributed in the composite more homogeneous and improve the properties of the composites. The MLM method integrated with high-shear mixing is abbreviated as M-H. The effect of high-shear mixing on the mechanical properties of the composites with different volume fractions of graphene was studied. The yield strength of the 2.4 vol.% RGO/Cu composite produced by M-H method is 501.3 MPa, which is more than three times higher than that of the Cu matrix. RGO shows extremely high strengthening effect; the apparent strengthening efficiency of RGO in the 0.6 vol.% RGO/Cu composite is as high as 321.7, even higher than CNTs. The results show that the M-H method is hopeful to be applied to produce many kinds of graphene based composites.

1 Introduction

Graphene, a two-dimensional atomic crystal composed of sp2-bonded carbon atoms,1 has a range of extraordinary mechanical, physical and chemical properties, such as outstandingly high strength (130 GPa),2 remarkable electron mobility (15[thin space (1/6-em)]000 cm2 V−1 s−1)3 and super high thermal conductivity (5000 W mK−1).4 Many methods have been developed to produce graphene and CNS,5 such as micromechanical cleavage of graphite,1 chemical vapor deposition (CVD),6 epitaxial growth on SiC,7,8 exfoliation by sonication,9 chemical oxidation and reduction method,10,11 self-propagating high-temperature synthesis,12 conventional calcination,13 unzipping of carbon nanotubes14,15 and laser reduction of graphene oxide,16–19 arc discharge technique.20 The superb properties of graphene make it an excellent candidate for many applications such as thermal managements, catalyst,21 batteries,22 super capacitors23 and composites.2 Among them, one of the most immediate application for graphene is used as reinforcement in composite materials.24

The potential of graphene as a reinforcing material for polymer composites has been shown in many works. It has been reported that the electrical conductivity, Young's modulus, tensile strength and other properties of the polymer matrix were remarkably increased with the introducing of graphene.25–30 Graphite oxide, which is obtained by oxidation of graphite,31 is usually used as a precursor for the preparation of these composites.27,28,32,33

It has been well recognized that copper matrix composites reinforced by nano fillers, such as carbon nano tube and nano diamond, could not well manufactured by traditional preparation.34,35 Recently, Hwang et al. demonstrated that molecular level mixing (MLM) could be used to produced reduced graphene oxide (RGO) reinforced copper matrix composites (RGO/Cu composites) with a tensile strength of 284 MPa.36 MLM is a good choice for Cu matrix composite, for it produces a highly homogeneous dispersion of graphene oxide in Cu by distributing graphene oxide in copper acetate solution, followed by heating the solution to obtain a homogeneous powder of graphene oxide, CuO and Cu2O, and then reducing the powder to obtain RGO/Cu composite powder.36 However, the agglomerate of graphene sheets is still a great challenge for the production of composites, few works have been done to improve the homogeneity of graphene in composites.

High-shear mixing is a general method used in chemistry and food industries, which can produce high-shear force on the materials in liquids by high-shear mixer and has been widely used to handle energy intensive processes such as de-agglomeration, emulsification and homogenization.37 High-shear mixing is usually used to disperse nanoparticles by breaking up the nanoparticle agglomerates in liquid.38 Recently, Paton et al.39 proved that high-shear mixing could also be used to exfoliate graphite into graphene in liquids using only high shear mixer.

Based on the ref. 39 and our technique,40,41 we introduced high-shear mixing method into the process of MLM. Two MLM methods according to the mixing styles were used to produce the composites, which were typical MLM method using magnetic stirring (MLM) and MLM method using high-shear mixing (M-H). The effect of high-shear mixing on the mechanical properties of composites with different volume fractions of graphene was studied.

2 Experimental

2.1 Sample preparation

2.1.1 Graphene oxide preparation. Graphite oxide powder (Nanjing XF Nano Materials Tech Co., Ltd) was dispersed in water to obtain an aqueous graphite oxide solution with a concentration of 0.5 mg ml−1. The solution was treated by a KQ-800KDE ultrasonic cleaner (800 W, 40 kHz; Kun Shan Ultrasonic Instruments Co., Ltd.) at room temperature for 120 min; then a luminous yellow graphene oxide colloid was formed.
2.1.2 Fabrication of composites powders by MLM method. A typical MLM route of the composite powder of RGO and copper was as follows: 46 grams of copper acetate (Cu(Ac)2·H2O, analytic reagent) was dispersed in 92 ml of ammonia (analytic reagent, 28–29%) to obtain a cuprammonia. The graphene oxide colloid (46 ml) was then added to the cuprammonia and treated by sonication for 30 min. The solution was evaporated at 100 °C with magnetic stirring to produce a dried powder, which was heated at 200 °C in air for 12 h and then reduced at 200 °C for 2 h in hydrogen under atmosphere pressure. At last, the RGO/Cu composite powder was produced.
2.1.3 Fabrication of composites powders by introducing high-shear mixing. High-shear mixing was introduced into the process of MLM and the method is abbreviated as M-H. During the evaporation process of the solution of the cuprammonia and graphene oxide, a rotor-stator mixer (FA25, Gongyi City Yuhua Instrument CO., LTD) was used to offer high shear force in the solution. The line speed of the rotor vs. the stator is 5.9 m s−1 and the rotating speed is 4500 rpm in our experiments. Other conditions for M-H were same with the MLM method.
2.1.4 Consolidation of RGO/Cu composite powders. The RGO/Cu composites were sintered with the composite powders by spark plasma sintering (SPS) at 600 °C for 5 min with a vacuum of 0.1 Pa and an applied pressure of 40 MPa. The final sizes of the sintered RGO/Cu composites were 20 mm in diameter and 5 mm in thickness. The corresponding volume fractions were 0.6, 1.2, 2.4 and 4.8 vol.%, assuming the density of graphene oxide is 2.2 g cm−3.27 For simplification, the composites were abbreviated as xRGO/Cu(y), according to the volume fraction of RGO (x vol.%) in the composite and the method (y is M or M-H).

2.2 Characterization

Sample for atomic force microscopy (AFM) imaging was prepared by dispersing graphite oxide solution on a silicon wafer by dip-coating method for 5 times, which was then dried in 90 °C in air. AFM images were taken on a Ben Yuan CSPM 5600 scanning probe microscope in a tapping mode. X-ray diffraction (XRD) analyses were performed on a Philips X'Pert X-ray diffractometer with Cu K radiation. Raman spectra were preformed from 500 to 3000 cm−1 on a B&W Tek Confocal Micro-Raman spectrometer using a 532 nm laser. Scanning electron microscopy (SEM) analyses were carried out on a Quanta 200F scanning electron microscope. X-ray photoelectron spectroscopy (XPS) measurements were conducted with a K-alpha (Thermo Fisher) system. Non-monochromatic Al Kα radiation was operated under vacuum 1.0 × 10⁻⁸ mbar; the constant-pass energy mode is 50 eV with a step size of 0.1 eV for the C1s photoelectron line.

Transmission electron microscopy (TEM) analyses were taken with a JEM-2100 type transmission electron microscope equipped with an energy-dispersive X-ray spectrometer (EDS). The composite samples for TEM were shaped with a thickness of 30 micrometers and a diameter of 3 mm; and then a thin zone was prepared in the middle of each sample by ion milling using a Gatan 691 Precision Ion Polishing System. Compressive tests were performed using an Instron 5500R All-purpose Electronic Tester with a crosshead speed of 0.5 mm min−1. The samples for compressive tests had a cylindrical disc shape, with 3 mm in height and 3 mm in diameter. The loading directions are parallel to the pressing direction of the specimens.

3 Result and discussion

AFM is one of the most direct methods of measuring the thickness of graphene sheets or graphene oxide sheets. An AFM image of typical graphene oxide sheets produced by the graphite oxide after sonication is shown in Fig. 1a. A graphene oxide sheet can be found in Fig. 1a with a thickness of ∼0.9 nm according to the height profile inserted, indicating a 1-layer graphene oxide sheet, since the interlayer spacing of one-layer graphite oxide varies with the amount of absorbed water, with values such as 0.63 nm and 0.61 nm reported for ‘‘dry’’ GO samples (complete drying of GO is probably impossible42) to 1.2 nm for hydrated GO.43 Both the size and thickness of graphene oxide may influence the properties of the composites, since it is well known that “size effect” is an interesting topic in the composite research and thickness is a key parameter for graphene based composites. 20 pieces of graphene oxide sheets were selected randomly and analyzed by AFM measurements, the distributions of the size and thickness were shown as histograms in Fig. 1b and c; the average size of RGO sheets is ∼1.16 μm and the average thickness is ∼1.90 nm, indicating that most of the RGO sheets are 1 or 2 layers. The result shows that the luminous yellow solution produced by sonication is well-exfoliated graphene oxide solution and that the sonication treatment is sufficient to transfer graphite oxide into graphene oxide.
image file: c5ra04782j-f1.tif
Fig. 1 Characterization of the reinforcement. (a) A tapping mode AFM image of exfoliated graphene oxide sheets on silicon with a corresponding height profile; (b) size distribution of graphene sheets; (c) thickness distribution of graphene sheets; (d) Raman spectrum of graphite oxide.

Raman spectroscopy was applied to characterize the structure of graphite oxide, as shown in Fig. 1d. The Raman spectrum of graphite oxide shows a D peak at 1354 cm−1 and a broad G peak at 1580 cm−1, similar to previous reports.29,36,44,45 The prominent D peak is from the structural imperfections created by the attachment of epoxy, hydroxyl and epoxy groups on the carbon basal plane;38 the G peak is corresponding to the first-order scattering of the E2g mode.46

Fig. 2a shows the XRD patterns of the RGO/Cu composite powders fabricated by the MLM method, M-H method and the composite powders after reducing in H2. The peaks at 43.3, 50.4 and 74.1 degrees are assigned to (111), (200) and (220) crystalline planes of Cu (PDF No. 851[thin space (1/6-em)]326), respectively. The peaks at 36.5, 42.3, 61.4 degrees are assigned to (111), (200), (220) crystalline planes of Cu2O, respectively. And the peaks at 38.7, 35.5, 48.7 degrees are assigned to (111), [( with combining macron]111) and [( with combining macron]202) crystalline planes of CuO, respectively. The peaks corresponding to CuO and Cu2O in the composite powders disappear after H2 reducing. The results indicate that the hydrogen treatment can effectively reduce the oxides in the composite powders. As the main peak of (001) graphite oxide diffraction is around 11.2 degree,47 no obvious diffraction peak near 11.2 degree is observed for the composite powders, suggesting no graphite oxide was produced during MLM process.


image file: c5ra04782j-f2.tif
Fig. 2 XRD patterns of the composite powders (a) and composites (b).

In order to investigate the effect of M-H method on the particle size of the oxide particles in the composite powder, Cu2O was selected as a representative. The Full Width Half Maximum (FWHM) of Cu2O peak at 61.5 degree was measured. The FWHMs of Cu2O at 61.5 degree for 0.6RGO/Cu(M) and 0.6RGO/Cu(M-H) are 0.581 and 0.667 degree, respectively. The FWHM result indicates that the grain size of Cu2O in the composite powder produced by M-H method is smaller than that produced by MLM according to Scherrer formula. It's reasonable to expect that the distribution of graphene oxide in the composite powder produced by M-H method would be more homogeneous than that by MLM method because graphene oxide sheets should be well separated by smaller oxide particles.

The XRD patterns of RGO/Cu composite fabricated by the MLM and M-H are shown in Fig. 4b. All the composites show similar diffraction patterns, mainly corresponding to Cu, indicating that little oxidation of copper occurred during the process of SPS.

XPS was employed to analyze the state of carbon in graphite oxide powder, 1.2RGO/Cu(M)-H2 composite powder and the composite. Curve fitting of the C1s spectra was performed using a Gaussian–Lorentzian peak shape after performing a Shirley background correction. In Fig. 3a, the C1s XPS spectrum of graphite oxide clearly indicates a considerable degree of oxidation as a result of the high relative intensities of epoxy carbon (C–O, 286.7 eV)38 and carboxylate carbon (O–C[double bond, length as m-dash]O, 288.4 eV)36 with respect to sp2-hybridized carbon (284.4 eV). Fig. 3b shows the peaks of oxygen groups at 286.2 (C–O) and 288.3 eV (O–C[double bond, length as m-dash]O) for 1.2RGO/Cu(M)-H2 composite powder. The relative intensity of C–O peak to that of sp2-hybridized carbon in RGO was obviously reduced, indicating the reduction of C–O group by hydrogen treatment, while the relative intensity of O–C[double bond, length as m-dash]O peak shows little change compared with graphite oxide indicating that the hydrogen treatment has little effect on O–C[double bond, length as m-dash]O group. Fig. 3c shows C1s XPS spectrum of 1.2RGO/Cu composite. It can be clearly seen that the relative intensities of peaks corresponding to sp2-hybridized carbon and oxygen-containing functional groups of composite show little change compared to those of the composite powder, suggesting that the SPS process had little influence on both sp2-hybridized carbon and the residual oxygen-containing functional groups. In addition, it was doubted that carbon material was damaged or reacted with the matrix material during the SPS process,48 however, the result indicates that the RGO sheets could be preserved after the SPS process.


image file: c5ra04782j-f3.tif
Fig. 3 C1s XPS spectra of (a) graphite oxide powder; (b) 1.2RGO/Cu(M)-H2 composite powder and (c) 1.2RGO/Cu(M) composite.

These results can be explained by the unique properties of the thermal reduction of graphene oxide. When the exfoliated graphene oxide in composite powders were heated below 550 °C, the epoxy group, which was mainly attached to the interior of an aromatic domain in graphene oxide sheets, decomposed relatively fast, and its content declined rapidly. However, the carboxylate group attached to the edges of an aromatic domain was more thermally stable, which would not decline sharply until the temperature is over 1000 °C in inert gas.38

SEM image of the RGO/Cu composite powder is shown in Fig. 4a. It can be found that the carbon sheets were decorated randomly with copper particles. This is mainly attributed to the reaction between Cu ions and the functional groups on graphene oxide surface during the process of molecular-level mixing.36


image file: c5ra04782j-f4.tif
Fig. 4 Representative SEM morphologies: (a) 0.6RGO/Cu(M) composite powder; (b) 2.4 RGO/Cu(M-H) etched for 30 min; (c) 1.2 RGO/Cu(M) etched for 60 min; (d) 1.2 RGO/Cu(M-H) etched for 60 min.

Many thin curved RGO sheets are connected and clearly seen in the 2.5RGO/Cu composite after etching in FeCl3 for 30 minutes as shown in Fig 4b, which suggests that the RGO sheets keep their sheet structure after SPS sintering.

The SEM images of the 1.2 RGO/Cu(M) and 1.2 RGO/Cu(M-H) after 60 min etching are shown in Fig. 4c and d. It can be found that RGO sheets in the composites were connected to porous structure. The size of holes (about several μm) in the image of 1.2RGO/Cu(M) is much bigger than that (less than 1 μm) of 1.2RGO/Cu(M-H), suggesting that more agglomeration of RGO exists in the composite prepared by the MLM method and that M-H method has positive effect on the improvement of RGO distribution.

Fig. 5a shows the TEM bright image of 0.6RGO/Cu(M) composite, and Fig. 5b–d is the dark field images corresponding to Fig. 5a. According to Fig. 5b–d, we can found that some of the Cu grains in the composite are not regular balls but near rectangle, and the length and width of the rectangle are near 200 and 500 nm, respectively. The small size of Cu grain could benefit the mechanical properties of the composites by fine-grain strengthening.


image file: c5ra04782j-f5.tif
Fig. 5 TEM images of 0.6RGO/Cu composite: (a) bright field image; (b)–(d) dark field images corresponding to (a).

The fractography micrograph of 1.2RGO/Cu(M) and 1.2RGO/Cu(M-H) are shown in Fig. 6. It can be found that the fractography micrograph of 1.2RGO/Cu(M) is not homogeneous, thicker RGO sheets, crack and holes can be found. However, the structure of the fractography of 1.2RGO/Cu(M-H) is relatively homogeneous and not rough; no thicker RGO sheets can be found and the sizes of the dimples are similar and small. The result suggests that the high-shear mixing is useful to produce more homogeneous composites.


image file: c5ra04782j-f6.tif
Fig. 6 Fractography micrographs of the composites: (a) 1.2RGO/Cu(M) and (b) 1.2RGO/Cu(M-H).

The mechanical properties of the composites were characterized using compressive tests. The “technical compressive strain” used here contains the strain of both sample and tester system. As a result the stress–strain measurements can offer the actuate stress values; however, they have the limitation that Young's modulus cannot be calculated with the strain. As shown in Fig. 7a, the yield strengths of 0.6RGO/Cu(M), 1.2RGO/Cu(M), 2.4RGO/Cu(M) and 4.8RGO/Cu(M) are 410, 434, 410 and 197 MPa, respectively. It can be found that the yield strength of the composite by MLM method increases at first and reaches the maximum for 1.2RGO/Cu(M), and then decreases with the increase of the volume fraction of RGO. The maximum yield strength corresponding to 1.2RGO/Cu(M) is about three times higher than that of Cu (about 150 MPa34). However, the strength of the 4.8RGO/Cu(M) is much lower than those of the composites with lower volume fraction of RGO. These results indicate that the MLM method is superior in fabricating composites with the volume fraction of graphene less than 1.2 vol.%. However, when the volume fraction of graphene is higher than 2.4 vol.%, the yield strength is much lower than the expectation. The main reason is that the RGO sheets tend to aggregate in solution during MLM process when the volume fraction of RGO is high.


image file: c5ra04782j-f7.tif
Fig. 7 Typical compressive stress–strain curves of (a) RGO/Cu(M) composites and (b) RGO/Cu(M-H); (c) comparison of compressive yield strength of the RGO/Cu composites; (d) apparent strengthening efficiencies of RGO and other reinforcements in copper matrix composites.

As shown in Fig. 7b, the yield strengths of 0.6RGO/Cu(M-H), 1.2RGO/Cu(M-H), 2.4RGO/Cu(M-H) and 4.8RGO/Cu(M-H) are 440, 469, 501 and 395 MPa, respectively. All the yield strengths of the RGO/Cu(M-H) composites are higher than those of the RGO/Cu(M) composites with the same volume fraction of RGO as shown in Fig. 7c. The yield strength of the composite by M-H method increases linearly with the increase of the volume fraction of RGO from 0.6 vol.% to 2.4 vol.%. The maximum yield strength of 2.4RGO/Cu(M-H) is 501.3 MPa, which is 91 MPa higher than that of 2.4RGO/Cu(M); the yield strength of 4.8RGO/Cu(M-H) is 395 MPa, about 2 times of that (197 MPa) of 4.8RGO/Cu(M).

It has been reported that the reaction between carboxyl or hydroxyl groups (O[double bond, length as m-dash]C–OH), (C[double bond, length as m-dash]O, –OH) and copper atoms can produce Cu–oxygen bonds, these bonds at the interface in CNT/Cu nanocomposites are the origin of the optimized CNT/Cu interface49 and graphene/Cu,36 which helps to transfer the load from the Cu matrix to the CNTs or graphene and reinforce the nanocomposites. So, the residual functional groups on the surface of RGO would contribute to the binding force between RGO and copper and benefit the strength of the composite.50 It also should be mentioned that both the size distribution and the defect concentration of graphene oxide may have important effects on the mechanical properties of the RGO/Cu composites. It is an interesting topic which needs more detailed work in the future.

Strengthening efficiency R has been used to compare the reinforcing effect of different reinforcements, which is defined as the ratio of the amount of yield strength increase of the composite to that of the matrix by the addition of reinforcement materials.34 However, the actual strength of the matrix is difficult to measure as it is very difficult to prepare a material with the same microstructures and properties as the matrix because of the complex interaction between reinforcement and matrix during the preparation process of the composites. To avoid this dilemma, the definition of “apparent strengthening efficiency” (Ra) is introduced to compare the reinforcing effects of RGO and other reinforcements.

Apparent strengthening efficiency is expressed as

 
image file: c5ra04782j-t1.tif(1)
where σc is the yield strength of composite, σ*m is used as a yield strength reference of the pure matrix material; considering the difficulty to obtain an accurate value of the reference, the reference in this definition is just a common agreement and arbitrary to some extent; as a result, in order to benefit the comparison between similar composites, we choose the reference from the first article of MLM method, which is 150 MPa.34 Vf is the volume fraction of the reinforcement. Ra can reflect the whole improvement of the strength of the composite by the introduction of the reinforcement, which mainly includes the load transformation of reinforcement and the fine-grain strengthening.

The apparent strengthening efficiencies of RGO and CNT are shown in Fig. 7d. High apparent strengthening efficiency has been reached for 0.6RGO/Cu(M-H), which is the highest in all of the composites reinforced by CNT and RGO, indicating the RGO sheets have remarkable strengthening effect for the copper matrix composite with low volume fraction of RGO. It can be found that the apparent strengthening efficiencies of RGO in the copper matrix composites are increasing with the decrease of the volume fractions of RGO. The explanation is that the RGO sheets in the composite with lower fraction of RGO is easier to be distributed homogeneously than them in the composite with higher fraction of RGO; so they could transmit the load from the matrix efficiently and separate the grains of the copper matrix effectively, which can strengthen the composite by load transformation and fine-grain strengthening. As a result, RGO worked well as reinforcements and showed high apparent strengthening efficiency in 0.6RGO/Cu(M-H). However, the possibility of RGO agglomeration increases quickly with the increase of the RGO volume fraction in the composite, the agglomeration could act as a source of crack in the composite and greatly decrease the strength of the composite.

It can also be found that all of the apparent strengthening efficiencies corresponding to the composites produced by M-H method are higher than those produced by MLM method. Especially for the 4.8RGO/Cu composites, the strengthening efficiencies of 4.8RGO/Cu(M) and 4.8RGO/Cu(M-H) are 7 and 34, respectively, the latter is about 5 times higher than the former. It is obvious that the introduction of high-shear mixing in the process of MLM has great influence on the strengthening effect of RGO. In addition, the Ra of 4.8RGO/Cu(M-H) is 1.2 times higher than that of 5CNT/Cu(M), however, the Ra of 4.8RGO/Cu(M) is much lower than that of 5CNT/Cu(M). The results suggest that serious coagulation of RGO happened in the 4.8RGO/Cu(M) composite, while the coagulation of RGO is prevented in a high degree with the help of high-shear mixing. It also suggests that the RGO sheets are hard to be distributed homogeneously in the copper matrix composite compared with CNT using MLM method. Consequently, high-shear mixing is an ideal candidate to improve the homogeneity of RGO in the composite.

Why does the M-H method have significant effect on the improvement of the yield strength of the composite and the strengthening efficiency of RGO? Before discussing the reason, we would mention some of the technical details on the evaporation process of the solution of graphene oxide and the cuprammonia. The evaporation process can be divided into three stages: solution stage, slurry stage and mud stage. For the solution stage, the graphene oxide sheets homogeneously distributed in cuprammonia as demonstrated in Fig. 8a; when the solution was heated, with the evaporation of ammonia water, copper hydroxide and copper oxide particles were produced, then the solution turned to be a slurry, and the particles in the slurry could move with liquid as shown in Fig. 8b; with the decrease of the slurry volume, the slurry became a mud as shown in Fig. 8c, the particles in it lost their mobility and finally became composite powder.


image file: c5ra04782j-f8.tif
Fig. 8 The schematic diagram of M-H method: (a) solution stage; (b) slurry stage; (c) mud stage and (d) mixer head.

High-shear mixing was introduced during the slurry stage using a rotor-stator mixer as shown in Fig.8b and d. When the rotor-stator mixer worked, the line speed of the rotor vs. the stator was 5.9 m s−1. The graphene sheets and copper hydroxide and copper oxide particles in the slurry were forced to go through the narrow gap between the rotor and stator as demonstrated in Fig. 8d; high shear force was produced between the gap and acted on the graphene sheets and the particles, which could homogeneously distribute the graphite oxide sheets in the slurry and prevent them from aggregating. Furthermore, the homogeneous graphene oxide sheets in the slurry could also restrain the abnormal grain growth of copper hydroxide and copper oxide particles by covering them and separating them, which resulted in the lower average diameter of the particles for the composite powder processed with M-H method as shown in the result of FWHM above-mentioned. Consequently, the M-H method has significant effect on the improvements of the yield strength of the copper matrix composites and the strengthening efficiency of RGO; it shows large potential in distributing graphene into other materials in the fields of composites.

4 Conclusions

RGO/Cu composites with homogenously dispersed RGO sheets within the Cu matrix were successfully fabricated by MLM method and by M-H method. The yield strengths and the apparent strengthening efficiencies of the composites produced by M-H are higher than those produced by MLM. The yield strength of 2.4 vol.% RGO/Cu composite(M-H) was three times higher than that of Cu. RGO shows extremely high strengthening effect, even higher than CNTs; the apparent strengthening efficiency of the 0.6 vol.% RGO/Cu composite is 321.7 and is the highest among the copper matrix composites reinforced by RGO and CNT. The M-H method is hopeful to be applied to produce many kinds of graphene based composites and promising perspectives are opened up by integrating high-shear mixing in the process of composite production.

Acknowledgements

The authors gratefully acknowledge the support from China Scholarship Council (No. 201206125006) and Harbin Key Technologies R&D Program (2012DB2CP029).

References

  1. K. S. Novoselov, A. K. Geim, S. V. Morozov, D. Jiang, Y. Zhang, S. V. Dubonos, I. V. Grigorieva and A. A. Firsov, Science, 2004, 306, 666–669 CrossRef CAS PubMed.
  2. C. Lee, X. D. Wei, J. W. Kysar and J. Hone, Science, 2008, 321, 385–388 CrossRef CAS PubMed.
  3. J. H. Chen, C. Jang, S. D. Xiao, M. Ishigami and M. S. Fuhrer, Nat. Nanotechnol., 2008, 3, 206–209 CrossRef CAS PubMed.
  4. A. A. Balandin, S. Ghosh, W. Z. Bao, I. Calizo, D. Teweldebrhan, F. Miao and C. N. Lau, Nano Lett., 2008, 8, 902–907 CrossRef CAS PubMed.
  5. U. Maitra, H. Matte, P. Kumar and C. N. R. Rao, Chimia, 2012, 66, 941–948 CrossRef CAS PubMed.
  6. X. S. Li, W. W. Cai, L. Colombo and R. S. Ruoff, Nano Lett., 2009, 9, 4268–4272 CrossRef CAS PubMed.
  7. T. Ohta, A. Bostwick, T. Seyller, K. Horn and E. Rotenberg, Science, 2006, 313, 951–954 CrossRef CAS PubMed.
  8. C. Virojanadara, M. Syvajarvi, R. Yakimova, L. I. Johansson, A. A. Zakharov and T. Balasubramanian, Phys. Rev. B, 2008, 78, 245403 CrossRef.
  9. Y. Hernandez, V. Nicolosi, M. Lotya, F. M. Blighe, Z. Y. Sun, S. De, I. T. McGovern, B. Holland, M. Byrne, Y. K. Gun'ko, J. J. Boland, P. Niraj, G. Duesberg, S. Krishnamurthy, R. Goodhue, J. Hutchison, V. Scardaci, A. C. Ferrari and J. N. Coleman, Nat. Nanotechnol., 2008, 3, 563–568 CrossRef CAS PubMed.
  10. W. S. Hummers Jr and R. E. Offeman, J. Am. Chem. Soc., 1958, 80, 1339 CrossRef.
  11. D. Li, M. B. Muller, S. Gilje, R. B. Kaner and G. G. Wallace, Nat. Nanotechnol., 2008, 3, 101–105 CrossRef CAS PubMed.
  12. L. D. Wang, and W. D. Fei, Cn. Pat., 201210344115.3, 2012.
  13. J. Zhao, Y. Guo, Z. Li, Q. Guo, J. Shi, L. Wang and J. Fan, Carbon, 2012, 50, 4939–4944 CrossRef CAS PubMed.
  14. P. Kumar, L. S. Panchakarla and C. N. R. Rao, Nanoscale, 2011, 3, 2127–2129 RSC.
  15. D. V. Kosynkin, A. L. Higginbotham, A. Sinitskii, J. R. Lomeda, A. Dimiev, B. K. Price and J. M. Tour, Nature, 2009, 458, 872–875 CrossRef CAS PubMed.
  16. P. Kumar, RSC Adv., 2013, 3, 11987–12002 RSC.
  17. U. Maitra, H. S. S. R. Matte, P. Kumar and C. N. R. Rao, Chimia, 2012, 66, 941–948 CrossRef CAS PubMed.
  18. P. Kumar, K. S. Subrahmanyam and C. N. R. Rao, Mater. Express, 2011, 1, 252–256 CrossRef CAS PubMed.
  19. P. Kumar, B. Das, B. Chitara, K. S. Subrahmanyam, K. Gopalakrishnan, S. B. Krupanidhi and C. N. R. Rao, Macromol. Chem. Phys., 2012, 213, 1146–1163 CrossRef CAS PubMed.
  20. C. N. R. Rao, K. S. Subrahmanyam, H. S. S. R. Matte, B. Abdulhakeem, A. Govindaraj, B. Das, P. Kumar, A. Ghosh and D. J. Late, Sci. Technol. Adv. Mater., 2010, 11, 054502 CrossRef.
  21. M. Y. Yen, C. C. Teng, M. C. Hsiao, P. I. Liu, W. P. Chuang, C. C. M. Ma, C. K. Hsieh, M. C. Tsai and C. H. Tsai, J. Mater. Chem., 2011, 21, 12880–12888 RSC.
  22. X. Zhao, C. M. Hayner, M. C. Kung and H. H. Kung, Adv. Energy Mater., 2011, 1, 1079–1084 CrossRef CAS PubMed.
  23. Y. M. He, W. J. Chen, X. D. Li, Z. X. Zhang, J. C. Fu, C. H. Zhao and E. Q. Xie, ACS Nano, 2013, 7, 174–182 CrossRef CAS PubMed.
  24. A. K. Geim and K. S. Novoselov, Nat. Mater., 2007, 6, 183–191 CrossRef CAS PubMed.
  25. W. H. Kai, Y. Hirota, L. Hua and Y. Inoue, J. Appl. Polym. Sci., 2008, 107, 1395–1400 CrossRef CAS PubMed.
  26. A. Seema and P. G. Emmanuel, J. Polym. Sci., Part B: Polym. Phys., 2009, 47, 888–897 CrossRef PubMed.
  27. D. A. Nguyen, Y. R. Lee, A. V. Raghu, H. M. Jeong, C. M. Shin and B. K. Kim, Polym. Int., 2009, 58, 412–417 CrossRef CAS PubMed.
  28. H. J. Salavagione, G. Martinez and M. A. Gomez, J. Mater. Chem., 2009, 19, 5027–5032 RSC.
  29. J. H. Wu, Q. W. Tang, H. Sun, J. M. Lin, H. Y. Ao, M. L. Huang and Y. F. Huang, Langmuir, 2008, 24, 4800–4805 CrossRef CAS PubMed.
  30. T. Ramanathan, A. A. Abdala, S. Stankovich, D. A. Dikin, M. Herrera-Alonso, R. D. Piner, D. H. Adamson, H. C. Schniepp, X. Chen, R. S. Ruoff, S. T. Nguyen, I. A. Aksay, R. K. Prud'homme and L. C. Brinson, Nat. Nanotechnol., 2008, 3, 327–331 CrossRef CAS PubMed.
  31. S. H. William and E. O. Richard, J. Am. Chem. Soc., 1958, 80, 1339 CrossRef.
  32. C. Xu, X. Wang and J. W. Zhu, J. Phys. Chem. C, 2008, 112, 19841–19845 CAS.
  33. D. Y. Cai, M. Song and C. X. Xu, Adv. Mater., 2008, 20, 1706–1709 CrossRef CAS PubMed.
  34. S. I. Cha, K. T. Kim, S. N. Arshad, C. B. Mo and S. H. Hong, Adv. Mater., 2005, 17, 1377–1381 CrossRef CAS PubMed.
  35. J. He, N. Q. Zhao, C. S. Shi, X. W. Du, J. J. Li and P. Nash, Mat. Sci. Eng. A-Struct., 2008, 490, 293–299 CrossRef PubMed.
  36. J. Hwang, T. Yoon, S. H. Jin, J. Lee, T. S. Kim, S. H. Hong and S. Jeon, Adv. Mater., 2013, 25, 6724–6729 CrossRef CAS PubMed.
  37. V. A. Atiemo-Obeng, and R. V. Calabrese, in Handbook of industrial mixing, John Wiley & Sons, Inc., 2004 Search PubMed.
  38. J. Cao, G. Q. Qi, K. Ke, Y. Luo, W. Yang, B. H. Xie and M. B. Yang, J. Mater. Sci., 2012, 47, 5097–5105 CrossRef CAS PubMed.
  39. K. R. Paton, E. Varrla, C. Backes, R. J. Smith, U. Khan, A. O'Neill, C. Boland, M. Lotya, O. M. Istrate, P. King, T. Higgins, S. Barwich, P. May, P. Puczkarski, I. Ahmed, M. Moebius, H. Pettersson, E. Long, J. Coelho, S. E. O'Brien, E. K. McGuire, B. M. Sanchez, G. S. Duesberg, N. McEvoy, T. J. Pennycook, C. Downing, A. Crossley, V. Nicolosi and J. N. Coleman, Nat. Mater., 2014, 13, 624–630 CrossRef CAS PubMed.
  40. L. D. Wang, W. D. Fei, and Y. Cui, CN Pat., CN 101857221 A, 2010.
  41. L. D. Wang, Y. Cui, S. Yang, B. Li, Y. Y. Liu, P. Dong, J. Bellah, G. H. Fan, R. Vajtai and W. D. Fei, RSC Adv., 2015, 5, 19321–19328 RSC.
  42. T. Szabo, O. Berkesi and I. Dekany, Carbon, 2005, 43, 3186–3189 CrossRef CAS PubMed.
  43. J. H. de Boer and A. B. C. van Doorn, Proc. Koninkl. Ned. Akad. Wetenschap., 1958, 61, 242–252 Search PubMed.
  44. L. H. Tang, Y. Wang, Y. M. Li, H. B. Feng, J. Lu and J. H. Li, Adv. Funct. Mater., 2009, 19, 2872–2889 Search PubMed.
  45. S. Watcharotone, D. A. Dikin, S. Stankovich, R. Piner, I. Jung, G. H. B. Dommett, G. Evmenenko, S. E. Wu, S. F. Chen, C. P. Liu, S. T. Nguyen and R. S. Ruoff, Nano Lett., 2007, 7, 1888–1892 CrossRef CAS PubMed.
  46. M. Ramm, M. Ata, T. Gross and W. Unger, Appl. Phys. A: Mater. Sci. Process., 2000, 70, 387–390 CrossRef CAS.
  47. C. Xu and X. Wang, Small, 2009, 5, 2212–2217 CrossRef CAS PubMed.
  48. S. R. Bakshi, D. Lahiri and A. Agarwal, Int. Mater. Rev., 2010, 55, 41–55 CrossRef CAS PubMed.
  49. K. T. Kim, S. I. Cha, T. Gemming, J. Eckert and S. H. Hong, Small, 2008, 4, 1936–1940 CrossRef CAS PubMed.
  50. L. D. Wang, Y. Cui, R. Y. Li, G. J. Cao, B. Li and W. D. Fei, Acta Metall. Sin. (Engl. Lett.), 2014, 27, 924–929 CrossRef CAS.

This journal is © The Royal Society of Chemistry 2015
Click here to see how this site uses Cookies. View our privacy policy here.