DOI:
10.1039/C5RA04725K
(Paper)
RSC Adv., 2015,
5, 37130-37137
Layer-by-layer assembled protein nanotubes with high DNA affinity
Received
17th March 2015
, Accepted 16th April 2015
First published on 16th April 2015
Abstract
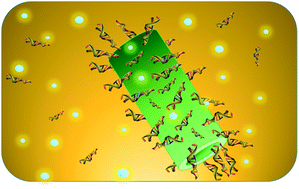
In this research, protein nanotubes with high affinity for DNA molecules were prepared by alternate layer-by-layer (LbL) assembly of human serum albumin (HSA) and polyethylenimine (PEI). The well-defined hollow cylinder (PEI/HSA)5PEI nanotubes with outer diameter 455 ± 13 nm, inner diameter 275 ± 35 nm, wall thickness 151 ± 7 nm and length 5.6 ± 0.9 μm were characterized by scanning electron microscopy (SEM), transmission electron microscopy (TEM), Fourier transform infrared spectroscopy (FT-IR) and energy dispersive spectroscopy (EDS). Under optimal conditions, the maximum adsorption capacity of protein nanotubes for polyA25 was 606.0 mg g−1, which was far higher than the reported nanoparticles. The rates of adsorption were found to conform to the pseudo-second-order kinetics and intra-particle diffusion models with good correlation. The equilibrium adsorption data fitted well with the Langmuir isotherm model. The DNA release from DNA/(PEI/HSA)5PEI nanotubes was associated with the ionic strength and pH in the solution.
1. Introduction
The adsorption or immobilization of nucleic acid on solid surfaces is essential in a wide range of research including DNA chip technology, DNA hybridization and gene delivery.1–6 The inherent merits of nanotubes, for example, unique hollow structure, distinct inner and outer surfaces as well as two open-end terminals, make it to a promising nanomaterial for bimolecular immobilization and delivery.7 Inorganic nanotubes such as carbon nanotubes,8 silica nanotubes9 and magnetic nanotubes10 have been developed for gene vectors. But their biomedical applications are limited due to the lack of biocompatibility and biodegradability. It could be a good strategy to synthesize biological nanotubes. Some biological nanotubes such as lipid nanotubes11 have been reported for this propose. However, protein nanotubes with DNA affinity are largely unexplored, thus is addressed in this paper.
Currently, a popular approach to prepare protein nanotubes is the combination of layer-by-layer (LbL) assembly technique with template method. Exploiting the electrostatic attraction, oppositely charged polyelectrolytes and biomacromolecules can build up multilayer into the pores of nanoporous membrane, such as anodic aluminium oxide (AAO) or track-etch polycarbonate (PC). The hollow protein nanotubes are obtained by subsequently removing the template.12–14 This technique provides a simple and versatile means that can tune the thin films precisely on nanometer scales, and the synthesized tubular structures own tailored shapes and sizes.
Protein nanotubes were functionalized by assembling different molecules on the internal wall to realize target molecules capturing. For example, nanotubes assembled by human serum albumin (HSA) and poly-L-arginine (PLA) could bind the zinc(II) protoporphyrin IX to the HSA component in the cylindrical wall.15 The hybrid HSA/PLA nanotubes bearing single avidin layer as an internal wall captured biotin-labelled nanoparticles into the central channel.15 The nanotubes with an antibody surface interior entrapped human hepatitis B virus with size selectivity.16
One of the methods of DNA immobilization has been reported based on ionic interaction occurring between the negatively charged groups present on the DNA and positive charges covering the surface.17 Polyethylenimine (PEI) is a kind of cationic polyelectrolyte and the branched structure of PEI contains nitrogen at every third atom, resulting in a high charge density. PEI is often considered as the most prominent polymer capable of gene transfection18 and DNA immobilization.19 Therefore, we can expect that protein/PEI hybridized nanotubes with PEI on the inner and outer surfaces will provide the high efficient DNA loading.
In this article, protein nanotubes ((PEI/HSA)5PEI) were prepared and the adsorption and release performances for oligonucleotides were investigated. Kinetic and isotherm models were applied to the experimental data for a better understanding of the binding process.
2. Experimental
2.1. Chemicals and materials
Polyethylenimine (PEI, Mw = 750
000, 50% (w/v) in water), human serum albumin (HSA, 96%–99%) and calf thymus DNA (ctDNA) were purchased from Sigma-Aldrich. The track-etch nanoporous PC membrane (no. 28420636, circle membrane diameter 25 mm, pore diameter 400 nm) was purchased from Whatman Co. Poly-adenosine (polyA25) was provided by DNA-SYN Biotechnology Synthesis Lab (Beijing, China). The water was deionised (18.2 MΩ cm−1) using purification Milli-Q system (Millipore, USA). All chemicals were used as received without further purification. Experiments were all carried out at 25 ± 2 °C.
2.2. Preparation of protein nanotubes
(PEI/HSA)5PEI nanotubes were fabricated in PC nanopores by the revised LbL assembly according to previous method.15 Briefly, PC membrane was placed into a filter. 10 mL 1 mg mL−1 PEI was firstly flowed through at the speed of 0.25 mL min−1 using a syringe pump. Then the loosely adsorbed PEI was washed by 10 mL pH 7.4 PB at the rate of 1 mL min−1. Following this, the membrane was dried under a stream of N2. In next step, 2 mg mL−1 HSA dissolved in pH 7.4 PB solution was injected (10 mL, 0.5 mL min−1) through the membrane with assembled PEI layer. After injection of pH 7.4 PB solution (10 mL, 1 mL min−1) to remove the loosely bound HSA, the membrane was again N2 dried. Between each deposition steps, a cotton swab with water was used to eliminate the adsorption of PEI and HSA on the top and bottom of PC surfaces. After repeating 5.5-cycle injection, the membrane was dried in vacuum for 12 h (0.09 Mpa) and immersed in DMF subsequently. The PC was quickly dissolved and the (PEI/HSA)5PEI nanotubes were precipitated. The liberated nanotubes were washed 3–5 times with DMF and the supernatants were discarded. Finally, the lyophilized (PEI/HSA)5PEI nanotubes powder was yielded by freeze-dried the dispersion under vacuum (−60 °C, <20 Pa).
2.3. Characterization of protein nanotubes
For TEM observation, the dispersion of (PEI/HSA)5PEI stained with 3% phosphotungstic acid was observed on a H600 electron microscope (Hitachi, Japan) at 75 kV. The SEM and EDS images were obtained using a JSM-6390 electron microscope (JEOL, Japan) by analyzing the lyophilized sample that sputter-coated with gold using an ion sputter (E1010, Hitachi). FT-IR spectra were recorded by using a TENSOR 27 FT-IR spectrophotometer (Bruker, German). UV-vis spectroscopy measurements were conducted using infinite M200 PRO (TECAN, Switzerland) to evaluate the adsorption and desorption experiments.
2.4. Adsorption experiments
The adsorption property of (PEI/HSA)5PEI for DNA was studied. PolyA25 was selected as typical DNA. A stock solution of 1 mg mL−1 was prepared and diluted to the required concentrations at pH 7.4. In each experiment, 200 μL polyA25 solution was added into a 1.5 mL centrifuge tube with 0.1 mg (PEI/HSA)5PEI nanotubes. The mixtures were stirred continuously using an orbital shaker. At regular intervals, polyA25 concentration in supernatant was determined by infinite M200 PRO at 260 nm after centrifugation with 6000 rpm. The amount of polyA25 adsorbed onto (PEI/HSA)5PEI nanotubes denoted as qe (mg g−1) was calculated using the following: |
 | (1) |
where C0 and Ct is the initial and equilibrium concentration of polyA25 (mg L−1), respectively, V (L) is the volume of polyA25 solution and m (g) is the mass of (PEI/HSA)5PEI nanotubes.
Effect of pH ranging from 4.7 to 11 was performed using 108 mg L−1 polyA25. Adsorption isotherm was studied using polyA25 solutions with concentrations ranging from 22 mg L−1 to 500 mg L−1.
2.5. Release experiments
The DNA/(PEI/HSA)5PEI nanotubes complexes were prepared by mixing 0.1 mg (PEI/HSA)5PEI nanotubes with 200 μL 108 mg L−1 polyA25 at pH 7.4 for 1 h. The complexes were collected with centrifugation of 6000 rpm and then dispersed in 200 μL of PB buffer solution at pH 7.4 and pH 5.7 in the presence of NaCl (0–1.5 M), respectively. At regular intervals, the desorbed polyA25 in solution was determined by measuring the supernatant at 260 nm. The ratio of DNA release from complexes was calculated as: |
 | (2) |
where Ct (mg L−1) is the polyA25 concentration in solution at t time, qe (mg g−1) is the pre-adsorbed amount of polyA25 onto (PEI/HSA)5PEI nanotubes, V (L) is the volume of the solution, m (g) is the mass of (PEI/HSA)5PEI nanotubes.
The adsorption and release measurements were conducted in triplicate and reported as the mean values ± standard deviation (SD).
3. Results and discussion
3.1. Characterization of (PEI/HSA)5PEI nanotubes and DNA/(PEI/HSA)5PEI nanotubes complexes
SEM images of (PEI/HSA)5PEI nanotubes (Fig. 1A) displayed the well-defined hollow cylinders with outer diameter of 455 ± 13 nm, inner diameter of 275 ± 35 nm and wall thickness of 151 ± 7 nm. The outer diameter was dependent on the PC template used, thus the nanotube size was controlled by the pore size. The (PEI/HSA)5PEI nanotubes could be considered as the eleven-layered cylinder model, in which each HSA layer had a single-protein thickness. The HSA dimension was assumed to be 8 nm from the single crystal structure20,21 and thus the thickness of PEI layer was calculated as 18.5 nm. This value was between the reported values for polyelectrolyte layers fabricated into porous template.15 From the TEM image in Fig. 1B, a good tube structure was observed. The length was estimated to be 5.6 ± 0.9 μm, close to the PC template thickness (6 μm). Fig. 1C showed the FT-IR spectra of the fabricated nanotubes and HSA. In spectrum of HSA, peaks at 1650 cm−1 and 1535 cm−1 were the characteristic adsorptions of the C
O stretching vibration and the in-phase bending of N–H bond coupled with stretching of C–N bond in amide, respectively. The presence of peaks at 3320 cm−1 and 2942–2820 cm−1 was contributed to N–H stretching and C–H stretching vibrations.22 Above results confirmed that the HSA layers were successfully assembled. Fig. 1D exhibited the EDS spectra of nanotubes. The main compositions of carbon, nitrogen, oxygen and sulfur were detected, indicating that the expected distributions of PEI and HSA existed.
 |
| Fig. 1 (A) SEM and (B) TEM images of (PEI/HSA)5PEI nanotubes, (C) FT-IR spectra of (PEI/HSA)5PEI nanotubes and HSA, (D) EDS spectra of (PEI/HSA)5PEI nanotubes, the inset is the elemental percentage. | |
The nanotubes with interior and exterior surfaces had cationic charges that could strongly bind the negatively charged DNA through electrostatic interaction. Fig. 2 showed the TEM images of DNA/(PEI/HSA)5PEI nanotubes complexes. Compared with polyA25 (Fig. 2A), the detail structure was clearly demonstrated by using the ctDNA. Indicated by black arrow in Fig. 2B, the adsorbed ctDNA chains were visible.
 |
| Fig. 2 TEM images of polyA25 (A) and ctDNA (B) complex with (PEI/HSA)5PEI nanotubes in pH7.4 PB solution. Black arrow indicates the adsorbed ctDNA chains onto nanotube. | |
3.2. Effect of pH
Since electrostatic interaction plays a key role in determining the binding between DNA and nanotubes, it is necessary to study the pH effect on the adsorption. From Fig. 3, it was found that polyA25 binding decreased slightly as the pH increased. For example, the binding reduced from 94.8% to 87% by raising the pH from 4.7 to 11. The (PEI/HSA)5PEI nanotubes surfaces are terminated by primary, secondary and tertiary amino groups of PEI and the pKa values of these groups are around 9, 8 and 6–7, correspondingly.23,24 For polyA25, it always maintains negative charges in the pH tested for the phosphate group.25 At pH below 9, amino groups were protonated to give a highly positively charged surface. As pH above 10, deprotonation made the decrease of adsorbed polyanion DNA.
 |
| Fig. 3 Effect of pH on polyA25 adsorption onto (PEI/HSA)5PEI nanotubes. ((PEI/HSA)5PEI nanotubes dose = 0.1 mg, C0 = 108 mg L−1, t = 1 h). | |
3.3. Adsorption kinetics
The time-dependent adsorption kinetics of the (PEI/HSA)5PEI nanotubes for polyA25 was investigated. As shown in Fig. 4, the amount of adsorbed polyA25 increased rapidly in initial time, and then increased gradually until reached the maximum. For lower concentration of 22 mg L−1, the time to reach the equilibrium was about 30 min. while for concentrations of 58–108 mg L−1, 50 min was required. For larger concentrations of 163–228 mg L−1, a longer time of 300 min was necessary. The effect of initial polyA25 concentration on adsorption was also observed. A rise of concentration from 22 mg L−1 to 228 mg L−1 caused an increase in the amount of equilibrium adsorption from 42.1 mg g−1 to 392.0 mg g−1, which was ascribed to more availability of polyA25 to the active sites on nanotubes at higher concentration.
 |
| Fig. 4 Effect of adsorption time on polyA25 adsorption onto (PEI/HSA)5PEI nanotubes ((PEI/HSA)5PEI nanotubes dose = 0.1 mg, C0 = 22–228 mg L−1, pH = 7.4 ± 0.2). | |
In order to understand the mechanism of adsorption kinetics, three types of kinetic model, the pseudo-first-order, pseudo-second-order and intra-particle diffusion models, were used to analyze the experimental dates above.
The pseudo-first-order and pseudo-second-order kinetics26,27 are expressed as:
|
ln(qe − qt) = ln qe − k1t
| (3) |
|
 | (4) |
where
k1 (1/min) and
k2 (g/(mg min)) are the rate constants of pseudo-first-order and pseudo-second-order equations, respectively.
qe (mg g
−1) and
qt (mg g
−1) are the amount of adsorbed polyA
25 at equilibrium and
t time, respectively.
As shown, Fig. 5A and B were the fit of the pseudo-first-order and pseudo-second-order models, respectively. The obtained kinetic parameters were listed in Table 1. It was found the pseudo-second-order equation fitted better than the pseudo-first-order model by comparing the correlation coefficients. The calculated values qe,cal (i.e. 42.4, 111.1, 196.5, 325.7, 408.2 mg g−1) from the former were close to the experimental values qe,exp (i.e. 42.1, 106.1, 195.1, 315.0, 392.0 mg g−1), suggesting that the pseudo-second-order kinetics more suitably described the adsorption of polyA25.
 |
| Fig. 5 (A) The pseudo-first-order kinetic model, (B) the pseudo-second-order kinetic model, (C) the intra-particle diffusion model for polyA25 adsorption onto (PEI/HSA)5PEI nanotubes. | |
Table 1 Comparison of pseudo-first-order, pseudo-second-order kinetic and intra-particle diffusion models parameters, calculated values qe,cal and experimental values qe,exp for different initial concentrations of polyA25 adsorption onto (PEI/HSA)5PEI nanotubes
Model |
Parameter |
C0 (mg L−1) |
22 |
58 |
108 |
163 |
228 |
|
qe,exp (mg g−1) |
42.1 |
106.1 |
195.1 |
315.0 |
392.0 |
Pseudo-first-order |
k1 (min−1) |
0.0384 |
0.0721 |
0.0652 |
0.0354 |
0.0238 |
qe,cal (mg g−1) |
13.1 |
52.5 |
70.8 |
273.2 |
361.0 |
R2 |
0.7967 |
0.9149 |
0.8688 |
0.9746 |
0.9576 |
Pseudo-second-order |
k2 (g/(mg min)) |
0.0147 |
0.0021 |
0.0015 |
0.0003 |
0.0002 |
qe,cal (mg g−1) |
42.4 |
111.1 |
196.5 |
325.7 |
408.2 |
R2 |
0.9999 |
0.9997 |
0.9996 |
0.9993 |
0.9987 |
Intra-particle diffusion |
ki1 (mg/(g min0.5)) |
14.6 |
26.4 |
45.7 |
46.2 |
59.8 |
R2 |
0.9958 |
0.9866 |
0.9707 |
0.9753 |
0.9986 |
ki2 (mg/(g min0.5)) |
1.44 |
9.60 |
21.1 |
18.2 |
19.4 |
R2 |
0.9032 |
0.9292 |
0.9754 |
0.9502 |
0.9316 |
ki3 (mg/(g min0.5)) |
0.0204 |
0.0344 |
0.0399 |
1.11 |
2.89 |
R2 |
0.9382 |
0.9795 |
0.9363 |
0.9191 |
0.9503 |
The adsorption process was further analyzed using the intra-particle diffusion model28 expressed as:
where
ki (mg/(g min
0.5)) is the rate constant of intra-particle diffusion. The value of
ki can be calculated from the slope of plot
qt versus t0.5.
Three regions were seen from the plots of qt versus t0.5 at different initial concentrations of 22–228 mg L−1, which represented the three consecutive mass transport steps in adsorption (Fig. 5C). The rates of adsorption at corresponding stages expressed as ki1, ki2, ki3 could be derived from the slopes of linear portions. The first stage also the fastest (ki1) was attributed to large amounts of polyA25 diffusion to the external surface of nanotubes. The second portion (ki2) was the stage of polyA25 migrating into the pores. With concentration of polyA25 decreasing in solution, the intra-particle diffusion gradually slowed down until reached the equilibrium stage (ki3). As listed in Table 1, the rate was ki1 > ki2 > ki3, and the values increased as initial concentration increased, since the intra-particle diffusion model was based on Fick's Law. ki3 was larger at higher initial concentration and thus longer equilibrium time was needed, which well interpreted the experimental results of equilibrium time needed.
The correlation of rate parameter ki1 and initial concentration28 was represented as following, and the plot of ln
ki1 versus ln
C0 was shown in Fig. 6.
|
 | (6) |
The values of constant were listed in
Table 2.
 |
| Fig. 6 Plot of ln ki1 against ln C0 for polyA25. | |
Table 2 Values of rate parameter constants in equation
Material |
Parameter |
Parameter value |
PolyA25 |
An |
2.40 |
Bn |
0.59 |
R2 |
0.9653 |
3.4. Adsorption isotherm
The Langmuir and Freundlich isotherm equations are the typical models to predict the adsorption type of adsorbate on an adsorbent. The Langmuir isotherm equation is based on monolayer adsorption on a homogeneous surface of adsorbent29 and the linear form is expressed as: |
 | (7) |
where Ce (mg L−1) is the equilibrium concentration of polyA25, qe (mg g−1) is the amount of adsorbed polyA25 at equilibrium, b (L mg−1) and Q0 (mg g−1) are Langmuir constants related to adsorption energy and adsorption capacity, respectively. The values of Q0 and b can be calculated from the slope and intercept of plot Ce/qe versus Ce.
A dimensionless equilibrium parameter (RL),29 which is represented as:
|
 | (8) |
where
b (L mg
−1) is Langmuir constant,
C0 (mg L
−1) is the highest polyA
25 concentration. The value of
RL means the type of isotherm to be either unfavorable (
RL > 1), linear (
RL = 1), favorable (
RL < 1) or irreversible (
RL = 0).
The Freundlich isotherm model is regarded as adsorption on a heterogeneous surface30 and expressed as:
|
 | (9) |
where
KF (mg g
−1) and
n are the Freundlich constants related to adsorption capacity and adsorption intensity, respectively. The values of 1/
n and
KF can be obtained from the slope and intercept of plot ln
qe versus ln
Ce.
The isotherm curve of polyA25 adsorption on (PEI/HSA)5PEI nanotubes was presented in Fig. 7 and the fitting models by Langmuir and Freundlich isotherm equations were shown in Fig. 8. The derived parameters were summarized in Table 3.
 |
| Fig. 7 PolyA25 adsorption isotherm of (PEI/HSA)5PEI nanotubes. ((PEI/HSA)5PEI nanotubes dose = 0.1 mg, C0 = 22–500 mg L−1, t = 8 h, pH = 7.4 ± 0.2). | |
 |
| Fig. 8 Fitting by (A) Langmuir model and (B) Freundlich model for polyA25 adsorption onto (PEI/HSA)5PEI nanotubes. | |
Table 3 Isotherm parameters for polyA25 adsorption on (PEI/HSA)5PEI nanotubes
Model |
Parameter |
Parameter value |
Langmuir |
Q0 (mg g−1) |
606.0 |
b (L mg−1) |
0.048 |
R2 |
0.9944 |
RL |
0.04 |
Freundlich |
1/n |
0.48 |
KF (mg g−1) |
52.9 |
R2 |
0.8246 |
As seen, Langmuir model (R2 = 0.9944) proved to be more fitted for describing the adsorption process, demonstrating that a monolayer adsorption occurred. The calculated maximum monolayer adsorption capacity (Q0) was 606.0 mg g−1. The low value of b (<1) implied (PEI/HSA)5PEI nanotubes had a high affinity to polyA25. Additionally, polyA25 adsorption onto nanotubes was also favorable reasoned from the value of RL (<1).
3.5. Comparison adsorption capability with nanoparticles
Compared with spherule allophane nanoparticles (45.0 mg g−1)31 and PEI-modified Fe3O4/Au nanoparticles (90.0 mg g−1),32 the adsorption amount of (PEI/HSA)5PEI nanotubes is 606.0 mg g−1. This is the strongest DNA adsorption loader in all previous reports. The excellent absorptivity of (PEI/HSA)5PEI nanotube benefits from its large surface area, unique hollow structure and sufficient DNA binding sites on both outer and inner surfaces. In addition, two open-end terminals make it possible that DNA diffuses into the tube and adsorbs on inner wall.
3.6. DNA release
The sample of DNA-loaded (PEI/HSA)5PEI nanotubes with adsorbed amount of 195.1 mg g−1 was used to investigate ionic strength induced release behaviours. As shown in Fig. 9, there was hardly any DNA released in the absence of NaCl. Once NaCl was added, the amount of DNA in solution quickly increased and gave a fast desorption kinetics. For example, by varying NaCl concentration from 0.1 M to 1.5 M, the release ratio increased from 5% to 67.1% at pH 7.4 and from 10% to 78.8% at pH 5.7 in 5 minutes, which might be in that the electrostatic interaction between polyA25 and (PEI/HSA)5PEI nanotubes was sensitive in a relatively high ionic strength.33 At the same ionic strength, the ratio at pH 5.7 was much higher than that of at pH 7.4. This indicated that DNA release from (PEI/HSA)5PEI nanotubes was also pH triggered, providing the necessary conditions for intracellular delivery.
 |
| Fig. 9 Kinetics of polyA25 release from (PEI/HSA)5PEI nanotubes at (A) pH 7.4 ± 0.2 and (B) pH 5.7 ± 0.2. | |
4. Conclusions
In this study, hybrid PEI/HSA nanotubes were successfully prepared with the maximum adsorption capability for polyA25 (606.0 mg g−1) at pH 7.4 and 25 °C. The adsorption kinetics and isotherm were discussed in detail and demonstrated to fit the pseudo-second-order kinetic, intra-particle diffusion and Langmuir isotherm model. DNA release from DNA/(PEI/HSA)5PEI nanotubes complexes was mainly controlled by the ionic strength and also influenced by pH of solution. In summary, our researches would provide useful information to understand the interaction between DNA and protein nanotubes for design and development of protein nanotubes as gene vectors.
Acknowledgements
The authors gratefully acknowledge the National Science Foundation of China (21175105, 21375104 and 21327806), the Specialized Research Fund for the Doctoral Program of Higher Education of China (20126101110015), the Natural Science Foundation of Shaanxi Province of China (2014JM2050) and the Specialized Foundation of Education Bureau of Shannxi Province of China (12JK0634) for financial support.
Notes and references
- E. Huang, F. Zhou and L. Deng, Langmuir, 2000, 16, 3272–3280 CrossRef CAS.
- A. Steel, R. Levicky, T. Herne and M. J. Tarlov, Biophys. J., 2000, 79, 975–981 CrossRef CAS.
- A. W. Peterson, R. J. Heaton and R. M. Georgiadis, Nucleic Acids Res., 2001, 29, 5163–5168 CrossRef CAS PubMed.
- N. Jirakittiwut, N. Panyain, T. Nuanyai, T. Vilaivan and T. Praneenararat, RSC Adv., 2015, 5, 24110–24114 RSC.
- R. Qi, S. Liu, J. Chen, H. Xiao, L. Yan, Y. Huang and X. Jing, J. Controlled Release, 2012, 159, 251–260 CrossRef CAS PubMed.
- T. M. Sun, J. Z. Du, L. F. Yan, H. Q. Mao and J. Wang, Biomaterials, 2008, 29, 4348–4355 CrossRef CAS PubMed.
- C. R. Martin and P. Kohli, Nat. Rev. Drug Discov., 2003, 2, 29–37 CrossRef CAS PubMed.
- R. Singh, D. Pantarotto, D. McCarthy, O. Chaloin, J. Hoebeke, C. D. Partidos, J.-P. Briand, M. Prato, A. Bianco and K. Kostarelos, J. Am. Chem. Soc., 2005, 127, 4388–4396 CrossRef CAS PubMed.
- C. C. Chen, Y. C. Liu, C. H. Wu, C. C. Yeh, M. T. Su and Y. C. Wu, Adv. Mater., 2005, 17, 404–407 CrossRef CAS PubMed.
- S. J. Son, J. Reichel, B. He, M. Schuchman and S. B. Lee, J. Am. Chem. Soc., 2005, 127, 7316–7317 CrossRef CAS PubMed.
- A. Karlsson, R. Karlsson, M. Karlsson, A.-S. Cans, A. Strömberg, F. Ryttsén and O. Orwar, Nature, 2001, 409, 150–152 CrossRef CAS PubMed.
- S. A. Dougherty, D. Zhang and J. Liang, Langmuir, 2009, 25, 13232–13237 CrossRef CAS PubMed.
- X. Qu, G. Lu, E. Tsuchida and T. Komatsu, Chem.–Eur. J., 2008, 14, 10303–10308 CrossRef CAS PubMed.
- D. Zhang, S. A. Dougherty and J. Liang, J. Nanopart. Res., 2011, 13, 1563–1571 CrossRef CAS.
- X. Qu and T. Komatsu, ACS Nano, 2009, 4, 563–573 CrossRef PubMed.
- T. Komatsu, X. Qu, H. Ihara, M. Fujihara, H. Azuma and H. Ikeda, J. Am. Chem. Soc., 2011, 133, 3246–3248 CrossRef CAS PubMed.
- S. B. Nimse, K. Song, M. D. Sonawane, D. R. Sayyed and T. Kim, Sensors, 2014, 14, 22208–22229 CrossRef PubMed.
- X. Gao, K.-S. Kim and D. Liu, AAPS J., 2007, 9, E92–E104 CrossRef CAS PubMed.
- Y. Liu, D. C. Wu, W. D. Zhang, X. Jiang, C. B. He, T. S. Chung, S. H. Goh and K. W. Leong, Angew. Chem., 2005, 44, 4782–4785 CrossRef CAS PubMed.
- S. Curry, H. Mandelkow, P. Brick and N. Franks, Nat. Struct. Biol., 1998, 5, 827–835 CrossRef CAS PubMed.
- X. M. He and D. C. Carter, Nature, 1992, 358, 209–215 CrossRef CAS PubMed.
- J. Kong and S. Yu, Acta Biochim. Biophys. Sin., 2007, 39, 549–559 CrossRef CAS PubMed.
- C. R. Dick and G. E. Ham, J. Macromol. Sci., Part A: Pure Appl.Chem., 1970, 4, 1301–1314 CrossRef CAS.
- W. Godbey, K. K. Wu and A. G. Mikos, J. Biomed. Mater. Res., 1999, 45, 268–275 CrossRef CAS.
- M. Wu, R. Kempaiah, P. J. Huang, V. Maheshwari and J. Liu, Langmuir, 2011, 27, 2731–2738 CrossRef CAS PubMed.
- D. Wang, L. Liu, X. Jiang, J. Yu, X. Chen and X. Chen, Appl. Surf. Sci., 2015, 329, 197–205 CrossRef CAS PubMed.
- H. J. Yan, J. W. Bai, X. Chen, J. Wang, H. S. Zhang, Q. Liu, M. Zhang and L. H. Liu, RSC Adv., 2013, 3, 23278–23289 RSC.
- W. H. Cheung, Y. S. Szeto and G. McKay, Bioresour. Technol., 2007, 98, 2897–2904 CrossRef CAS PubMed.
- B. H. Hameed, A. T. Din and A. L. Ahmad, J. Hazard. Mater., 2007, 141, 819–825 CrossRef CAS PubMed.
- A. A. Ahmad, B. H. Hameed and N. Aziz, J. Hazard. Mater., 2007, 141, 70–76 CrossRef CAS PubMed.
- Y. Matsuura, F. Iyoda, S. Arakawa, B. John, M. Okamoto and H. Hayashi, Mater. Sci. Eng., C, 2013, 33, 5079–5083 CrossRef CAS PubMed.
- H. Sun, X. Zhu, L. Zhang, Y. Zhang and D. Wang, Mater. Sci. Eng., C, 2010, 30, 311–315 CrossRef CAS PubMed.
- G. S. Irmukhametova, B. J. Fraser, J. L. Keddie, G. A. Mun and V. V. Khutoryanskiy, Langmuir, 2012, 28, 299–306 CrossRef CAS PubMed.
|
This journal is © The Royal Society of Chemistry 2015 |
Click here to see how this site uses Cookies. View our privacy policy here.