Hierarchical polymorphic MnCO3 series induced by cobalt doping via a one-pot hydrothermal route for CO catalytic oxidation

Xiaoran Niu, Huiying Wei, Wei Liu, Shuping Wang, Jingcai Zhang and Yanzhao Yang*
Key Laboratory for Special Functional Aggregate Materials of Education Ministry, School of Chemistry and Chemical Engineering, Shandong University, Jinan, 250100, P. R. China. E-mail: yzhyang@sdu.edu.cn; Fax: +86-531-88564464; Tel: +86-531-88362988

Received 17th March 2015 , Accepted 25th March 2015

First published on 25th March 2015


Abstract

In this study, a series of cobalt-doped MnCO3 hierarchical microstructures with different morphologies were synthesized by tuning a single variable (the dopant content) via a one-step, mild solvothermal synthesis in a N,N-dimethylformamide (DMF) solution system. Structure evolution of the polymorphic MnCO3 took place with the morphology obviously transforming from an initial flower-microstructure to fan-like, then to hedgehog-like hemispheres and finally to flake-spheres as the Co2+ theoretical content (Co/(Co + Mn)) increased from 0 to 20% in the solvothermal process. Cobalt ion modulated reaction-limited aggregation (RLA) is proposed in the growth mechanism. The mechanism of Co2+-induced acceleration and full growth is further investigated. The Co2+ doped manganese carbonate displays wonderful catalytic performance towards CO oxidation.

1 Introduction

Nowadays, one of the major focuses of the research area of nanotechnology has been to synthetically design micro-/nanostructures with various morphologies such as nanowires,1,2 hollow microspheres,3 ball-flowers,4,5 nanodiscs,6 nanosheets,1,7 etc.The hierarchical morphologies mean that nanostructured materials possess novel properties which have attracted much attention from researchers to tune the intrinsic properties which are largely dependent on the shape, dimension, polymorph and morphology of the materials. Naturally, it is of great importance to explore an efficient way to exert highly accurate control over the morphology and polymorph and to arrange them into highly ordered and hierarchically organized structures from nanoscale to macroscale.8–10 In recent research, the doping-induced control of size and shape has stood out among conventional morphological approaches11–15 as a suitable modification to improve the function of the prepared nanomaterials. Liu et al. prepared copper doped CeO2 nanospheres with different hollowness and size, and found the differences were due to the concentration of CuCl2·2H2O in the precursor solution; moreover, Cu2+ doping was found to enhance the reduction behavior and catalytic performance towards CO oxidation.16 Shen et al. discovered that the concentration of ZrO(NO3)2 influenced the film thickness of their prepared Zr-doped hematite nanorods.17 Lu’s group discussed that the morphology of SnO2 could be controlled by varying the concentration of the added Zn2+.18 In fact, impurity doping was recently found to have crucial effects on the nucleation and growth of many functional materials, as well as the enhancement of the performance in practical applications.

Manganese carbonate (MnCO3) materials have attracted the fascination of researchers because they are cheap, abundant, environmentally friendly and possess intriguing properties that are widely used in promising systems for biomedical applications, such as biosensors, bioreactors, and drug delivery devices,19 and in other applications such as potential electrode materials for super capacitors,20 or as catalysts for the Fischer–Tropsch reaction.21,22 Furthermore, MnCO3 could also be used as a typical precursor for manganese oxides, which are of considerable importance due to their potential applications in catalysis,23,24 rechargeable batteries,25–27 or as a new template to prepare various hierarchical materials.28,29 To date, many endeavors have been devoted to investigate the influence of the doping elements on the morphologies17 and the corresponding improvement in the functional behavior of doped metal oxides.17,18,25 However, literature concerning the impurity doping-induced control on the morphology growth and phase transformations of MnCO3 materials is rare. Hydro-/solvothermal and co-precipitation methods were used for the synthesis of the metal carbonate.20,28 Different solvents and surfactants are most commonly used to direct and mediate metal carbonate crystallization.30–32 Hollow MnCO3 microspheres and MnCO3 nanocubes were synthesized via an ionic liquid-assisted hydrothermal synthetic method by regulating the concentration of the ionic liquid.33 Hollow CaCO3 spheres were synthesized in water/[HMim]-[BF4] emulsions using CaCl2 as the precursor.34 However, to the best of our knowledge, it still remains an open challenge to establish a suitable and facile synthetic methodology for the preparation of metal carbonate materials with easy control over phase, size, shape and dimensionality.

In this study, we demonstrate the control of the morphological patterns of a series of cobalt-doped MnCO3 micro-structures by tuning a single variable (the dopant content) in a one-step, mild solvothermal process. As far as we know, this is the first time that the impact of cobalt ion doping on the morphology of manganese carbonate has been reported. When the Co2+ theoretical content (Co/(Co + Mn)) was increased from 0 to 20%, the morphology of the final products changed and cobalt ion modulated reaction-limited aggregation (RLA) is proposed in the growth mechanism. Moreover, the wonderful catalytic performance of the Co2+ doped manganese carbonate hierarchical architectures towards CO oxidation was demonstrated.

2 Experimental

2.1 Materials

All the chemical reagents were of analytical grade, purchased from Sinopharm Chemical Reagent Co. Ltd (China) and used as received without further purification. Commercial manganese carbonate was used: 90 wt% MnCO3 and 10 wt% PC (Portland cement), BET surface area of 5.1 m2 g−1.

2.2 The synthesis of MnCO3 microflowers (P1)

0.19 g of polyvinylpyrrolidone (PVP, K30) was dissolved into 15 mL of N,N-dimethylformamide (DMF), and after stirring for 20 min, 180 μL of a Mn(NO3)2 solution (50 wt%) was added to the homogeneous solution. After stirring for another 10 min, the mixture was transferred to a 25 mL Teflon-lined stainless steel autoclave, which was maintained for 18 h at 210 °C with a ramp rate of 2 °C min−1. When the autoclave was cooled to room temperature, the white products were collected and washed with absolute alcohol four times sequentially. Finally, the products were dried at 60 °C overnight.

2.3 The synthesis of Co-doped MnCO3 microstructures (P2–P6)

Different amounts of cobalt acetate tetrahydrate, weighed in molar ratios (Co/(Co + Mn)) of 1.5%, 5%, 10%, 15% and 20%, were dissolved into 15 mL of N,N-dimethylformamide (DMF) that contained 0.19 g of PVP (K30). After stirring the above homogeneous solution for 20 min, 180 μL of a Mn(NO3)2 solution (50 wt%) was added to the reaction solution. After continuous stirring for another 10 min, the mixture was transferred to a 25 mL Teflon-lined stainless steel autoclave, which was maintained for 18 h at 210 °C with a ramp rate of 2 °C min−1. When the autoclave was cooled to room temperature, the final precipitates were collected and washed with absolute alcohol four times sequentially. Finally, the products were dried at 60 °C overnight. The above products with different Co2+ doping concentration were labeled as the P2–P6 samples.

2.4 Physical characterization

The crystal structure information of the synthesized samples was established by powder X-ray diffraction (XRD Bruker D8 diffractometer with Cu-Kα radiation (λ = 0.15418 nm)). The micro-structure morphology of the powders was observed by using a transmission electron microscope (TEM, JEM 1011-CXII, 100 kV). A field-emission scanning electron microscope (FE-SEM, Hitachi, S4800) equipped with energy-dispersive X-ray spectroscopy (EDS) was used to characterize the specific morphologies. X-ray photoelectron spectroscopy (XPS) data were acquired on an ESCALAB 250 X-ray photoelectron spectrometer with Al Kα radiation and the binding energies were determined utilizing the C 1s spectrum as a reference at 284.7 eV. The surface areas were calculated by the Brunauer–Emmett–Teller (BET) method. Raman data were obtained using a Lab RAM HR4800 spectrometer using a 473 nm laser line as an excitation source. FTIR spectra were obtained on a Bruker Vector 22 model spectrometer.

2.5 Catalytic experiments

The catalytic activity of the as-obtained samples was evaluated on a continuous flow fixed-bed micro-reactor operating under atmospheric pressure. In a typical experiment, 25 mg catalyst particles with 250 mg quartz sand were placed into a stainless steel tube reactor. The composition of the raw material gas was CO/O2/N2 (1[thin space (1/6-em)]:[thin space (1/6-em)]10[thin space (1/6-em)]:[thin space (1/6-em)]89). The flow rate was 60 mL min−1. The temperature of the reactor was monitored by the thermocouple placed on the catalysts, and the heating rate was 1.7 K min−1. The products from the outlet of the reactor were analyzed using an online gas chromatograph (Gasboard-3121, China Wuhan Cubic Co.).

3 Results and discussion

3.1 Structural analysis

In our work, MnCO3 products, including pure MnCO3 (P1) and the series of Co-doped MnCO3 samples (P2–P6), were synthesized via a one-step hydrothermal method at 210 °C; it is worth noting that it’s crucial to maintain a slow warming with a ramp rate of 2 °C min−1. The phases of the as-obtained products were characterized by powder XRD measurements, as shown in Fig. 1. The diffraction peaks of all the products illustrate that they can be perfectly indexed to a pure phase of a rhombohedral structure of MnCO3 (JCPDS no. 44-1472). It was noticed that no other peaks stemming from manganese oxides, cobalt oxides or cobalt carbonate could be found, which indicated the formation of homogeneous Mn–Co carbonate solid solutions. Furthermore, the chemical composition, the bonding situation of the Co-doped MnCO3 crystals, and the substitution will be ascertained in the following text.
image file: c5ra04708k-f1.tif
Fig. 1 XRD patterns of the as-obtained P1–P6 samples.

The typical SEM images of the as-synthesized samples are displayed in Fig. 2. The low magnification SEM images of the P1 sample show that the products consist of well-dispersed hierarchical microflowers with sizes ranging from 10 to 12 μm (Fig. 2A1). The magnified SEM image (Fig. 2A2) displays the panoramic view of our microflowers and makes it clear that the petals are branched out by inside-out evacuation.


image file: c5ra04708k-f2.tif
Fig. 2 SEM images of the as-prepared P1–P6 samples (A–F) with Co2+ dopant content ranging from 0 to 20%.

In our experiment, an eye-catching phenomenon emerged when Co2+ was introduced to the manganese carbonate host. Varying the amount of cobalt acetate tetrahydrate could yield a series of Co–MnCO3 microstructures with controllable sizes and morphologies. When the amount of cobalt acetate tetrahydrate reached 1.5%, the primary blooming flowers morphology (Fig. 2A1 and A2) disappeared and the P2 sample showed ordered propeller-like morphology with an average radius of 6.5 μm as shown in Fig. 2B1 and B2; then a fan-shaped microstructure (Fig. 2C1 and C2) and a hedgehog-like structure with a radius of 3 μm (Fig. 2D1 and D2) were obtained when 5% and 10% cobalt acetate tetrahydrate were added to the system, respectively. Obviously, the incorporation of Co2+ lead to fully oriented growth for the Mn–Co carbonate solid solutions. Furthermore, the continuous increase in the amount of cobalt acetate tetrahydrate resulted in the formation of flake-microspheres with increased average radii: 6 μm for 15% doping (Fig. 2E1 and E2) and 8 μm for 20% doping (Fig. 2F1 and F2). The influence of Co2+ doping on the morphology of MnCO3 was found to be significant due to the fact that the structures of the Co-doped products evolved from propeller-like to fan-like to structures almost like a half a sphere and finally into spherical structures during the whole process of increasing the amount of Co(AC)2·4H2O.

The compositional data of the as prepared P1–P6 samples are shown in Table 1 (ESI). The Co/(Co + Mn) atom ratio increases as the theoretical doping increases. In addition, the EDS spectra corresponding to the doped samples are also displayed in Fig. S1. In our work, the doping ions have the same valence and similar radii to the ones in the hosts, and are stable with the host lattice anion, which allowed some cobalt cations to substitute Mn2+ ions into the MnCO3 lattice and thus drove the formation of a stable deficient rhombohedral structure. As shown in Fig. 3, the element mapping of Mn, Co, C and O in an individual microsphere (P5 sample) and a fan-like structure (P3 sample) demonstrates that all four elements are distributed throughout the MnCO3 microstructures. As a result, it confirmed the occurrence of homogeneous distributions of Mn, Co, C and O, which is consistent with the XRD results.


image file: c5ra04708k-f3.tif
Fig. 3 SEM images and corresponding EDS mapping images of an individual (A) P5 microsphere and (B) fan-like P3 microstructure: Mn (red), Co (green), C (grey) and O (blue).

All of the samples (P1–P6) were also characterized by Raman spectroscopy using an exciting laser wavelength of 473 nm, illustrated in Fig. 4. For the pure manganese carbonate (P1 sample), the main characteristic Raman band is observed at 1088 cm−1, which is due to the carbonate group.35,36 Furthermore, the peaks for the P2–P6 samples display a regular variation in that the peak values decrease with an increase in the Co2+ doping content. This may be corresponding to lattice defects. In fact, the crystal lattice of our doped MnCO3 contracts since Co2+ (small-size impurities) are doped to substitute the host ions (Mn2+),16,37 which will inevitably result in smaller atomic spacing. Moreover, no characteristic peaks originating from metal oxides in the spectrum of the P2–P6 samples appear. This agrees with the previous XRD results, which further certify the incorporation of cobalt ions in the MnCO3 rhombohedral lattice.


image file: c5ra04708k-f4.tif
Fig. 4 Raman spectra of the synthesized pure (P1) and Co-doped manganese carbonate (P2–P6) samples.

FTIR analysis was also carried out to investigate the influence of the impurity doping on the formation of MnCO3 crystals. Fig. S2 shows the FTIR spectra of pure MnCO3 (P1) and Co-doped MnCO3 (P2–P6). As we can see, these six spectra are almost the same. A weak broad band around 3430 cm−1 is due to the stretching and bending vibrations of water molecules adsorbed on the sample surface. The presence of CO32− in the as-prepared samples is evidenced by the characteristic peaks at 1402, 1075, 861.84, and 725 cm−1, which are assigned to the vibrational modes ν3(E′), ν1(A1′), ν2(A′′), and ν4(E′′), respectively.33,38–40 In fact, the peak located around 2490 cm−1 is also associated to a vibrational mode of the carbonate anion. The weak peak at 1798 cm−1 is attributed to an overtone or a combination band of the composition of the carbonate groups and divalent metal ions.41

To evaluate the oxidation state of the Mn and the Co dopant, XPS analysis was performed. Fig. 5a shows a wide scan spectrum of the doped P5 sample as the typical example. The peaks located at 284.7, 532, 642, and 799 eV are assigned to the characteristic peaks of C 1s, O 1s, Mn 2p and Co 2p, respectively.38,41 As expected, all of the above sharp peaks verify the abundant existence of carbon, oxygen and cobalt elements on the surface of the Co-doped MnCO3. As displayed in Fig. 5b, several typical BE peaks (such as those at 642.2 and 654.2 eV) of the Mn 2p spectrum are observed in the P5 sample, which suggest the existence of Mn(II) in the as-obtained products. The Co 2p spectrum (Fig. 5e) shows a doublet containing a low energy band (Co 2p3/2) and a high energy band (Co 2p1/2) at 781.8 and 798.4 eV, respectively. Thus, the energy difference between the peaks for Co 2p3/2 and 2p1/2 is approximately 16.6 eV, which indicates the presence of both Co2+/Co3+ species in the doped manganese carbonate samples.42–44 The peak at 289 eV of the C 1s spectrum (Fig. 5c) is assigned to the carbon element in association with oxygen in the carbonate ions. Furthermore, the predominant O 1s peak (Fig. 5d) located at a binding energy of 531.7 ± 0.2 eV belongs to the lattice oxygen of MnCO3. The XPS spectra are consistent with the theory that the cobalt ions substitute Mn2+ in the MnCO3 lattice,45 which verifies our view in EDS-mapping.


image file: c5ra04708k-f5.tif
Fig. 5 Representative XPS spectra of the P5 sample: (a) survey, (b) Mn 2p, (c) C 1s, (d) O 1s and (e) Co 2p.

3.2 Morphology mechanism

For the pure sample, highly monodisperse nanoblocks with a size of 360 nm were obtained at 4 h after starting the heat preservation at 210 °C, which may be supposed as the initial nucleating stage. Progressive processes of self-assembled upgrowths of the flakes and hierarchical arrangements lead to the final petal morphology, as illustrated in Fig. 2A1 and A2.

In order to understand the formation mechanism of the Co-doped samples and the growth process better, we studied their temporal morphological evolution by taking TEM images on samples obtained from the reaction at different time intervals. Herein, the P3 sample served as an illustrative case study with its theoretical doping content of Co(AC)2·4H2O as 5%; the 15% sample is illustrated in Fig. S3. Fig. 6 shows the evolution of the fan-like structures. When the solvothermal reaction time is 70 min at 210 °C, the nanoblocks are already observed. XRD (Fig. 7a) of the sample presents diffraction peaks of Mn3O4 (JCPDS no. 24-0734). As the reaction proceeds to 2 h, these nanoblocks start to gather in a predetermined direction (Fig. 6b). This oriented attachment following the aggregation is confirmed by Fig. 6c. Growth cycles of aggregation and oriented attachment increase the thickness of the fan-like structures and the TEM image becomes darker, as shown in Fig. 6d and e. As the solvothermal process is prolonged to 12 h, the morphology grows almost into its target morphology (Fig. 6f) and the size of the fan increases with the reaction time. XRD shows the same diffraction peaks of Mn3O4 for the sample collected at 2 h. Meanwhile, some peaks weaken and even disappear at 4 h, but no other peaks from the cobalt series appear (Fig. 7b and c). It’s worth noting the crystalline transition that occurred after 8 h when the crystals grew from Mn3O4 into MnCO3 (JCPDS no. 44-1472), as displayed in Fig. 7d and e. The typical probable chemical reaction for the formation of Co–MnCO3 can be described by the following steps:40

 
HCON(CH3)2 + H2O → HCOOH + NH(CH3)2 (1)
 
(1 − x)Mn2+·xCo2+ + 2OH + 1/6O2 → Mn(1−x)CoxO4/3 + H2O (2)
 
Mn(1−x)CoxO4/3 + HCOOH → Mn(1−x)CoxCO3 + H2O (3)


image file: c5ra04708k-f6.tif
Fig. 6 Typical TEM images of the Co-doped P3 sample obtained at 210 °C for different solvothermal times: (a) 70 min, (b) 2 h, (c) 3 h, (d) 4 h, (e) 8 h and (f) 12 h.

image file: c5ra04708k-f7.tif
Fig. 7 XRD patterns of the Co-doped P3 sample obtained at 210 °C for different solvothermal times: (a) 70 min, (b) 2 h, (c) 4 h, (d) 8 h and (e) 12 h.

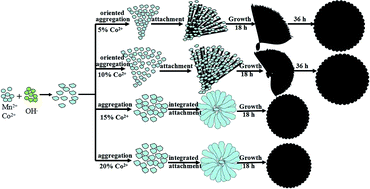
Based on the above time-dependent transformation process, we thus propose the reaction-limited aggregation (RLA) process46 to explain the formation mechanism of Co-doped manganese carbonate, and their shape evolution is illustrated in detail in Scheme 1. From the nanocrystal synthesis point of view, crystal growth occurs through nucleation followed by growth. Firstly, the initial Mn1−xCoxO4/3 nuclei tend to be nanoblocks because of the crystalline nature of the hausmannite structure. Then, these initial nuclei aggregate and self-assemble to quickly form the rudimentary fan-like, hedgehog-like and spherical structures for the 5%, 10% and 15% samples, respectively. At the same time, the spherical structures were further maintained for the 20% sample. Such notable changes in the morphological variation originate from the inclusion of different amounts of Co(AC)2·4H2O as utilized for the Co doping in the reaction solution for 18 h. It has been demonstrated that the introduction of Co2+ increases the polarity of the reaction system.18 Thus, the addition of Co(AC)2·4H2O increases the driving force for aggregation which accelerates the aggregation speed. For the 1.5% to 10% Co-doped samples, oriented aggregation occurs among Co-doped Mn3O4 nanoblocks, followed by linear growth and further self-assembly into flower-like or hemispherical structures. However, when the content of Co2+ ions reaches 15–20%, the excessive aggregation speed tends to be deprived of directionality. Because of the reduced surface-to-volume ratios, and thus surface energy, the initial Co-doped Mn3O4 nanoblocks undergo anisotropic aggregation to form spherical structures, further integrating into the layered sheet structure and ultimately growing into compact hierarchical microspheres. What’s more, the initial aggregation will have more of a tendency to be a spherical structure with a higher content of Co2+ ions.


image file: c5ra04708k-s1.tif
Scheme 1 Schematic illustration of the growth processes of the polymorphic Co-doped MnCO3 microstructures.

In our synthesis, fan-like and hedgehog-like structures can also grow into the final flaked-spheres when the reaction time is prolonged to 36 h. Fig. S4a and b show the flaked microstructures for our 5% and 10% samples. Thus, it is rational to infer that Co2+ ions play a great role in accelerating the evolutionary progresses. In a word, Co2+ ion modulated reaction-limited aggregation (RLA) is vital in the growth of the Co-doped MnCO3 hierarchical microstructures.

3.3 Catalytic properties

To address the potential application of the prepared Co-doped MnCO3 microstructures in catalysis, we chose CO oxidation as a model catalytic reaction. It is reported47 that the Langmuir–Hinshelwood mechanism is generally proposed to be responsible for CO catalytic oxidation. The significant effect of manganese oxides on CO oxidation was confirmed in many other studies.48–50 The CO oxidation process can be divided into three stages: the O2 dissociative adsorption [eqn (4) and (5)] and its surface reaction with CO [eqn (6)]51
 
O2(g) + ⊕ → O2–⊕ (4)
 
O2–⊕ + ⊕ → 2O–⊕ (5)
 
CO–* + O–⊕ → CO2(g) + * + ⊕ (6)
* and ⊕ denote metal and support sites, respectively.

In general, the catalytic activity of the materials is related to their surface areas and superficial support sites. Fig. 8 shows the catalytic profiles of the pure and Co-doped manganese carbonate series. For both the pure and the Co-doped manganese carbonates, it can be obviously seen that the catalytic performance has been sharply improved in comparison with commercial manganese carbonate. As shown in Table 1 (ESI), the surface area data can be the first evidence to explain the above phenomenon because the higher the surface area, the more active sites there are for surface reaction (6).52,53 The catalytic oxidation of CO is achieved during the range of 100 to 295 °C for all of our samples. However, the P2–P6 samples with different Co2+ doping content show better catalytic activity compared with the as-prepared undoped manganese carbonate (P1). For example, the initial reaction temperature for P5 is 100 °C whereas P3 begins to react with CO at 105 °C and the P1 sample starts to react with CO at 175 °C. Furthermore, the T80 temperatures of the prepared manganese carbonates with and without Co2+ doping are as follows: 205 °C (P5) < 220 °C (P3) < 250 °C (P1). As the adsorbed phase steps (4) and (5) are reported to be the determining steps in the Langmuir–Hinshelwood mechanism, the surface area is of little importance when a number of oxygen vacancies exist.16,47 On the one hand, the oxygen vacancy theory can be used to make the above question clear. The extra oxygen vacancies are generated by the incorporation of Co2+ and Co3+ into rhombohedral MnCO3. At the same time, the additional lattice perturbation and structural stress improves O2− mobility.54,55 On the other hand, tricobalt tetraoxide is most active for CO oxidation and Co3+ is the most active site for CO oxidation, especially in the face of Co2+.56 As a result, the cobalt ions replacing the divalent Mn2+ ion in the rhombohedral MnCO3 lattice enhance the O2 dissociative adsorption (eqn (4) and (5)), further the surface reaction with CO and finally improve the catalytic performance for CO oxidation among our Co-doped samples. The enhancement would be more apparent with the increase of Co2+ content. However, the excessive increase of the Co2+ content (20%) in the DMF system leads to the decrease of the catalytic activity (P6), which indicates that an appropriate doping content is needed to produce the optimal Mn–Co carbonate solid solutions to achieve the best catalytic activity.


image file: c5ra04708k-f8.tif
Fig. 8 Conversion of CO over the as-prepared pure (P1) and Co-doped manganese carbonate (P2–P6 samples) and commercial manganese carbonate.

To explore the thermal stability of Co-doped MnCO3, the catalytic tests were performed for six cycles. The recycled catalytic profiles were represented and compared in Fig. 9, which takes the Co-doped P5 as the typical sample. Obviously, the sample retains high catalytic activity during the second to sixth run. The initial conversion temperatures are 95 degrees lower than the first run. This phenomenon can be assigned to the decomposition of organic matter in the microspheres by the high-temperature treatment in the first run, which leads to the increase of surface-active oxygen sites.48 After the catalysis, the features of the catalysts remain almost unchanged, which can be observed from the FTIR and SEM images (see Fig. S4 and S5). It is obvious that the Co-doped MnCO3 catalysts possess a desirable stability.


image file: c5ra04708k-f9.tif
Fig. 9 Catalytic performance of the obtained P5 in different runs.

4 Conclusions

In summary, a series of designed Co2+-doped manganese carbonates were obtained via a one-pot solvothermal approach. The plumpness of their three-dimensional shapes increased with the Co2+ doping content while the sizes remained consistent. In our report, the whole growth mechanism is explained as follows: (1) Mn3O4 nanoblocks were formed in the nucleation process for both the pure and the Co2+ doped system; and (2) Co2+ ion modulated reaction-limited aggregation (RLA) is vital to the growth of the Co-doped MnCO3 hierarchical microstructures. Furthermore, Co2+ ions can accelerate the rapid growth in preferential directions. With prolonged reaction times or increased Co2+ doping, perfect flaked spheres would finally be obtained. The catalytic properties of the Co-doped and undoped manganese carbonates were investigated, which demonstrates the as-prepared products are promising catalysts in CO oxidation, especially the 15% Co2+ doped manganese carbonate, which shows a high catalytic ability for CO oxidation. These results may be a primary step in understanding and designing manganese carbonates with desirable morphology and size, as well as other functional materials.

Acknowledgements

This work was supported by the Natural Science Foundation of China (grant no. 21276142 and 21476129).

References

  1. A. Sadhu, S. P. Singh and S. Bhattacharyya, Cryst. Growth Des., 2014, 14, 4060–4067 CAS.
  2. J. Resasco, N. P. Dasgupta, J. R. Rosell, J. H. Guo and P. D. Yang, J. Am. Chem. Soc., 2014, 136, 10521–10526 CrossRef CAS PubMed.
  3. Y. Zhong, L. W. Su and Z. Zhou, ACS Appl. Mater. Interfaces, 2013, 5, 11212–11217 CAS.
  4. X. P. Wu, Y. Q. Wang, S. M. Zhou, X. U. Yuan, T. Gao, K. Wang, S. Y. Lou, Y. B. Liu and X. J. Shi, Cryst. Growth Des., 2013, 13, 136–142 CAS.
  5. E. J. Kim, C. S. Lee, Y. Y. Chang and Y. S. Chang, ACS Appl. Mater. Interfaces, 2013, 5, 9628–9634 CAS.
  6. P. Leidinger, R. Popescu, D. Gerthsen and C. Feldmann, Chem. Mater., 2013, 25, 4173–4180 CrossRef CAS.
  7. L. Emdadi, Y. Wu, G. Zhu, C. C. Chang, W. Fan, T. Pham, R. F. Lobo and D. Liu, Chem. Mater., 2014, 26, 1345–1355 CrossRef CAS.
  8. L. Liu, J. Jiang and S. H. Yu, Cryst. Growth Des., 2014, 14, 6048–6056 CAS.
  9. G. Mayer, Science, 2005, 310, 1144–1147 CrossRef CAS PubMed.
  10. M. A. Meyers, J. McKittrick and P. Y. Chen, Science, 2013, 339, 773–779 CrossRef CAS PubMed.
  11. X. Wang, J. Zhuang, Q. Peng and Y. D. Li, Nature, 2005, 437, 121 CrossRef CAS PubMed.
  12. Y. C. Zhu, T. Me, Y. Wang and Y. T. Qian, J. Mater. Chem., 2011, 21, 11457 RSC.
  13. H. X. Mai, Y. W. Zhang, R. Si, Z. G. Yan, L. D. Sun, L. P. You and C. H. Yan, J. Am. Chem. Soc., 2006, 128, 6426 CrossRef CAS PubMed.
  14. N. Niu, P. P. yang, F. He, X. Zhang, S. L. Gai, C. X. Li and J. Lin, J. Mater. Chem., 2012, 22, 10889 RSC.
  15. Y. Tian, B. J. Chen, H. Q. Yu, R. N. Hua, X. P. Li, J. S. Sun, L. H. Cheng, H. Y. Zhong, J. S. Zhang, Y. F. Zheng, T. T. Yu and L. B. Huang, J. Colloid Interface Sci., 2011, 360, 586 CrossRef CAS PubMed.
  16. W. Liu, X. F. Liu, L. J. Feng, J. X. Guo, A. R. Xie, S. P. Wang, J. C. Zhang and Y. Z. Yang, Nanoscale, 2014, 6, 10693–10700 RSC.
  17. S. H. Shen, P. H. Guo, D. A. Wheeler, J. G. Jiang, S. A. Lindley, C. X. Kronawitter, J. Z. Zhang, L. J. Guo and S. S. Mao, Nanoscale, 2013, 5, 9867–9874 RSC.
  18. P. Sun, L. You, Y. F. Sun, N. K. Chen, X. B. Li, H. B. Sun, J. Ma and G. Y. Lu, CrystEngComm, 2012, 14, 1701–1708 RSC.
  19. D. G. Shchukin, A. A. Patel, G. B. Sukhorukov and Y. M. Lvov, J. Am. Chem. Soc., 2004, 126, 3374–3375 CrossRef CAS PubMed.
  20. S. Devaraj, H. Y. Liu and P. Balaya, J. Mater. Chem. A, 2014, 2, 4276–4281 CAS.
  21. I. Takahara, K. Murata, K. Sato, Y. Miura, M. Inaba and Y. Y. Liu, Appl. Catal., A, 2013, 450, 80–87 CrossRef CAS PubMed.
  22. I. Takahara, K. Murata, K. Sato, M. Inaba and Y. Y. Liu, Appl. Catal., A, 2014, 482, 205–213 CrossRef CAS PubMed.
  23. Z. Yang, X. M. Zhou, H. G. Nie, Z. Yao and S. M. Huang, ACS Appl. Mater. Interfaces, 2011, 3, 2601–2606 CAS.
  24. H. Einaga and S. J. Futamura, Catalyst, 2004, 227, 304–312 CrossRef CAS PubMed.
  25. Q. Li, L. W. Yin, Z. Q. Li, X. K. Wang, Y. X. Qi and J. Y. Ma, ACS Appl. Mater. Interfaces, 2013, 5, 10975–10984 CAS.
  26. M. M. Thackeray, C. S. Johnson, J. T. Vaughey, N. Li and S. A. Hackney, J. Mater. Chem., 2005, 15, 2257–2267 RSC.
  27. G. N. Zhang, L. Zheng, M. Zhang, S. H. Guo, Z. H. Liu, Z. P. Yang and Z. L. Wang, Energy Fuels, 2012, 26, 618–623 CrossRef CAS.
  28. H. K. Lee, D. Sakemi, R. Selyanchyn, C. G. Lee and S. W. Lee, ACS Appl. Mater. Interfaces, 2014, 6, 57–64 CAS.
  29. P. Pal, S. K. Pahari, A. K. Giri, S. Pal, H. C. Bajaj and A. B. Panda, J. Mater. Chem. A, 2013, 1, 10251–10258 CAS.
  30. S. M. Pourmortazavi, M. Rahimi-Nasrabadi, A. A. DavoudiDehaghani, A. Javidan, M. M. Zahedi and S. S. Hajimirsadeghi, Mater. Res. Bull., 2012, 47, 1045–1050 CrossRef CAS PubMed.
  31. S. Lei, X. Peng, X. Li, Z. Liang, Y. Yang, B. Cheng, Y. Xiao and L. Zhou, Mater. Chem. Phys., 2011, 125, 405–410 CrossRef CAS PubMed.
  32. J. Cao, Y. Zhu, K. Bao, L. Shi, S. Liu and Y. J. Qian, J. Phys. Chem. C, 2009, 113, 17755–17760 CAS.
  33. X. C. Duan, J. B. Lian, J. M. Ma, T. Kim and W. J. Zheng, Cryst. Growth Des., 2010, 10, 10 Search PubMed.
  34. J. M. Du, Z. M. Liu, Z. H. Li, B. X. Han, Y. Huang and J. L. Zhang, Mesoporous Mater., 2005, 83, 145 CrossRef CAS PubMed.
  35. H. Q. Cao, X. M. Wu, G. H. Wang, J. F. Yin, G. Yin, F. Zhang and J. K. Liu, J. Phys. Chem. C, 2012, 116, 21109–21115 CAS.
  36. G. B. Sukhorukov, D. G. Shchukin, W. F. Dong, H. Möhwald, V. V. Lulevich and O. I. Vinogradova, Macromol. Chem. Phys., 2004, 205, 530 CrossRef CAS.
  37. D. Q. Chen and Y. S. Wang, Nanoscale, 2013, 5, 4621 RSC.
  38. C. C. Li, X. M. Yin, T. H. Wang and H. C. Zeng, Chem. Mater., 2009, 21, 4985 Search PubMed.
  39. T. R. Bastami and M. H. Entezari, Ultrason. Sonochem., 2012, 19, 560–569 CrossRef PubMed.
  40. L. X. Yang, Y. Liang, H. Chen, Y. F. Meng and W. Jiang, Mater. Res. Bull., 2009, 44, 1753–1759 CrossRef CAS PubMed.
  41. L. Liu, X. J. Zhang, R. Y. Wang and J. Z. Liu, Superlattices Microstruct., 2014, 72, 219–229 CrossRef CAS PubMed.
  42. J. Xu, P. Gao and T. S. Zhao, Energy Environ. Sci., 2012, 5, 5333 CAS.
  43. L. Fu, Z. Liu, Y. Liu, B. Han, P. Hu, L. Cao and D. Zhu, Adv. Mater., 2005, 17, 217–221 CrossRef CAS.
  44. B. Ernst, S. Libs, P. Chaumette and A. Kiennemann, Appl. Catal., A, 1999, 186, 145–168 CrossRef CAS.
  45. M. Herrera, D. Maestre, A. Cremades and J. Piqueras, J. Phys. Chem. C, 2013, 117, 8997–9003 CAS.
  46. W. C. Zhu, G. L. Zhang, J. Li, Q. Zhang, X. L. Piao and S. L. Zhu, CrystEngComm, 2010, 12, 1795–1802 RSC.
  47. S. Royer and D. Duprez, ChemCatChem, 2011, 3, 24–65 CrossRef CAS.
  48. L. C. Hsu, M. K. Tsai, Y. H. Lu and H. T. Chen, J. Phys. Chem. C, 2013, 117, 433–441 CAS.
  49. C. Zhang, L. Han, W. Liu, H. X. Yang, X. Y. Zhang, X. F. Liu and Y. Z. Yang, CrystEngComm, 2013, 15, 5150–5155 RSC.
  50. L. C. Hsu, M. K. Tsai, Y. H. Lu and H. T. Chen, J. Phys. Chem. C, 2013, 117, 433–441 CAS.
  51. R. H. Nibbelke, M. A. J. Campman, J. H. B. J. Hoebink and G. B. Marin, J. Catal., 1997, 171, 358–378 CrossRef CAS.
  52. S. Y. Lai, Y. Qiu and S. Wang, J. Catal., 2006, 237, 303 CrossRef CAS PubMed.
  53. C. M. A. Parlett, K. Wilson and A. F. Lee, Chem. Soc. Rev., 2013, 42, 3876 RSC.
  54. T. Y. Li, G. L. Xiang, J. Zhuang and X. Wang, Chem. Commun., 2011, 47, 6060–6062 RSC.
  55. P. Fornasiero, R. D. Monte, G. R. Rao, J. Kaspar, S. Meriani, A. Trovarelli and M. Graziani, J. Catal., 1995, 151, 168 CrossRef CAS.
  56. X. W. Xie, Y. Li, Z. Liu, M. Haruta and W. Shen, Nature, 2009, 458, 746–749 CrossRef CAS PubMed.

Footnote

Electronic supplementary information (ESI) available: The surface areas, compositional data and EDS spectra of Co-doped samples; FTIR spectra of the as prepared doped and undoped MnCO3 samples; SEM images of the Co-doped P5 sample obtained at 210 °C for different solvothermal times; SEM images of the 5%, 10% Co-doped samples with a prolonged reaction time of 36 h and of the P5 samples after repeating the catalysis 6 times; FTIR spectra of the P5 sample before and after repeating the catalysis 6 times. See DOI: 10.1039/c5ra04708k

This journal is © The Royal Society of Chemistry 2015
Click here to see how this site uses Cookies. View our privacy policy here.