Solid acid-reduced graphene oxide nanohybrid for enhancing thermal stability, mechanical property and flame retardancy of polypropylene

Bihe Yuanab, Lei Song*a, Kim Meow Liewc and Yuan Hu*ab
aState Key Laboratory of Fire Science, University of Science and Technology of China, Hefei 230026, China. E-mail: yuanhu@ustc.edu.cn; leisong@ustc.edu.cn; Fax: +86-551-63601664; Tel: +86-551-63601664
bUSTC-CityU Joint Advanced Research Centre, Suzhou Key Laboratory of Urban Public Safety, Suzhou Institute for Advanced Study, University of Science and Technology of China, Suzhou 215123, China
cDepartment of Architecture and Civil Engineering, City University of Hong Kong, Tat Chee Avenue, Kowloon, Hong Kong, China

Received 17th March 2015 , Accepted 30th April 2015

First published on 1st May 2015


Abstract

Reduced graphene oxide (RGO) is functionalized with a solid acid, phosphomolybdic acid (PMoA), via electrostatic interactions. RGO and PMoA in this nanohybrid (PMoA–RGO) exhibit strong interactions and the surface characteristic of the graphene nanosheets is modified. RGO and PMoA–RGO are blended with polypropylene (PP) and maleic anhydride grafted polypropylene via a master batch-based melt mixing method. Thermal stability, mechanical and flame retardancy properties of the nanocomposites are investigated. This nanohybrid greatly improves the stiffness and thermal-oxidative stability of PP. Compared to the neat sample, the onset decomposition temperature (Tonset) and the temperature at the maximum weight loss rate (Tmax) of the nanocomposite increase by as much as 44 °C and 34 °C, respectively, at just 1 wt% loading of PMoA–RGO. Remarkable enhancements of the storage modulus in the glassy region and heat deflection temperature are obtained in PMoA–RGO/PP nanocomposites. The nanohybrid exhibits more marked reinforcing effects than the RGO. The heat release of the nanocomposites during the combustion is considerably reduced compared to neat PP. The improved thermal-oxidative stability and flame retardant properties of PP nanocomposites are mainly attributed to the barrier effect of graphene, in tandem with the enhanced radical trapping property of the nanohybrid.

1. Introduction

Graphene, which is a monolayer nanosheet consisting of sp2-bonded carbon atoms, shows excellent mechanical, thermal, optical and electronic properties.1 Graphene has attracted significant research interest in recent years, due to its outstanding physical properties. Graphene has opened a wide range of potential applications, such as lithium ion batteries, fuel cells, sensors, catalysts and polymer nanocomposites.1 Various methods, such as chemical vapor deposition, micromechanical cleavage and chemical reduction, have been reported to synthesize graphene.2 The method based on chemical or thermal reduction of graphene oxide (GO) makes large scale production of graphene possible. The reduced graphene oxide (RGO) obtained has been widely used as a reinforcing filler for polymers. Remarkable improvements in the thermal stability, mechanical properties, electrical and thermal conductivity, barrier properties and electromagnetic interference shielding performance of polymers are obtained with the incorporation of low loading graphene.2–5

Graphene, a two-dimensional nanomaterial, possesses a wrinkled nanostructure and large aspect ratio and specific surface area. These features enable graphene to be a promising substrate for the immobilization of various kinds of nanomaterials.6 Furthermore, the residual functional groups in RGO provide tight anchoring sites for these foreign nanomaterials.1 Graphene is endowed with some new functionalities via the modification. Furthermore, in the nanohybrid, synergistic effects of graphene and the anchored nanomaterials are achieved and the physical properties of graphene are greatly improved. The decoration of magnetic Fe2O3 nanoparticles on RGO nanosheets results in the significant enhancements in microwave absorption property and electromagnetic interference shielding performance of the nanohybrid.7,8 Liang et al. have reported that the Co3O4/graphene hybrid exhibits extraordinary oxygen reduction reaction catalytic activity and the synergistic coupling between these two materials is indispensable to the high activity.9

The incorporation of nanomaterials has been reported to enhance thermal stability and flame retardancy of polymers.10,11 Various nanomaterials, such as montmorillonite (MMT), layered double hydroxide, α-zirconium phosphate and carbon nanotubes, have been prepared polymer nanocomposites with enhanced thermal stability and flame retardant properties.10,12,13 The dispersion, geometry, chemical structure and surface characteristic of the nanofillers strongly affect the thermal decomposition behavior and flame retardant properties of the polymers.14 It is well documented that the acidic sites in the nanofillers are beneficial to achieve the enhancement in flame retardancy of polymer nanocomposites.14 For example, the proton acid sites formed during the thermal decomposition of alkyl ammonium in organic MMT can improve the flame retardancy of polymers.15,16 Because of its layered structure and high barrier performance, graphene has been employed to improve the flame retardant properties of polymer materials.17 However, its reinforcing efficiency is not marked.18 Therefore, it is highly desirable to modify the surface characteristic of graphene to improve its flame retardant performance in polymers.

In this work, functionalized graphene bearing acidic nanoparticles (PMoA–RGO) was prepared via the strong electrostatic interactions between RGO and phosphomolybdic acid (PMoA). RGO/polypropylene (PP) and the nanohybrid/PP nanocomposites were prepared by a master batch-based melt mixing method. The thermal stability, mechanical and flame retardant properties of neat PP and its nanocomposites were investigated. This work provides a new strategy for improving thermal-oxidative stability and flame retardant properties of polymers.

2. Experimental

2.1 Materials

Graphite powder (SP), hydrazine hydrate (85%, AR), ammonium hydroxide (25–28%, AR), PMoA hydrate (AR), ethylene glycol (AR), xylene (AR) and ethanol (AR) were purchased from Sinopharm Chemical Reagent Co., Ltd. PP (Yungsox 3015) was supplied by Formosa Plastics Polypropylene (Ningbo) Co., Ltd. Maleic anhydride grafted polypropylene (MAPP) with 0.8 wt% of maleic anhydride was kindly provided by Suzhou Enhand New Materials Co., Ltd.

2.2 Preparation of PMoA–RGO nanohybrid

Graphite oxide was prepared according to the Hummers method using graphite powder as the raw material.19 RGO was synthesized by chemical reduction of GO with hydrazine. Briefly, 4 g of graphite oxide was dispersed in 1200 mL of deionized water with continuous stirring and ultrasonication for 30 min. This dispersion was heated to 100 °C and then 8 mL of ammonium hydroxide and 8 mL of hydrazine were added to the system. After additional stirring for 1 h, the resulting product was filtered, washed with water and dried at 80 °C for 12 h. PMoA–RGO composite was prepared using the method developed by Kim et al.,20 with slight modification. 1 g of RGO was dispersed in 800 mL water containing 8 mL of ethylene glycol, by stirring and ultrasonication for 30 min. 10 g of PMoA was added to this dispersion and the system was subjected to additional stirring and ultrasonication for 10 min. The mixture was further stirred at room temperature for 12 h. The final product was collected by filtration three times using water to remove the unabsorbed PMoA, and was dried in an 80 °C oven for 12 h.

2.3 Fabrication of PP nanocomposites

PP nanocomposites were prepared by a master batch-based melt mixing method. MAPP master batch with 40 wt% PMoA–RGO was fabricated by solution blending approach. PMoA–RGO was dispersed in xylene with the assistance of continuous stirring and ultrasonication for 30 min. After heating to 120 °C, the MAPP was added to the dispersion and the mixture was maintained stirring for 5 h. Then, the product was coagulated by slowly adding the mixture to superabundant low temperature ethanol. The resulting master batch was dried at 80 °C for 24 h. Then, the master batch was diluted with PP resin to prepare composites. MAPP was used as the compatibilizer to improve PP compatibility with the nanofillers and its loading was maintained at 5 wt% in all samples. The blending was conducted in a twin roller mill at 185 °C, with a roller speed of 50 rpm and a mixing time of 12 min. The composites with 1, 2 and 3 wt% PMoA–RGO were denoted as 1 PMoA–RGO/PP, 2 PMoA–RGO/PP and 3 PMoA–RGO/PP, respectively. A control PP composite comprising 2 wt% RGO (2 RGO/PP) was prepared by the same process described above. The resultant samples were hot-pressed at 190 °C and 10 MPa to obtain sheets with suitable size.

2.4 Characterization

Fourier transform infrared (FTIR) spectra were measured with a Nicolet 6700 spectrophotometer with 16 scans and a resolution of 4 cm−1. X-ray diffraction (XRD) patterns were recorded on a Rigaku TTR-III X-ray diffractometer with Cu Kα radiation (λ = 0.1542 nm). Raman spectra were obtained from a LABRAM-HR laser confocal microRaman spectrometer equipped with a 514.5 nm laser excitation. X-ray photoelectron spectroscopy (XPS) was employed to investigate the chemical composition of the products. Thermogravimetric analysis (TGA) was performed on a TA Q5000IR thermo-analyzer with a heating rate of 20 °C min−1. Transmission electron microscopy (TEM) was used to characterize the morphology of nanomaterials and their dispersion in polymer matrix. The ultrathin slices of PP nanocomposites were obtained by cutting the samples on a Cambridge ultratome and the slices were transferred onto copper grids for TEM observation. TEM images were taken by a JEOL JEM-2100F microscope at an acceleration voltage of 200 kV. Scanning electron microscopy (SEM) images of the surface of cryogenically-fractured samples were obtained on a FEI Sirion 200 scanning electron microscope with an acceleration voltage of 5 kV. The evolution of the carbonyl based volatile products of neat PP and its nanocomposites during thermal oxidative decomposition was monitored by a PerkinElmer TGA analyzer coupled with a Fourier transform infrared (TG-IR) spectrophotometer (TL-9000). The samples were heated under the gas mixture (helium/O2 (volume ratio) = 8/2) with a heating rate of 20 °C min−1. The pyrolysis gas was continuously analyzed using the FTIR spectrometer. Crystallization and melting behavior of PP and its composites were investigated with a TA differential scanning calorimetry (DSC) Q2000 instrument. The samples were heated from 60 to 200 °C with a rate of 10 °C min−1 and held at 200 °C for 5 min to erase thermal history. Subsequently, the specimens were cooled from 200 to 60 °C, held for 5 min and then reheated over the same temperature range. The non-isothermal crystallization and melting curves of PP and its nanocomposites were recorded from the cooling and the second heating process, respectively. Both the cooling and heating rate were 10 °C min−1 and the experiments were conducted under N2 production. Thermomechanical behavior of PP and its nanocomposites were studied on a TA dynamic mechanical analysis (DMA) Q800 analyzer. A frequency of 10 Hz and a heating rate of 5 °C min−1 were employed in the temperature range of −40 to 110 °C. Heat deflection temperature (HDT) of the specimens were derived from the DMA data according to the method developed by Scobbo.21 Tensile mechanical properties of PP and its composites were measured with a MTS CMT6104 universal testing machine. Dumbbell-shaped samples were stretched at a crosshead speed of 10 mm min−1, according to ASTM D 638. Combustion tests of the samples were conducted on a FTT cone calorimeter under an incident flux of 35 kW m−2 according to ISO 5660.

3. Results and discussion

Fig. 1a shows the FTIR spectra of GO, RGO, PMoA and PMoA–RGO nanohybrid. The GO exhibits the characteristic peaks of COOH, C–O–C and C–OH at 1724, 1220 and 1048 cm−1, respectively.22 The band at 1615 cm−1 corresponds to the residual water or the vibration of aromatic rings.23,24 Because of the effective reduction by hydrazine, most of the oxygen functional groups have been removed and only a weak band at approximately 1110 cm−1, which is attributed to the stable oxygenated groups,7 is observed in the RGO spectrum. The strong bands at 1064, 964, 870 and 786 cm−1 in the FTIR spectrum of PMoA are assigned to the stretching vibrations of the P–O bond, Mo[double bond, length as m-dash]O terminal bond, vertex Mo–O–Mo bond and edge Mo–O–Mo bond,25 respectively. In the PMoA–RGO spectrum, the absorption at 1577 cm−1 is attributed to graphene skeletal vibration.7 The peaks of the residual oxygen functional groups in RGO and the characteristic vibrational peaks of PMoA overlap into a broad band at approximately 1121 cm−1. The enlarged FTIR spectra of RGO and PMoA–RGO nanohybrid over the range of 1200–400 cm−1 are presented in Fig. 1b. Compared with RGO, the peaks attributed to PMoA are observed at 905, 797 and 725 cm−1 in the nanohybrid spectrum. The shifting of these peaks is due to the presence of strong interactions between RGO and PMoA.20
image file: c5ra04699h-f1.tif
Fig. 1 (a) FTIR spectra of GO, RGO, PMoA and PMoA–RGO; (b) enlarged FTIR spectra of RGO and the nanohybrid over the range of 1200–400 cm−1.

Crystal structure of the products was investigated with XRD and their patterns are shown in Fig. 2a. The feature (002) diffraction peak of GO appears at 10.1° with an interlayer spacing of 0.876 nm. Upon reduction, a broad band at approximately 24.6° is observed in the XRD pattern of RGO, due to the removal of oxygen functional groups during the reduction reaction. The characteristic diffraction peaks of this Keggin-type polyoxometalate are absent in the PMoA–RGO pattern, suggesting the highly dispersed state of PMoA in the nanohybrid.26 Structural changes in the carbonaceous materials during the reduction and modification were monitored by Raman spectroscopy. As shown in Fig. 2b, these carbon materials display two prominent peaks at approximately 1350 and 1600 cm−1, corresponding to the D and G bands, respectively.27 The intensity ratio of the D to G band (ID/IG) reflects the size of the in-plane sp2 domain as well as the defects in graphene based materials.27,28 The D and G bands of GO are located at 1353 and 1600 cm−1, respectively, with an ID/IG value of 1.71. The ID/IG of RGO (1.76) is higher than that of GO, implying a decrease in the average size of the sp2 domain in RGO.27 The red shift of the two bands can be seen in the RGO Raman spectrum, due to the recovery of graphitic structure during the reduction.27 An increment in the ID/IG value of PMoA–RGO (1.81) indicates the increase in the structural defects during the modification process.28 Furthermore, the strong interactions between RGO and PMoA results in the blue shift of the D and G bands in the nanohybrid.29


image file: c5ra04699h-f2.tif
Fig. 2 (a) XRD patterns and (b) Raman spectra of the nanomaterials.

XPS analysis provides the information on atomic composition and the corresponding spectra are presented in Fig. 3a. The atomic ratio of C to O (C/O) of GO is 2.07. After reduction, the C/O of RGO increases to 9.31. In addition, nitrogen element is detected in the XPS survey spectrum of RGO, indicating that some nitrogen atoms from the hydrazine have been incorporated into the graphene structure during the reduction reaction.30 The XPS spectrum of PMoA–RGO reveals the presence of Mo element in the nanohybrid. However, no marked P 2p peak is detected in this XPS spectrum because the P atoms are surrounded by the Mo atoms in this polyoxometalate.26 Furthermore, the low sampling depth of XPS technique also results in the appearance of this phenomenon. Because of nitrogen doping in the RGO, this electron-rich material is believed to exhibit the feature of Lewis base.31 Thus, the strong electrostatic interactions between RGO and the Bronsted acid of PMoA result in the immobilization of the polyoxometalate on the nanosheets. High-resolution N 1s XPS spectra of RGO and PMoA–RGO are displayed in Fig. 3b. Compared with RGO spectrum, the nitrogen peak in the nanohybrid is broadened and shifted to lower binding energy, confirming the presence of strong interactions between these two nanomaterials.32 TGA curves of the products under N2 atmosphere are plotted in Fig. 3c. Weight loss of GO below 150 °C is mainly attributed to the evaporation of moisture.22 The main decomposition occurs between 150 and 240 °C, primarily due to the removal of thermally labile oxygen functional groups in GO.22 RGO exhibits higher thermal stability than that of GO. The evaporation of crystal water in PMoA results in the weight loss stage around 110 °C.33 The nanohybrid displays similar thermal decomposition behavior to RGO, but its thermal stability is poorer.


image file: c5ra04699h-f3.tif
Fig. 3 (a) XPS survey spectra of GO, RGO and PMoA–RGO; (b) high-resolution N 1s XPS spectra of RGO and PMoA–RGO; (c) TGA curves of the nanomaterials.

The morphology of the nanomaterials was revealed by TEM (Fig. 4). The TEM images of GO (Fig. 4a) and RGO (Fig. 4b) present silk-like nanostructure with very thin feature. On the basis of the TEM image of PMoA–RGO (Fig. 4c), it is apparent that small black dots of PMoA are homogeneously decorated on the RGO nanosheets.


image file: c5ra04699h-f4.tif
Fig. 4 TEM micrographs of (a) GO, (b) RGO and (c) PMoA–RGO.

SEM images of the freeze-fractured surface of 2 RGO/PP and 2 PMoA–RGO/PP are shown in Fig. 5a and b, respectively. No large agglomerates are visible in the SEM images. As marked by blue arrows, these graphene based nanomaterials are homogeneously dispersed in the matrix. It can be concluded that good dispersion of graphene is achieved at micrometer scale. TEM was employed to reveal the morphology of the nanomaterials in the composites. Both 2 RGO/PP (Fig. 5c) and 2 PMoA–RGO/PP (Fig. 5d) exhibit intercalation and exfoliation microstructures. In general, the dispersion of these nanomaterials in the PP matrix is good, owing to the two-step mixing method in this work.


image file: c5ra04699h-f5.tif
Fig. 5 SEM images of the fractured surface of (a) 2 RGO/PP and (b) 2 PMoA–RGO/PP; TEM images of the ultrathin slices of (c) 2 RGO/PP and (d) 2 PMoA–RGO/PP.

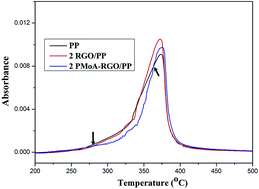
Thermal stability of PP and its nanocomposites were studied with TGA under N2 and air atmosphere. The TGA and differential thermogravimetric (DTG) curves are shown in Fig. 6 and the relevant data are summarized in Table 1. The onset decomposition temperature (Tonset) was determined by the tangent method34 and the temperature at maximum weight loss rate (Tmax) was obtained from the DTG plots. PP and its nanocomposites exhibit one-step degradation behavior under N2 and air atmosphere. As shown in Fig. 6, no marked enhancements in thermal stability under N2 atmosphere are achieved in PP nanocomposites. For example, in comparison to neat PP, the incorporation of 2 wt% PMoA–RGO only results in 4 °C and 3 °C increases in Tonset and Tmax, respectively. However, the thermal-oxidative stability of the PP nanocomposites is significantly improved. The enhancements in Tonset and Tmax reach 44 °C and 34 °C, respectively, in the PP nanocomposite only comprising 1 wt% PMoA–RGO. Up to 60 °C and 53 °C improvements in Tonset and Tmax of PP, respectively, are achieved with 3 wt% PMoA–RGO. Furthermore, PMoA–RGO exhibits higher improvement in thermal-oxidative stability of PP than RGO. The well-dispersed graphene nanosheets act as mass transport barrier to O2 and the decomposed volatile products of polymers.35,36 It has been reported that the radical scavenging function and barrier effect of graphene is responsible for the enhanced thermal-oxidation stability of PP.37 PMoA, a kind of heteropolyacid, possesses a well-defined nanostructure, multiple redox and electron sponge properties.20,38 It has been previously reported that this kind of heteropolyacid acts as an inhibitor for radical polymerization.39 Thus, these features of PMoA may improve the radical-trapping property of graphene, resulting in higher thermal-oxidative stability of PMoA–RGO based PP nanocomposites. It has been reported that the thermal decomposition of PP is based on radical-initiated chain scission mechanism and the decomposition can be accelerated by the peroxy radicals.40 Thus, the peroxy radicals play an important role in the oxidative thermal decomposition of PP. According to a prior study, the peroxy radical concentration was monitored by the intensity change of the carbonyl bands at 1728 cm−1 using TG-IR technique.37 Fig. 7 shows the intensity curves of the carbonyl bands for neat PP, 2 RGO/PP and 2 PMoA–RGO/PP. The intensity of the carbonyl bands of 2 RGO/PP is slightly lower than that of neat PP below 320 °C, indicating that the enhanced stability of 2 RGO/PP in this work is mainly attributed to the barrier effect of graphene. It is apparent that the carbonyl band intensity of 2 RGO/PP is higher than that of neat polymer at higher temperature. This phenomenon agrees well with the results reported in the prior literature.37 As indicated by the arrows in Fig. 7, in the temperature range of 270–360 °C, the carbonyl band intensity of 2 PMoA–RGO/PP is lower than those of neat PP and 2 RGO/PP, indicating the lower peroxy radicals concentration in 2 PMoA–RGO/PP. Furthermore, the peak intensity of 2 PMoA–RGO/PP is lower than that of 2 RGO/PP. Considering the dispersion state of the nanomaterials (Fig. 5), it can be confirmed that the PMoA is responsible to the enhanced radical-trapping ability of the nanohybrid, resulting in the higher thermal-oxidative stability of its PP nanocomposites.


image file: c5ra04699h-f6.tif
Fig. 6 TGA and DTG curves of PP and its nanocomposites under N2 and air atmosphere.
Table 1 TGA and cone calorimeter data of PP and its nanocomposites
Sample Tonset (°C) Tmax (°C) TTI (s) PHRR (kW m−2) THR (MJ m−2)
N2 Air N2 Air
PP 446 286 471 333 32 909 45.8
2 RGO/PP 450 315 473 362 28 778 40.0
1 PMoA–RGO/PP 448 330 471 367 27 773 39.6
2 PMoA–RGO/PP 450 334 474 373 23 737 38.4
3 PMoA–RGO/PP 448 346 472 386 25 700 38.4


image file: c5ra04699h-f7.tif
Fig. 7 Intensity of the carbonyl bands versus temperature curves for neat PP, 2 RGO/PP and 2 PMoA–RGO/PP obtained from TG-IR.

Mechanical performance of semicrystalline polymers, such as polyethylene and PP, is greatly affected by their crystal structure and degree of crystallinity.41 XRD and DSC were employed to evaluate the effects of the nanofillers on crystalline structure, crystallization and melting behavior of neat PP and its nanocomposites. The XRD patterns and DSC curves are presented in Fig. S1 and S2, respectively, and the relevant DSC data are summarized in Table S1. From Fig. S1, α-form crystal is observed in the XRD patterns of PP and its nanocomposites. As shown in Fig. S2 and Table S1, the nanofillers, including RGO and its hybrid exert little influence on the crystallization and melting behavior of PP. Furthermore, enhancement in nanocomposites crystallinity is not apparent in this work.

Fig. 8a presents the storage modulus (E′) versus temperature curves of neat PP and its nanocomposites and Table 2 lists the mechanical tests data. The E′ of PMoA–RGO/PP increases with increasing the loading of this nanohybrid. Compared to neat PP, with the incorporation of 3 wt% PMoA–RGO, the E′ at −40 °C increases from 3074 to 3810 MPa, corresponding to a modulus enhancement of 24%. The mobility of polymer chains is reduced by this high intrinsic stiffness nanomaterial, resulting in the improved E′.42 From Fig. 8a and Table 2, it is apparent that the enhancing effect of the nanohybrid is more prominent than that of RGO. This may be attributed to the relatively stronger interfacial interactions in PMoA–RGO/PP nanocomposites. Few oxygen functional groups remained in the RGO nanosheets. However, the PMoA in the nanohybrid is expected to possess strong interactions with maleic anhydride groups in MAPP. The logarithm of Eversus temperature plots are shown in Fig. 8b. HDT was determined as the temperature corresponding to log[thin space (1/6-em)]E′ of 8.9.21 An increase in HDT of PP composites is obtained as compared to the neat PP. For example, the HDT increases from 69 to 84 °C as the nanohybrid content increases from 0 to 3 wt%. It is evident that the HDT of 2 PMoA–RGO/PP (80 °C) is higher than that of RGO/PP nanocomposite (74 °C) with the same content of the nanofillers. Fig. 9 shows the representative stress–strain curves of PP and its nanocomposites and the detailed data, including tensile strength (σ) and elongation at break (εB) are listed in Table 2. Relative to neat PP, the σ of 2 PMoA–RGO/PP increases from 23.5 to 28.9 MPa. The addition of RGO or its nanohybrid results in a decrease in εB, which is a common phenomenon in polymer nanocomposites. The reinforcing effect of these nanomaterials on the mechanical strength of PP is not very marked.


image file: c5ra04699h-f8.tif
Fig. 8 (a) E′ and (b) logarithm of Eversus temperature curves of PP and its nanocomposites.
Table 2 Thermomechanical and mechanical properties of PP and its nanocomposites
Sample E′ at −40 °C (MPa) HDT (°C) σ (MPa) εB (%)
PP 3074 69 23.5 ± 1.1 210 ± 18
2 RGO/PP 3314 74 27.6 ± 0.8 150 ± 15
1 PMoA–RGO/PP 3503 75 25.9 ± 0.5 191 ± 10
2 PMoA–RGO/PP 3704 80 28.9 ± 0.8 143 ± 14
3 PMoA–RGO/PP 3810 84 28.8 ± 0.6 149 ± 10


image file: c5ra04699h-f9.tif
Fig. 9 Representative stress–strain curves of PP and its nanocomposites.

Heat release rate (HRR) curves of PP and its nanocomposites during the combustion in cone calorimeter are presented in Fig. 10. The parameters including time to ignition (TTI), peak heat release rate (PHRR) and total heat release (THR), are recorded in Table 1. The TTI values of these nanocomposite decrease compared to that of neat sample, due to the enhanced heat absorption within the samples surface layer by these nanofillers.43 From Fig. 10 and Table 1, it can be seen that a decrease in PHRR is achieved in the nanocomposites. For example, compared with neat sample, a 23% reduction in PHRR is obtained in 3 PMoA–RGO/PP. Furthermore, the nanohybrid exhibits more marked flame retardant properties than RGO. The datum of THR reflects the combustion degree of polymers. When 3 wt% PMoA–RGO is incorporated into the PP matrix, the THR decreases from 45.8 to 38.4 MJ m−2, implying part of the polymer was shielded from combustion by this nanomaterial.


image file: c5ra04699h-f10.tif
Fig. 10 (a) HRR and (b) THR curves of PP and its nanocomposites.

Raman spectroscopy was used to investigate the graphitization degree of the char after the combustion in cone calorimeter. As with Fig. 2b, Raman spectra (Fig. 11) of the char of 2 RGO/PP and 2 PMoA–RGO/PP also displays the D and G bands, due to the presence of graphitic product in the char. The value of ID/IG is also an indicator for the graphitization degree. The lower ID/IG corresponds to higher graphitization degree of the final char. The ID/IG of 2 PMoA–RGO/PP (1.32) is less than that of 2 RGO/PP (1.62), indicating higher graphitization degree of the former char. The residual char with higher graphitization degree shows higher stability to thermal oxidation and better protection performance.44 The peaks at 794, 846 and 879 cm−1 in Fig. 11b are assigned to a mixture of α- and β-MoO3.45,46


image file: c5ra04699h-f11.tif
Fig. 11 Raman spectra of the char of (a) 2 RGO/PP and (b) 2 PMoA–RGO/PP.

4. Conclusions

PMoA, a kind of solid acid, was utilized to functionalize RGO and modify its surface characteristic. The PMoA and RGO showed strong interactions via the electrostatic attraction. The RGO/PP and PMoA–RGO/PP nanocomposites were successfully prepared by a master batch-based melt mixing strategy. Relatively good dispersion of these nanofillers in PP matrix was achieved. The nanocomposites showed enhancements in thermal-oxidative stability, stiffness and flame retardant properties. 44 °C and 34 °C improvement in Tonset and Tmax, respectively, were obtained in the nanocomposite with the loading as low as 1 wt% nanohybrid. The E′ at −40 °C and HDT of the PP nanocomposite comprising 3 wt% PMoA–RGO increased by 24% and 15 °C, respectively, compared to neat sample. The incorporation of these nanomaterials could improve the mechanical properties of PP. These nanocomposites, especially the nanohybrid-containing samples, showed enhanced flame retardancy. The marked reduction in PHRR and THR were observed in the PMoA–RGO based nanocomposites. The enhancement in flame retardancy of the nanohybrid/PP nanocomposites is mainly attributed to the barrier effect of graphene nanosheets and the enhanced radical scavenging ability of graphene by this heteropolyacid. This work will pave a new path for improving the flame retardancy of graphene/polymer nanocomposites.

Acknowledgements

The authors acknowledge the research grants from the National Basic Research Program of China (973 Program) (Grant no. 2014CB931804), the Natural Science Foundation of Jiangsu Province (Grant no. BK20130369) and the Research Grants Council of the Hong Kong Special Administrative Region, China (Grant no. 9042047, CityU 11208914).

References

  1. V. Singh, D. Joung, L. Zhai, S. Das, S. I. Khondaker and S. Seal, Prog. Mater. Sci., 2011, 56, 1178 CrossRef CAS PubMed.
  2. H. Kim, A. A. Abdala and C. W. Macosko, Macromolecules, 2010, 43, 6515 CrossRef CAS.
  3. H. B. Zhang, W. G. Zheng, Q. Yan, Z. G. Jiang and Z. Z. Yu, Carbon, 2012, 50, 5117 CrossRef CAS PubMed.
  4. C. Shuai, P. Feng, C. Gao, X. Shuai, T. Xiao and S. Peng, RSC Adv., 2015, 5, 25416 RSC.
  5. Y. Li, X. Pei, B. Shen, W. Zhai, L. Zhang and W. Zheng, RSC Adv., 2015, 5, 24342 RSC.
  6. N. Li, M. Cao and C. Hu, Nanoscale, 2012, 4, 6205 RSC.
  7. B. Yuan, C. Bao, X. Qian, L. Song, Q. Tai, K. M. Liew and Y. Hu, Carbon, 2014, 75, 178 CrossRef CAS PubMed.
  8. H. Zhang, A. Xie, C. Wang, H. Wang, Y. Shen and X. Tian, J. Mater. Chem. A, 2013, 1, 8547 CAS.
  9. Y. Liang, Y. Li, H. Wang, J. Zhou, J. Wang, T. Regier and H. Dai, Nat. Mater., 2011, 10, 780 CrossRef CAS PubMed.
  10. H. D. Lu, L. Song and Y. A. Hu, Polym. Adv. Technol., 2011, 22, 379 CrossRef CAS PubMed.
  11. A. P. Patiño-Soto, S. Sanchez-Valdes and L. F. Ramos-deValle, J. Polym. Sci., Part B: Polym. Phys., 2008, 46, 190 CrossRef PubMed.
  12. K. Chrissafis and D. Bikiaris, Thermochim. Acta, 2011, 523, 1 CrossRef CAS PubMed.
  13. D. Bikiaris, Thermochim. Acta, 2011, 523, 25 CrossRef CAS PubMed.
  14. F. Laoutid, L. Bonnaud, M. Alexandre, J. M. Lopez-Cuesta and P. Dubois, Mater. Sci. Eng., R, 2009, 63, 100 CrossRef PubMed.
  15. Z. Wang, X. Du, H. Yu, Z. Jiang, J. Liu and T. Tang, Polymer, 2009, 50, 5794 CrossRef CAS PubMed.
  16. R. Song, Z. Jiang, W. Bi, W. Cheng, J. Lu, B. Huang and T. Tang, Chem.–Eur. J., 2007, 13, 3234 CrossRef CAS PubMed.
  17. J. H. Zhu, M. J. Chen, Q. L. He, L. Shao, S. Y. Wei and Z. H. Guo, RSC Adv., 2013, 3, 22790 RSC.
  18. N. N. Hong, L. Song, T. R. Hull, A. A. Stec, B. B. Wang, Y. Pan and Y. Hu, Mater. Chem. Phys., 2013, 142, 531 CrossRef CAS PubMed.
  19. W. S. Hummers and R. E. Offeman, J. Am. Chem. Soc., 1958, 80, 1339 CrossRef CAS.
  20. Y. Kim and S. Shanmugam, ACS Appl. Mater. Interfaces, 2013, 5, 12197 CAS.
  21. C. G. Martins, N. M. Larocca, D. R. Paul and L. A. Pessan, Polymer, 2009, 50, 1743 CrossRef CAS PubMed.
  22. B. H. Yuan, C. L. Bao, L. Song, N. N. Hong, K. M. Liew and Y. Hu, Chem. Eng. J., 2014, 237, 411 CrossRef CAS PubMed.
  23. D. Chen, L. Li and L. Guo, Nanotechnology, 2011, 22, 325601 CrossRef PubMed.
  24. H. L. Guo, X. F. Wang, Q. Y. Qian, F. B. Wang and X. H. Xia, ACS Nano, 2009, 3, 2653 CrossRef CAS PubMed.
  25. Z. Cui, C. X. Guo, W. Yuan and C. M. Li, Phys. Chem. Chem. Phys., 2012, 14, 12823 RSC.
  26. K. Liu, T. Chen, Z. Hou, Y. Wang and L. Dai, Catal. Lett., 2013, 144, 314 CrossRef.
  27. J. Li, G. Xiao, C. Chen, R. Li and D. Yan, J. Mater. Chem. A, 2013, 1, 1481 CAS.
  28. S. Yang, W. Yue, D. Huang, C. Chen, H. Lin and X. Yang, RSC Adv., 2012, 2, 8827 RSC.
  29. J. Gao, M. Hu, Y. Dong and R. K. Y. Li, ACS Appl. Mater. Interfaces, 2013, 5, 7758 CAS.
  30. S. Stankovich, D. A. Dikin, R. D. Piner, K. A. Kohlhaas, A. Kleinhammes, Y. Jia, Y. Wu, S. T. Nguyen and R. S. Ruoff, Carbon, 2007, 45, 1558 CrossRef CAS PubMed.
  31. J. P. S. Sousa, M. F. R. Pereira and J. L. Figueiredo, Catal. Today, 2011, 176, 383 CrossRef CAS PubMed.
  32. Q. Su, S. Pang, V. Alijani, C. Li, X. Feng and K. Müllen, Adv. Mater., 2009, 21, 3191 CrossRef CAS PubMed.
  33. G. A. Tsigdinos, Ind. Eng. Chem. Prod. Res. Dev., 1974, 13, 267 CAS.
  34. L. Chancelier, A. O. Diallo, C. C. Santini, G. Marlair, T. Gutel, S. Mailley and C. Len, Phys. Chem. Chem. Phys., 2014, 16, 1967 RSC.
  35. S. Liu, H. Q. Yan, Z. P. Fang and H. Wang, Compos. Sci. Technol., 2014, 90, 40 CrossRef CAS PubMed.
  36. C. L. Bao, L. Song, W. Y. Xing, B. H. Yuan, C. A. Wilkie, J. L. Huang, Y. Q. Guo and Y. Hu, J. Mater. Chem., 2012, 22, 6088 RSC.
  37. J. Yang, Y. Huang, Y. Lv, P. Zhao, Q. Yang and G. Li, J. Mater. Chem. A, 2013, 1, 11184 CAS.
  38. K. Kume, N. Kawasaki, H. Wang, T. Yamada, H. Yoshikawa and K. Awaga, J. Mater. Chem. A, 2014, 2, 3801 CAS.
  39. V. V. Khakhinov, D. M. Mognonov, L. V. Tumurova, L. U. Bazaron and M. V. Mokhosoev, J. Therm. Anal., 1988, 34, 99 CrossRef CAS.
  40. X. Wen, Y. Wang, J. Gong, J. Liu, N. Tian, Y. Wang, Z. Jiang, J. Qiu and T. Tang, Polym. Degrad. Stab., 2012, 97, 793 CrossRef CAS PubMed.
  41. H. Kim, S. Kobayashi, M. A. AbdurRahim, M. J. Zhang, A. Khusainova, M. A. Hillmyer, A. A. Abdala and C. W. Macosko, Polymer, 2011, 52, 1837 CrossRef CAS PubMed.
  42. S. Vadukumpully, J. Paul, N. Mahanta and S. Valiyaveettil, Carbon, 2011, 49, 198 CrossRef CAS PubMed.
  43. B. Dittrich, K. A. Wartig, D. Hofmann, R. Mulhaupt and B. Schartel, Polym. Adv. Technol., 2013, 24, 916 CrossRef CAS PubMed.
  44. H. Y. Ma, L. F. Tong, Z. B. Xu and Z. P. Fang, Nanotechnology, 2007, 18, 8 Search PubMed.
  45. E. Haro-Poniatowski, M. Jouanne, J. F. Morhange, C. Julien, R. Diamant, M. Fernandez-Guasti, G. A. Fuentes and J. C. Alonso, Appl. Surf. Sci., 1998, 127, 674 CrossRef.
  46. C. RocchiccioliDeltcheff, A. Aouissi, M. Bettahar, S. Launay and M. Fournier, J. Catal., 1996, 164, 16 CrossRef CAS.

Footnote

Electronic supplementary information (ESI) available. See DOI: 10.1039/c5ra04699h

This journal is © The Royal Society of Chemistry 2015
Click here to see how this site uses Cookies. View our privacy policy here.