MFC with vermicompost soil: power generation with additional importance of waste management

Arpita Nandy, Vikash Kumar, Moumita Khamrai and Patit P. Kundu*
Department of Polymer Science and Technology, University of Calcutta, 92, A.P.C Road, Kolkata-700009, India. E-mail: ppk923@yahoo.com; Fax: +91-2352-5106; Tel: +91-2352-5106

Received 15th January 2015 , Accepted 15th April 2015

First published on 16th April 2015


Abstract

In the present study, vermicomposted soil has been analyzed as a substrate feed in a microbial fuel cell (MFC) for harvesting bioenergy. The results have shown that composting aided in providing a better environment with available organic matter and enriched microbial population. A maximum 66% COD removal with a highest power density of 4 mW m−2 has been observed from a MFC with vermicomposted soil. In comparison, a maximum power density of 134.44 μW m−2 with 31% COD removal has been observed for a MFC with non-vermicomposted (control) soil. The differences were mainly due to the predominant microbial species and organic matter additionally available in vermicomposted soil. In cyclic voltammetric analysis, the microbes present in the vermicomposted soil were found to be electrogenic. Electrochemical Impedence Spectroscopy (EIS) analysis allowed the evaluation of the internal resistance of the single chambered cell. Scanning electron microscopy (SEM) images revealed microbial association with the process, whilst energy-dispersive X-ray spectroscopy (EDS) analysis provided results for the elemental analysis of both kinds of soil.

1. Introduction

Bioenergy generation through waste treatment is attracting much attention in society because of increased energy needs and problems in waste disposal. Energy extraction from renewable sources can solve the increasing energy crisis as well as bringing hope to combat the alarming issue of environmental pollution.1 Vermicomposting is an appropriate cost effective and efficient recycling technique for the disposal of non-toxic solid and liquid organic wastes. The microbial fuel cell technique is yet another unique technique which combines waste treatment with power generation. In vermicomposting, earthworms, whose natural habitat is soil, decay the available organic materials in the soil. Casts are passed out as a result of organic matter digestion by the earthworms. These casts have large amounts of calcium, magnesium, nitrogen, phosphorus and potassium in bioavailable form and also have wide microbial diversity.2 Microbe-enriched soil, which is a potential source of available nutrients for microbial viability and proliferation, makes a good substrate for use in MFCs. The basic principle of a MFC is the production of power through the oxidation of substrates, catalyzed by microbes. Microbes oxidize organic matter at the anode, reducing a terminal electron acceptor (e.g. oxygen) at the cathode. The cathode and anode chambers are separated by a membrane and the electrons produced by the reaction flow through an external circuit. Charge balance is maintained by ionic transfer through the membrane, completing the reaction. In place of a conventional dual-chambered MFC, various modifications have been made in MFC design to enhance cell performance and give better operation. MFC architecture has evolved from dual chambered MFCs (consisting of a cathode with liquid) to different designs of single-chambered MFC (with an air cathode),3–5 like horizontal flow,6 tubular,7 flat plate,8 and cassette type MFCs.9

Vermicomposting is a non-thermophilic, biooxidative process involving earthworms and associated microbes. Vermicompost soil is finely divided, highly porous, rich in nutrients and diverse in microbial population.10–13 Owing to their importance in agriculture, earthworms are known as a “Farmer’s friend”. They increase the available organic matter in soil for microbial degradation by breaking down large soil particles and leaf litter. These waste materials are then converted to valuable vermicompost with the help of available aerobic and anaerobic microbes.10,14 Earthworms contain a wide variety of microorganisms, enzyme and hormones in their intestines. The soil organic matter turns into a fine powder after passing through the gizzard of the earthworms. This is further acted upon by intestinal microbes and enzymes and finally comes out as a “cast”. These “casts” are further treated by gut-associated microbes to complete the process of vermicomposting.10,15 Earthworms contain different decomposing microbes in their guts, along with other microbes. They are excreted with other nutrients in the cast. Microbial enrichment and improvement in microbial activity is stimulated by better nutritive and aeration properties of soil.10,16 Vermicompost soil can be a very good substrate for microbial populations because of its biological and physicochemical properties. It contains a wide variety of microbes and different nutrients available under ambient conditions required for growth and activity of microbes; both are required for augmenting the electrochemical activity.

When we combine vermicompost with a microbial fuel cell, waste treatment becomes an important aspect, besides power production. This forms a kind of two-tier waste treatment, as both processes eliminate biowaste from the waste stream and reduce contamination. The process can be very useful for resolving socioeconomic issues, as various wastes like agricultural, municipal, domestic and industrial wastewater can be treated through it, reducing the cost of other mechanical treatments. Additionally, it harnesses the available renewable bioenergy for the future. The field of MFCs is becoming wider as the technology has started to get implemented in real life. MFCs are now used for quick determination of assimilable organic carbon in sea water17 as well as in powering electronic devices, like mobile phones.18 These facts encourage the possibility that a vermicompost MFC can find its practical implementation in providing energy for real applications in the near future, opening up more space in the biochemical domain. Vermicompost soil has a pronounced effect on agriculture but it can now be used as a promising power generating device, besides being a cost effective waste management tool when operated in combination with a MFC.

2. Experimental section

2.1. Construction of the MFCs

Identical cylindrical single chambered fuel cells were constructed using Plexiglass. A total of three sets were operated at a time as replicates and each set contained two chambers (control and experimental). The chambers were first autoclaved, followed by assembling them with a proton exchange membrane (Nafion 117, Dupont Co. USA) by fitting it on one side of the flat surface of the chambers with the help of a rubber gasket and silicon adhesive. Both the electrodes were prepared using carbon cloth with a macro surface area of 9 cm2. The volume of the anode chamber was maintained at 50 mL. Aluminium mesh was used along the inner periphery of the anode chamber and the soil sample was added inside it. The protruding end of this mesh, which was tightly pressed against the carbon cloth electrode, was used as the current collector for the anode. An aluminium sheet was used as the current collector on the cathode side. The sheet was cut in a rectangular shape, having a uniform width of 0.5 cm with one elongated end. This extended end was used for association with a multimeter [Scheme 1]. The details of the membrane electrode assembly (MEA) fabrication are described in the section below.
image file: c5ra00870k-s1.tif
Scheme 1 Photograph of single chamber air cathode MFC. (A): frontal view; (B): rear view.

2.2. Fabrication of the MEAs

For the fabrication of the MEA for the MFCs, pieces of carbon cloth were cut into 3 cm × 3 cm pieces, which were used as the electrodes. 10 wt% loading of platinum on carbon black (Sigma-Aldrich) was used as a microfilm electrode between the carbon cloth and the PEM. A suspension was prepared by mixing the catalyst with de-ionized (DI) water and Nafion solution (5% solution, M/S Anabond Sainergy Fuel Cell India Pvt. Ltd.) in a ratio of 1[thin space (1/6-em)]:[thin space (1/6-em)]3[thin space (1/6-em)]:[thin space (1/6-em)]1 (ref. 19) followed by suspension in isopropanol, and sonication for about 20 minutes.20 The sonicated mixture was painted on the face of the electrode that would come into direct contact with the membrane. The painted electrodes, with a platinum loading of 6 mg cm−2, were then dried.

Separately, before assembling them with the electrodes the Nafion 117 membranes were pretreated following a series of processes to remove organic and ionic impurities. 2 to 3 drops of Nafion solution were diluted with a few drops of DI water and applied on both sides of the Nafion 117 membrane with a paint brush. The final assembly was made by placing the membrane in the middle of two electrodes and hot pressing the assembly at 120 °C–140 °C for 20–30 seconds at 6.89 MPa pressure.21

2.3. Vermicomposting and inoculation in the MFC

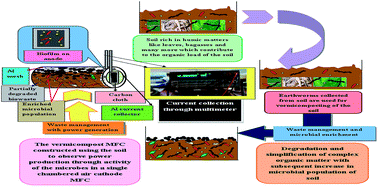
Vermicomposting was carried out on laboratory scale as follows: soil and ten–twelve matured healthy earthworms were collected from the garden of the University of Calcutta where plenty of organic matter was present. A plastic bin of appropriate size in which worm bedding was prepared was taken for the purpose of vermicomposting. A piece of cardboard was placed as the base of the bed and above this, soil with different organic matter, like sugarcane bagasse, decomposed leaves, etc., was added to the bin. The soil was moistened with water. The earthworms were then added on the surface of the soil and the surface was loosely covered with an opaque lid without reducing the oxygen supply to the earthworms. The earthworms soon migrated to the inner layer of soil and the formation of “casts” started within 24–48 hours [Scheme 2]. Another set of soil was kept under the same conditions without any earthworms, which was used as a control. The bin was kept in an undisturbed condition for about one month with regular moistening of the soil. The casts were collected from the bin and used to fill the entire anode volume of 50 cm3 through the sampling port. The soil with casts was briefly moistened before starting the operation.
image file: c5ra00870k-s2.tif
Scheme 2 Photograph of vermicompost soil with casts formed by the earthworms.

2.4. Microbial profiling of the vermicompost MFC

Identification of the different distinguished predominant species of microbes engaged in the electrical conversion of biowaste is very much relevant to the experiment. During the course of the MFC operation, a soil sample from the MFC chamber was taken out, serially diluted and different colonies were isolated using the streak plate method. Different colonies were selected and further grown individually in liquid media. The total genomic DNA of each type of bacterium was isolated by using a standard DNA isolation protocol (phenol–chloroform extraction). The 16 s rRNA gene fragment was amplified using standard PCR techniques with a pair of universal primers mentioned herewith: Y1F (40th) 5′-TGGCTCAGAACGAACGCGGCGGC-3′ and Y2R (337th) 5′-CCCACTGCTGCCTCCCGTAGGAGT-3′.22 The amplified product was sequenced and BLAST results identified three individual bacteria dominant in the MFC environment. The obtained sequences were submitted to the European Nucleotide Archive (ENA).

2.5. Calculation and analyses

Both the control and experimental MFCs were set up in the same manner. After the addition of soil in the respective chambers, they were left un-operated on the first day to allow acclimation with the environment. The potential of the cells was measured using a multimeter (Keithley Instrument Inc., Cleveland, OH, USA). The current was calculated using the relationship I = V/R, where I is the current generated by an applied potential (V) measured at a certain resistance (R). A set of different resistors, ranging from 1 MΩ to 1 Ω was used to obtain the polarization curve and determine the maximum power output. An average of 10 min to 20 min was required, depending on the resistance employed, to obtain a stable voltage output. At the stable voltage, at least three data measurements were collected for each resistance. Average values were used for calculating the power, using the formula P = IV, and it was represented as power density which is power normalized to the projected surface area of the anode.23

The chemical oxygen demand (COD) was measured at 420 nm using a standard method in which commercially available premeasured reagents were used [Supplied by Anatech Labs India Pvt. Ltd, India]. The measurements were carried out in triplicate.

2.6. Cyclic voltammetry (CV)

CV analysis is a useful technique to ascertain the electrochemical activity of the microorganisms present in the anode of the MFCs. In the experiment, a classic three electrode system was employed for the analysis, where platinum was used as the working electrode, Ag/AgCl as the reference electrode and platinum wire as the counter electrode. CV was carried out for the bacterial population isolated from the soil sample. A different population of microbes was grown together in liquid media in a laboratory environment so that they function as a consortium. CV was performed using Pt as both the working and counter electrodes, and Ag/AgCl as the reference electrode. All the electrodes were inserted in the Bob’s Cell associated with the Gamry Potentiostat-600 instrument, avoiding contact between the electrodes. The scan limit for the CV experiment was kept between −1 V to +500 mV, using a scan rate of 10 mV s−1. All the data were logged on a personal computer connected with the potentiostat.

2.7. Scanning electron microscopy and EDS analysis of soil

Scanning electron microscopy (SEM) provides essential information on the participation of the microbes in the process of electricity production from vermicompost soil. For studying the microbial interaction with the electrode in the MFC, the electrode material from the anode compartment was taken out and cut into small sections after the MFC operation. It was pretreated for better visibility of the bacterial morphology and association. The sample was immersed in 2.5% glutaraldehyde and 0.1 M phosphate buffer solution followed by dehydration with ethanol in increasing concentrations from 30 to 100%.24 The samples were then dried, followed by sputter-coating with a thin layer of gold under vacuum to neutralize the charging effects. The morphology was observed under a scanning electron microscope (Carl Zeiss EVO® 18 electron microscope), using an acceleration voltage of 15 kV and appropriate magnification. Additionally, for a better understanding of the enrichment in the vermicompost soil, a small amount of soil was taken out from the anodes of both the control and experimental MFC, diluted and the existing microbes were grown separately in bacterial media. At an early stage of growth, a loopful of culture from each set was taken out and fixed on a glass slide for SEM observation.

EDS analysis of both the control and experimental soil was carried out for their complete elemental analysis. A sample was collected from both the chambers and mounted on small sections of aluminium stub and left for overnight drying. Elemental analysis was carried out with an INCA Energy 250 and HKL Advanced EBSD system associated with a FESEM machine (JEOL JSM 7600F).

2.8. Electrochemical impedance spectroscopy (EIS)

EIS was performed for the experimental MFCs at the stable voltage generation stage. The frequency range and amplitude of the applied ac signal were 103 kHz to 1 mHz and 10 mV, respectively. The Nyquist plots were analyzed to determine the resistance of the cell. A Gamry Potentiostat-600 instrument (USA) was used for performing the experiments and calculating the internal resistance of the whole cell (Rin).25

3. Results and discussion

3.1. Electricity production with COD removal

The cell voltage for both the control and experimental MFCs was monitored every 24 hours. Fig. 1 shows the voltage generation profile of both the cells in a 10 day time frame. Both cells have shown a steady increase in voltage within 48 hours with the experimental cell performing better than the control. Maximum OCV values of 0.7 mV and 0.8 mV have been observed respectively for the control and experimental MFCs [Fig. 1]. The current for both systems was measured in microamperes. A rapid increase in the initial stage is observed followed by a near linear stage where the change in voltage is not very distinctive. The initial increase can be attributed to the oxidation of organic compounds and development of potential using active microorganisms as the catalyst. With time, the potential drops because of nutrient depletion. The voltage can be regenerated by the addition of some external nutritional sources, reviving the activity of the microorganisms. The experimental MFC contains much more enriched and diverse microbial flora compared to the control MFC. Moreover, the vermicompost soil is also enriched in terms of organic compounds as expected and is evident from the soil analysis results [Table 1]. Therefore, it is not difficult to explain the better performance of the experimental MFC compared to the control one. The soil in the control MFC also contains natural microbial flora and biodegradable waste suitable as a microbial substrate but their presence is not in sufficient quantity for the generation of countable electrical power in a MFC.
image file: c5ra00870k-f1.tif
Fig. 1 Voltage generation profile as a function of time for control and experimental MFCs.

COD removal efficiency is an important parameter in waste treatment. This experiment is closely associated with smart waste management as both vermicomposting and the microbial fuel cell are individually associated with waste removal. The COD of the starting soil is measured as 5045 mg L−1. After a complete MFC operational cycle, lasting for 30 days, the measured values are 3509 mg L−1, 2700 mg L−1 and 1727 mg L−1, respectively, for the control, vermicompost and experimental soils. It is evident from the results that COD removal is much higher in the experimental MFC. The COD removal values are 31% and 47% for the control and vermicompost soils, but is 66% for the experimental MFC soil. This difference can be explained by the microbial activity in the vermicompost as well as in the MFC. The COD for the control set up decreases in a countable manner and this is solely due to the microbial activity in the MFC. The COD removal in the experimental MFC is attributed to both the vermicomposting and MFC operation. The COD removal in the experimental MFC is about 19% higher than that of the vermicompost soil. This COD removal is solely due to the MFC operation. The compounds present in the soil of the experimental MFC are in simpler forms compared to the control one and is also enriched with a diverse population of microbes, including electricigens. This aids easy COD removal in the vermicompost soil.

3.2. Polarization curve

OCV is measured in a state of infinite resistance and no current flow is observed. External resistors (1 MΩ–1 Ω) were applied in series to measure the respective values of CCV and current. The substrate concentration, species and population of microbes as well as the operating conditions have a pronounced effect on the performance and optimization of the MFC.22

In this study, polarization curves have been drawn for both the control and experimental MFCs. The highest power density values for the control and experimental MFCs have been recorded as 134.44 μW m−2 and 4 mW m−2 at respective current densities of 1222.22 μA m−2 and 6.66 mA m−2 [Fig. 2 and 3]; both are measured against an external resistance of 100 Ω. The power density for the experimental MFC is several-fold higher than that of the control MFC. In both cases, the initial voltage drop signifies an activation loss which occurred due to the energy lost in initiating the oxidation–reduction process by the microbes. As the MFCs have been operated in a solid (soil) medium in which the moisture level is not very high, this creates major problems for the microbes to get easy access to the nutrients and in turn generate countable energy from them. The solubility of the nutrients plays a vital role in MFC operation as it is much easier for the microbes to utilize them in a water soluble form. The presence of soil further limits the high value power production due to the lack of conductivity, increasing the ohmic resistance of the systems. The experimental MFC has generated power in the milliwatt range, resulting in better performance than the control MFC. The reason behind this can be clearly explained by the presence of enriched soil in terms of both nutrients and microbial flora, which better aids the performance of the experimental MFC, utilizing the simpler forms of available compounds and producing clean energy through a simple process without incurring any additional cost for waste treatment.


image file: c5ra00870k-f2.tif
Fig. 2 Polarization curve for control (non-vermicompost soil) MFC.

image file: c5ra00870k-f3.tif
Fig. 3 Polarization curve for experimental (vermicompost soil) MFC.

3.3. SEM and energy-dispersive X-ray spectroscopy (EDS) analysis

Scanning electron microscopy (SEM) was carried out to study the association of microbes with the electrode. This analysis also provides information on the predominant types of microbe and their electrogenic nature. The SEM image of the carbon cloth is taken at a magnification of 2 KX [Fig. 4(a)]; the image shows biofilm development around the fiber and the biofilm includes a mixed population of microbes, morphologically dominated by both short and long rod-shaped bacteria [Fig. 4(a) inset]. This is consistent with the results of microbial profiling analysis, which identified the predominant microbial populations in the fuel cell as E. coli strain CCFM8333 (accession no. LN678700), Bacillus cereus strain BUU2 (accession no. LN678699) and Pseudomonas monteilii strain CIP104883 (accession no. LN678701), which are all morphologically rod-shaped. The glass slides, comprising the bacterial culture from both the control and experimental MFCs, show the microbial distribution under SEM with a magnification of 10 KX. As evident from Fig. 4(b) and (c), the experimental soil is well-populated with microbes compared to the control soil. In the experimental MFC, the microbial distribution was found to be much more confined in an equal area of distribution. It is easier for the microbes to grow and colonize in liquid medium than in solid soil medium. Despite the unfamiliar and harsh environment, microbes heavily colonized the fibers, initiating power generation.
image file: c5ra00870k-f4.tif
Fig. 4 (a) Biofilm development on carbon fibers observed under a magnification of 2 KX. Mixed microbial population on an individual fiber magnified at 5 KX (inset). (b) Microbial distribution for experimental soil observed under a magnification of 10 KX. (c) Microbial distribution for control soil observed under a magnification of 10 KX.

EDS analysis provides complete elemental analysis of both the control and experimental soils [Table 1]. The table provides a detailed chemical characterization of both kinds of soil. The contents of potassium and phosphorous compounds is found to be increased in the vermicompost soil (0.48% and 0.12%) compared to those in the control soil (0.33% and 0.09%), though nitrogen was outside the detectable range of the equipment. Additionally, compounds of iron, magnesium and calcium have also been detected in higher amounts in the vermicompost soil. These micronutrients significantly contributed to the enrichment, rapid growth and activity of the microorganisms. Fertilization not only provides essential microelements for the microorganisms but also supplies electron acceptors which aid the electron transfer mechanism.26

Table 1 Energy-dispersive X-ray spectroscopy (EDS) analysis for control and experimental soil showing weight% of different elements present in the soil
Control Experimental
Element Weight% Atomic% Element Weight% Atomic%
B 37.47 48.87 B 41.60 53.49
O 51.97 45.81 O 47.31 41.10
Mg 0.67 0.39 Na 0.18 0.11
Al 3.40 1.78 Mg 0.69 0.40
Si 5.75 2.88 Al 3.17 1.63
P 0.09 0.04 Si 5.75 2.85
K 0.33 0.12 P 0.12 0.05
Ca 0.20 0.07 K 0.48 0.17
Fe 0.13 0.03 Ca 0.24 0.08
Totals 100   Ti 0.07 0.02
      Fe 0.38 0.09
  Totals 100


3.4. Cyclic voltammetry analysis

CV determines the presence of electroactive compounds present in the medium or on the bacterial cell wall, which are involved in the shuttling of electrons. The results of cyclic voltammetry can be explained by several mechanisms.

Electroactive compounds can be functional in a liquid based anode as they can function in a soluble form, or the outer membrane-bound red–ox compounds of bacteria can be responsible for the shuttling of electrons from the microbial species to the anode. There also remains a possibility of the presence of extracellular appendages or nanowires which may aid in the extracellular electron transfer. In Fig. 5, the prominent reduction peaks were observed between −520 mV and −635 mV (in two scan cycles operated in narrow and broad electrochemical windows, respectively), whereas the oxidation peak was not very prominent in either case. No peaks were observed in the medium without bacteria, as expected. The experiment has been performed practically in a solid-based medium; it is unlikely that bacterial mediators facilitate electron transfer in a soluble form. Therefore, either the microbes attached to the electrode facilitate electron transfer through membrane bound red–ox compounds, or some of the microbial species may contain extracellular appendages which assist in electron transfer from the biofilm to the electrode.


image file: c5ra00870k-f5.tif
Fig. 5 Cyclic voltammetry plot for mixed microbial population from soil, obtained at a scan rate of 10 mV s−1.

3.5. Analysis of electrochemical impedance spectra

EIS analysis generates information on the limiting factors in MFCs. These limiting factors, or the internal resistance of a whole cell, can be divided into various specific components, like activation resistance, ohmic resistance (attributed to solution resistance, electrode resistance, membrane resistance, etc.) and concentration resistance.22–25 The cell resistance, as calculated from the EIS graph, was found to be ∼845 KΩ for the experimental MFC (Fig. 6). The reason behind this high internal resistance is quite obvious, as the substrate used (i.e., soil) is non-conductive in nature and therefore ohmic resistance must be very high in this case. Although the use of a membrane electrode assembly instead of a separate membrane and electrode has minimized the internal resistance several-fold, the non-electrolytic behavior of the substrate makes it difficult to transport electrons to the electrode, raising the internal resistance of the cell. Microbes are the only facilitator of electron transfer here, overcoming the various resistances operating in the cell.
image file: c5ra00870k-f6.tif
Fig. 6 Nyquist representation of the electrochemical impedance spectroscopy (EIS) of the experimental cell as a function of applied frequency.

4. Conclusion

It is a very novel approach to use vermicompost soil as a source of energy generation through a microbial fuel cell. Both the processes are well known for waste management in a smart and economical way but the combination of both provides an even smarter way to harvest energy from waste. The maximum power density obtained from the vermicompost soil was 4 mW m−2. This value is impressive considering the fact that the soil has been used immediately after vermicomposting without the addition of any synthetic elements or external nutrients. The technique also seems to have promising practical viability due to the easy availability of materials and simple cellular composition. Ample scope for improving the process lies in detailed understanding of the mechanism. Microbial association with soil components and their nutritional preference, along with efforts to enrich electroactive populations, can open up new possibilities for advancement of research in this field.

Acknowledgements

The support in the form of a Senior Research Fellowship provided by the Council of Scientific and Industrial Research (CSIR), India is greatly acknowledged by Ms Arpita Nandy and Mr Vikash kumar.

References

  1. X. W. Liu, W. W. Li and H. Q. Yu, Chem. Soc. Rev., 2014, 43, 7718–7745 RSC.
  2. P. K. Barua and D. Deka, International Journal of Energy, Information and Communications, 2010, 1, 77–92 Search PubMed.
  3. Y. Fan, H. Hu and H. Liu, J. Power Sources, 2007, 171, 348–354 CrossRef CAS PubMed.
  4. H. Liu, R. Ramnarayanan and B. E. Logan, Environ. Sci. Technol., 2004, 38, 2281–2285 CrossRef CAS.
  5. D. H. Park and J. G. Zeikus, Biotechnol. Bioeng., 2003, 81, 348–355 CrossRef CAS PubMed.
  6. Y. C. Song, K. S. Yoo and S. K. Lee, J. Power Sources, 2010, 195, 6478–6482 CrossRef CAS PubMed.
  7. Y. Zuo, S. Cheng, D. Call and B. E. Logan, Environ. Sci. Technol., 2007, 41, 3347–3353 CrossRef CAS.
  8. B. Min and B. E. Logan, Environ. Sci. Technol., 2004, 38, 5809–5814 CrossRef CAS.
  9. T. Shimoyama, S. Komukai, A. Yamazawa, Y. Ueno, B. E. Logan and K. Watanabe, Appl. Microbiol. Biotechnol., 2008, 80, 325–330 CrossRef CAS PubMed.
  10. J. Pathma and N. Sakthivel, SpringerPlus, 2012, 1, 1–19 CrossRef PubMed.
  11. C. A. Edwards, J. Dominguez and E. F. Neuhauser, Biol. Fertil. Soils, 1998, 27, 155–161 CrossRef.
  12. R. M. Atiyeh, S. Subler, C. A. Edwards, G. Bachman, J. D. Metzger and W. Shuster, Pedobiologia, 2000b, 44, 579–590 Search PubMed.
  13. N. Q. Arancon, C. A. Edwards, R. Atiyeh and J. D. Metzger, Bioresour. Technol., 2004a, 93, 139–144 Search PubMed.
  14. M. S. Maboeta and L. Van Rensburg, Ecotoxicol. Environ. Saf., 2003, 56, 265–270 CrossRef CAS.
  15. J. Dominguez and C. A. Edwards, in Soil zoology for sustainable development in the 21st century, ed. S. H. Shakir Hanna and W. Z. A. Mikhail, Cairo, 2004, pp. 369–395 Search PubMed.
  16. D. R. Singleton, P. F. Hendrixb, D. C. Colemanb and W. B. Whitmana, Soil Biol. Biochem., 2003, 35, 1547–1555 CrossRef CAS.
  17. S. B. Quek, L. Cheng and R. C. Ruwisch, J. Biosens. Bioelectron., 2014, 5, 152 Search PubMed.
  18. I. A. Ieropoulos, P. Ledezma, A. Stinchcombe, G. Papaharalabos, C. Melhuisha and J. Greenman, Phys. Chem. Chem. Phys., 2013, 15, 15312–15316 RSC.
  19. G. K. S. Prakash, F. A. Viva, O. Bretschger, B. Yang, M. El-Naggar and K. Nealson, J. Power Sources, 2010, 195, 111–117 CrossRef CAS PubMed.
  20. T. H. Pham, J. K. Jang, H. S. Moon, I. S. Chang and B. H. Kim, J. Microbiol. Biotechnol., 2005, 15, 438–441 CAS.
  21. A. Nandy, V. Kumar, S. Mondal, K. Dutta, M. Salah and P. P. Kundu, New Biotechnol., 2015, 32, 272–281 CrossRef CAS PubMed.
  22. A. Nandy, V. Kumar and P. P. Kundu, Enzyme Microb. Technol., 2013, 53, 339–344 CrossRef CAS PubMed.
  23. J. D. R. Choi, H. N. Chang and J. I. Han, Biotechnol. Lett., 2011, 33, 705–714 CrossRef CAS PubMed.
  24. S. Xu and H. Liu, J. Appl. Microbiol., 2011, 111, 1108–1115 CrossRef CAS PubMed.
  25. Z. He and F. Mansfeld, Energy Environ. Sci., 2009, 2, 215–219 CAS.
  26. X. Wang, Z. Cai, Q. Zhou, Z. Zhang and C. Chen, Biotechnol. Bioeng., 2012, 109, 426–433 CrossRef CAS PubMed.

This journal is © The Royal Society of Chemistry 2015