Excellent hydrogen evolution by a multi approach via structure–property tailoring of titania

R. Shwetharania, C. A. N. Fernandob and Geetha R. Balakrishna*a
aCentre for Nano and Material Sciences, Jain University, Jain Global Campus, Jakkasandra post, Kanakapura Taluk, Bangalore-562112, India. E-mail: br.geetha@jainuniversity.ac.in; Web: http://cnms.jainuniversity.ac.in Fax: +91 8027577211; Tel: +91 8027577212
bNano-Technology Research Lab, Department of Electronics, Wayamba University of Sri Lanka, Kuliyapitiya, Sri Lanka

Received 16th March 2015 , Accepted 9th April 2015

First published on 9th April 2015


Abstract

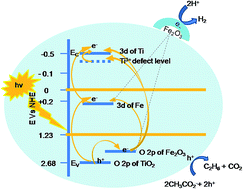
Photocatalytic water splitting by solar energy is an ideal economic method for hydrogen generation. An attempt has been made to overcome the main barriers of photocatalytic hydrogen evolution (these being rapid recombination of electron–hole pairs, the process of back reaction and poor activation of titania by visible light) by the usage of Fe-induced titania. The method facilitates a cage like mesoporous structure and an effective surface level doping. The induction of dopants and formation of coupled semiconductor oxides of well matched band energy contribute favorably to the rise of mid bands and the perfect alignment of their energy levels, leading to a shallow trapping and detrapping of electrons, necessary for efficient charge separation and transfer. Decrease in the band gap energy to ∼2.0 eV and hence the extended light absorption in modified titania, together with a shift in band edge potentials (caused by pH variation), results in an activated titania, desirable for enhanced visible light hydrogen evolution. The modified nanostructure shows an excellent hydrogen evolution of 255 mmol g−1 h−1, one of the highest reported so far. Sodium acetate acts as a good sacrificial agent in preventing the back reaction. Characterization techniques like spectroscopy (XRD, UV, reflectance, EDX, XPS and PL) and microscopy (FESEM and HRTEM) have been used to evidence the presence of Fe as dopant/as oxide and to study the structure–property tailoring that occurs during chemical modification.


1. Introduction

Hydrogen will no doubt be an ideal and renewable energy source in the future because of its clean nature and energy efficiency. Nature relies on photocatalysis to store energy and we can follow its example to produce hydrogen from water. Photocatalysis is known to be the most economic route to evolve hydrogen.1 Several photocatalysts have been shown to split water into hydrogen and oxygen using light. The three requirements for photocatalytic hydrogen production are: (a) the photocatalyst must have a band gap of at least ≈1.23 eV (the necessary thermodynamic potential for water splitting) although the overpotential due to slow reactions and resistance in the system make the required band gap closer to 1.7–1.8 eV; (b) the conduction band of the photocatalyst must be more negative than the redox potential of H+/H2O (0 V vs. NHE) and the valence band edge should be more positive than the redox potential of O2/H2O (1.23 eV) for efficient H2 and O2 evolution; (c) stability of the photocatalyst must be sufficiently good in aqueous conditions without any deactivation. TiO2 is the most common photocatalyst which satisfies the above requirements and hence is envisaged to be the best agent for hydrogen generation. It has high resistance to corrosion and is cheap, easily available and environmentally friendly. Fujishima and Honda demonstrated the photoinduced decomposition of water on a TiO2 electrode2 for the first time in 1972 (ref. 3) and reported a very small amount of hydrogen release (4–5 μmol g−1 h−1). It was only in 2009 and onwards that such studies were concentrated to explore the potency of hydrogen being generated as an alternative source of energy to support depleting energy sources. Titanium dioxide, when irradiated with photons of wavelength ≤400 nm, generates electron–hole pairs in the conduction and valence band, respectively. The band edge potentials and the band energy are sufficient enough to overcome the endothermic character of the water splitting reaction. The activated electron in the conduction band reduces the adsorbed H+ and oxygen to produce H2 or OH˙ and OH˙, respectively, and when OH species/radicals are scavenged by appropriate reducing species, this facilitates overall hydrogen evolution. TiO2 typically absorbs ultraviolet light, to conquer its wide band gap energy (∼3.2 eV for anatase phase) for photocatalytic hydrogen generation.4 Since the total solar spectrum encompasses only ∼5–10% of the UV radiation,5,6 it is still challenging to apply TiO2 for large scale production. Also, the limitation of highly probable recombinations occurring in the above photocatalyst and ultra-fast hole transfer processes that can cause back reaction of H2 and O2 to water, add to the above challenges. Several modifications were designed to obtain an apt product/process to overcome the above challenges such as doping of transition metal ions, non metal elemental doping, addition of a sacrificial agent (SA), photosensitizers, coupling with other semiconductor oxides and ion implantation (expensive and possible only in highly crystalline TiO2).7–10 The formation of doped and composite TiO2 materials have been observed as a promising strategy to sensitize TiO2 to visible light. Among various dopants, Fe is considered to be an attractive candidate to enhance the water splitting photocatalytic reaction. Also Fe3+ ion has an ionic radius (0.645 Å) comparable to that of Ti4+ (0.68 Å) and it is energetically favorable for Fe3+ ion to occupy Ti4+ sites substitutionally. The created energy levels of dopants lie closer to the conduction and valence band edges of TiO2. In the composite of TiO2 and Fe2O3, the valence band of Fe in Fe2O3 is less positive than the valence band edge of TiO2 and can easily act as an electron acceptor, placing itself at a potential of 2.4 eV, with respect to NHE.11–13 The absorption of visible light equivalent to 2.6 eV allows electron excitation from the O 2p of Fe2O3 to the 3d of Ti. The Fe t2g level is located at 0.2 eV above the valence band and the Fe eg level is split into dz2 and dx2y2 orbitals which extend the conduction band to a certain degree. Fe3+ ions act as shallow traps in the TiO2 lattice to decrease the recombination of electrons and holes and hence to enhance the photocatalytic efficiency. Fe ions can hence not only trap electrons but also holes. It is both an electron–hole recombination inhibitor and an efficient electron transfer agent.14,15 However the regenerative behavior of the Fe3+/Fe2+ couple is undesirable and can deplete H+ ions contributing to low yield of hydrogen. SAs play a very important role in capturing holes (h+), thus allowing the electron for reduction of protons to hydrogen and causing hydrogen evolution. The polarity, oxidation potential and adsorption ability of an SA need to be evaluated before their selection for this process.

Although Fe doped titania has been synthesized by an impregnation method for hydrogen evolution by various groups, the amount of hydrogen evolved remains at the micro level; the present paper reports the use of new precursors with an efficient SA to evolve a high concentration of hydrogen (millimoles). It has been reported that FeTiO2 synthesized by the impregnation method (band edge at 366 nm) shows 4–5 μmoles g−1 h−1 of hydrogen release from water containing EDTA solution4 and, further, 270 μmoles g−1 h−1 by a modified wet impregnation method (band edge at 575 nm).16 Similarly the same photocatalyst when prepared by the hydrothermal method by Alam Khan et al.17 has been observed to release 125 μmoles g−1 h−1 of hydrogen. The literature reports higher activity with 0.2–1% of iron content as dopant, and when the iron exceeds 2% it results in a net decrease in activity. Another important parameter, calcination, has been observed to play a prominent role in hydrogen evolution.18,19 Higher calcination temperatures have been reported to increase crystallinity, leading to reduced defects. Excess defects tend to act as recombination centers.20 The present article demonstrates the synthesis of an FeTiO2 nanostructure using the wet impregnation method at high calcination temperature for a significant and improved production of hydrogen. The technique involves spinning of the dopant precursor with TiO2 at a high speed in aqueous condition so that the kinetic energy involved is high enough to induce lattice atomic relocation mostly on the surface of TiO2 atoms. Excess precursor results in aggregate oxides which tend to deposit on surface as oxides when calcined. A feasible precursor which could positively result in Fe2O3, which further diffuses/adsorbs on TiO2 to form a desirable structure of FeTiO2 and its iron oxide composite (with enhanced properties) respectively, was carefully selected. Different dopant concentrations and pH conditions were experimented for optimization of the formulation and process. The pH of the solution greatly influences the surface charge and band edge positions of the semiconductor particles and, studies at different pH conditions give a deep insight into the events occurring on the surface of the reaction. Hence, a sustainable, high hydrogen production is the aim, by a multi approach via photocatalytic water reduction, solving energy and environment issues.

2. Experimental

2.1 Photocatalyst preparation

Commercially available (CM, SD Fine) TiO2 was directly used as the TiO2 source and Fe (NO3)3·6H2O (98%, Merck) as the Fe source for the preparation of FeTiO2. To obtain 0.15% FeTiO2, an aqueous mixture of TiO2 and Fe(NO3)3 was stirred at 60 °C for 24 h to form the corresponding doped sample of composition Ti0.85Fe0.15O2.0. The obtained sample was dried at 100 °C and then calcined at 600 °C for 5 h to obtain an anatase phase of the nanoparticles. The powders (doped and undoped) were then pulverized using a Spex mixer mill with an agate vial for an hour and used for the photocatalytic reactions. Different precursor concentrations resulted in a proportionate dopant concentration in titania. Concentrations ranging from 0.05, 0.1, 0.15, 0.2 and 0.25% were experimentally and photocatalytically evaluated. 0.15% of Fe doping was observed to be optimum. An increase of dopant concentration beyond a proportion limit caused an adverse effect, as shown in Fig. 1 of the ESI. When the Fe3+ ion concentration exceeded the optimum level, there appears to be a tendency of disturbance in the titania framework, leading to adverse photocatalysis.21 The present work focuses on complete characterization of an optimally (0.15%) doped titania and evaluation of its photocatalytic efficiency as a water reduction agent.

2.2 Photocatalyst characterization

Powder X-ray diffraction pattern was recorded for phase identification from a P analytical X’pert pro diffractometer with Cu Kα radiation (secondary graphite monochromator) at a scan rate of 1° min−1. The crystallite size and the lattice parameters were calculated using the Debye–Scherrer equation22 and 1/d2 = h2/a2 + k2/b2 + l2/c2 where d is the distance between the crystal planes of the hkl indices and a, b, c are the lattice parameters. Field emission scanning electron microscopy (FE-SEM) images were obtained by a Carl Zeiss supra-55 field emission microscope using an acceleration voltage of 20 kV. Energy-dispersive X-ray analysis (EDX) was used in conjunction with scanning electron microscopy to study the surface morphology and to detect the elements in the prepared samples. The absorption spectrum was recorded for nanomolar suspensions of the photocatalyst prepared by milling to avoid as much as possible the reflection of light, using a Shimadzu 1700 PC UV-visible spectrophotometer. The surface area of the catalyst was determined by a Smart Sorb 93 Brunauer–Emmett–Teller (BET) surface analyzer with sorb 93 reduction software. High resolution transmission electron microscopy (HRTEM) images were obtained with a JEM-2010 electron microscope (JEOL, Tokyo, Japan) at an accelerating voltage of 200 kV. TGA-DTA analysis was performed (TGA Q50 V20.13 Build 39) in a temperature range of 35–700 °C. Photoluminescence (PL) experiments were performed on a Shimadzu RF 5301 PC spectrofluorometer.

2.3 Photocatalytic hydrogen production

At first, 5 mg of the FeTiO2 semiconductor particulate system was dispersed in 250 ml of water with a 0.5 M concentration of sodium acetate as sacrificial agent solution in a reactor set-up as shown in Fig. 1. Before irradiation Ar was flushed, opening the inlet valves 7 and 11 to remove dissolved H2 up to almost the zero ppm level in the fully covered reactor cell, as shown in Fig. 1. During the illumination valves 7 and 11 were closed fully, preventing the dissolution of H2 into the environment. A 100 W tungsten lamp (Phillips) with a photon flux of 10 mW cm−2 which peaks around 800–850 nm was used with a cutoff filter to remove any thermal radiation and to ensure illumination by visible light over an exposure area of 30 cm2. Ar was flushed continuously at a very slow rate, collecting the produced H2 in the upper circulating loop, with the circulation pump sending the H2/Ar mixture into the GC from the outlet valve 6, each time in a 4 min cycle. Sodium hydroxide was used to induce the necessary increase in pH values.
image file: c5ra04578a-f1.tif
Fig. 1 Experimental set up to measure H2 evolution: (1) powder particles; (2) solution; (3) light source; (4) gas chromatograph system; (5) stopcock; (6) outlet valve; (7) inlet valve; (8) circulation pump; (9) magnetic stirrer; (10) pressure gauge pump.

3. Results and discussion

3.1 Structural and morphological analysis

Fig. 2 shows the XRD pattern of the FeTiO2 sample calcined at 600 °C. The diffraction pattern exhibits characteristic reflections for the tetragonal anatase phase of titania, with intense peaks at 2θ corresponding to 25.3°, 37.8°, 48.0°, 53.9°, 55.0° and 62.7° for the (1 0 1), (0 0 4), (2 0 0), (1 0 5), (2 1 1) and (2 0 4) reflections, respectively; in agreement with JCPDS no. 21-1272. The appearance of peaks at 33.15° (104) and 35.65° (110) indicates a new phase of iron oxide and this suggests the chance of iron oxide (Fig. 2 of ESI) being dispersed on the surface of TiO2 grains or in-between the interfaces of TiO2 agglomerates, in addition to lattice substitution of Fe in TiO2.23,24 The pre-adsorbed Fe precursor is decomposed during calcination and the same is present on the surface, allowing easy diffusion and adsorption of Fe and iron oxide, respectively, onto the TiO2, producing a mixture of FeTiO2 and an iron oxide/TiO2 solid solution. Surface doping and surface adsorption facilitates easy electron transfer to the active sites for H+ reduction. Table 1 gives the cell volume, surface area and the average crystallite sizes, calculated by the Scherrer equation for the most intense diffraction peak at 2θ = 25.33°. The cell volume increases on doping, indicating the presence of defects/oxygen vacancies (Vo) present in the doped sample. The crystallite size and surface area are observed to be contrary and doubled on doping, indicating the better interaction of water molecules with the photocatalyst in visible light. Anatase phase was prominently observed without the rutile or brookite phase. Several studies on Fe-doped TiO2 photocatalyst systems have revealed that Fe3+ enters the TiO2 lattice substitutionally, due to their similar ionic radius, with greater solubility in the anatase phase compared to the rutile phase.25 The FESEM images in Fig. 3 depict the morphology of the synthesized nanostructures. The particles appear to be smooth and uniformly distributed throughout, with a porous network of nano-spheroids, facilitating better water adsorption, penetration and photoreaction as compared to bare titania (Fig. 3a of ESI). The morphology of a cage like structure with high surface area (marked in circles in Fig. 3) provides easy access of more water molecules to the photocatalyst, enhancing hydrogen production. The high resolution TEM images gives well-resolved lattice planes of the FeTiO2 nanostructure, as shown in Fig. 4, in which the facet distances of 0.37 nm and 0.25 nm correspond to (101) plane of anatase TiO2 and (110) plane of Fe nanoparticles, respectively (Fig. 4a and b).26 The corresponding SAED (selective area electron diffraction) pattern (inset in Fig. 4b and c) of discrete nanoparticles indicate more intense spots and a speckled pattern due to the large grain size (obtained at higher calcination temperature) and polycrystalline anatase structure. Fig. 4c shows the dislocation fringe spacing (shown by the arrows) due to the addition of the dopant element Fe. Dopant increases the lattice strain, which will anchor dislocation (crystallographic defect) in the lattice fringes, confirming the effect of modification in a titanium dioxide nanoparticle.27 The particle size averages in the range of 60–70 nm (inset in Fig. 4d). The morphology clearly indicates some irregular shaped particles, attributed to substitution (Fig. 4d)/adsorption (Fig. 4e; indicated by colored arrows) of Fe/iron oxide, respectively, on titania unlike the bare titania (Fig. 3b of ESI). The dark regions indicate particles overlying one another (Fig. 4f).
image file: c5ra04578a-f2.tif
Fig. 2 X-Ray diffraction pattern of FeTiO2 nanoparticles.
Table 1 Surface area, crystallite size and cell volume of photocatalysts
Element Crystallite size Cell volume Surface area
TiO2 30 nm 137.1 Å3 24.67 m2 g−1
FeTiO2 59 nm 138.0 Å3 48.85 m2 g−1


image file: c5ra04578a-f3.tif
Fig. 3 FE-SEM image of the synthesized FeTiO2 nanoparticles.

image file: c5ra04578a-f4.tif
Fig. 4 HRTEM images of the prepared FeTiO2 nanostructures: (a & b) facets of Ti and Fe; (c) dislocation and inset SAED pattern; (d) Fe-induced titania, inset histogram of particle size distribution; (e) Fe2O3 adsorbed titania; (f) overlaid nanoparticles.

3.2 Elemental analysis

Fig. 5 shows the elemental composition of the doped sample analyzed by EDX. It shows peaks for Ti, O and Fe elements and indicates the absence of other impurities. Inset shows the atomic and elemental percentage of the dopant in titanium dioxide. The obtained composition Ti0.81Fe0.12O2.07 is in agreement with the proposed percent (0.15%) of dopant concentration. Fig. 6 depicts the high resolution XPS spectra of the FeTiO2 photocatalyst. The wide XPS spectrum of Fe–TiO2 photocatalyst, which indicates the presence of Ti, O and Fe at various binding energy levels is indicated in Fig. 6a. The binding energies 459.5 eV and 465.3 eV in Fig. 6b correspond to the Ti 2p core level spectrum and are in agreement with literature reports.28 The slight shift of Ti 2p3/2 peak with respect to that of Ti4+ in pure anatase TiO2, i.e. from 458.5 to 459.7 eV indicates the presence of Ti3+. The main peak for O 1s at about 530.7 eV is as shown in Fig. 6c and is attributed to the lattice oxygen in the metal oxide (Ti–O, Fe–O).29,30 Fig. 6d shows the Fe 2p core level spectrum. The peaks of Fe are very weak due to the low dopant concentration. The binding energies located at around 712 eV and 724 eV could be assigned to the trivalent oxidation state of Fe3+ 2p3/2 and Fe3+ 2p1/2, respectively, and the Fe 2p doublet implied the presence of Fe–O bonds.31 Thus the XPS analysis substantiates the presence of Ti3+ defects, Ti–O and Fe–O bonds in the Fe-induced titania sample.
image file: c5ra04578a-f5.tif
Fig. 5 Energy-dispersive X-ray spectra of FeTiO2. (Inset: atomic and elemental percentage of the dopant in titanium dioxide).

image file: c5ra04578a-f6.tif
Fig. 6 XPS spectrum of Fe doped TiO2 photocatalyst (a) FeTiO2 spectrum (b) Ti 2p core level (c) O 1s core level (d) Fe 2p core level.

3.3 Optical and spectral analysis

Fig. 7 depicts the UV-visible absorption spectra of the catalysts. The slightly red-colored FeTiO2 shows an extended red shift and an increased visible light absorption in contrast to commercially available TiO2, which shows an absorption threshold at ∼400 nm. An increase in dopant concentration up to 0.15% extends the absorption threshold to 600 nm, beyond which a decrease is observed. The surface barrier and space charge region should be synergistic for efficient trapping and transfer of electrons, and beyond the optimum concentration the possibility of trapped charge carrier recombination through quantum tunneling would be greater with the lack of driving force to separate them. For higher dopant concentrations, the space charge region becomes very narrow and the penetration-depth of light into TiO2 greatly exceeds the thickness of the space charge layer, enhancing the rate of recombination of electrons and holes. The concentration of induced ions becomes optimum when the thickness of the space charge layer equals the depth of light penetration. The red shift from 400 nm to 600 nm may be attributed to the mid band created by Fe3+, which shifts the optical absorption edge of the crystal to higher wavelength (visible region) in the doped sample. The electronic transitions from the valence band to the dopant level or from the dopant level to the conduction band can red-shift efficiently the band gap energy absorption threshold32 to obtain a band gap of ∼2 eV. The mid bands could also be due to the distortions related to defect centers caused in the process of doping. Coupled semiconductors of well-matched band energies, as in the case with TiO2 and iron oxide, are favorable to improve charge separation and transfer.33 A better charge separation in the coupled system is the result of a fast electron transfer process between the two semiconductors. The vectorial nature of electrons gives a cascade of electrons from TiO2 to Fe2O3 leading to a better process of charge separation.34 Fig. 8 depicts the reflectance spectra of FeTiO2, with a broad absorption ranging from 415 nm to 570 nm indicating d–d transitions of either transition metal impurity or a chromophoric group (due to one of the native defects) or both.35 Fe3+ ions are substitutionally located in Ti4+ lattice site with and without charge compensation by oxygen vacancy at a nearest neighbor site of 0.08 eV below the energy level of conduction band.36 Theoretical calculations show that a high vacancy could induce a vacancy band of electronic states just below the conduction band.
image file: c5ra04578a-f7.tif
Fig. 7 UV-visible absorption spectra for: (a) commercial TiO2; (b) FeTiO2. Inset indicates the effect of the dopant concentration on the absorption threshold.

image file: c5ra04578a-f8.tif
Fig. 8 Reflectance spectra of the FeTiO2 photocatalyst.

Formation of doped titania/composite oxides led to changes in charge carrier trapping, immigration and transfer; this is substantiated by photoluminescence (PL) studies. The PL emission observed in any semiconductor originates mostly from radiative recombinations that occur between the photo-generated electrons and holes. When the semiconductor is excited by light equivalent to its band gap energy, the photo-generated electrons on reaching the conduction band return back to the valence band, with a discharge of energy as photoluminescence radiation. This process is recognized as direct band–band transition photoluminescence. In the other photoluminescence process, the excited electrons firstly transfer from the conduction band to different sub-bands, e.g. surface oxygen vacancies or defects, via non-radiative transition, and subsequently transfer from the sub-bands to the valence band via radiative transition with the release of photoluminescence signals.37 Fig. 9 shows the PL spectra of the TiO2 and Fe–TiO2 nanostructures. TiO2 nanoparticles show an emission peak at 450 nm. This characteristic broad band of anatase crystals is due to the radiative recombination of self-trapped excitons.38 On doping, the PL emission is decreased greatly and indicates a delay in recombination rate suggesting the increased availability of electrons for good hydrogen production.39 The small emissions at 390, 413 and 434 nm are attributed to the recombination of trapped electrons–holes in surface defects. The emission peak at around 462 nm (indicated by arrows) corresponds to mid band or deep level traps caused by Fe incorporation into TiO2, which can in turn cause delayed recombination. The induction of trivalent ion (Fe3+/Ti3+) introduces oxygen vacancies and/or interstitial cations (Fe3+, Ti3+, and Ti4+), to maintain spontaneously charge neutrality or equilibrium.40 These defect states may be due to the Fe3+–Vo and Ti3+–Vo. The lattice defects can raise the Fermi level of TiO2, to increase correspondingly the height of the potential barriers that repel electrons to the surface, thus reducing the rate of recombination of electrons and holes.41 If the ions have valences greater than three, as Ti4+ in TiO2, cation vacancies tend to form and the presence of such cation vacancies are tolerated better in an anatase structure, due to the improved charge defect compensation of the neighboring Ti cations.42


image file: c5ra04578a-f9.tif
Fig. 9 Photoluminescence spectra of (a) CM-TiO2, (b) FeTiO2, (c) FeTiO2 and sacrificial agent.

Addition of an SA, sodium acetate, decreases the PL emission all the more, due to further lowering of recombination. Sodium acetate, being a well known SA, scavenges holes and decreases recombination, thus contributing to a greater availability of electrons for hydrogen evolution (as shown below).

2CH3COO + 2h+ → C2H6 + CO2

Thermogravimetric analysis (TGA) and differential thermal analysis (DTA) were carried out to substantiate the stability of the photocatalyst. Fig. 4 in ESI shows TGA-DTA curves for the prepared FeTiO2 after being used and regenerated (annealed at 600 °C) after one cycle of hydrogen evolution (40 min). In the TGA curve, a weight loss of 0.2% was observed in the temperature range between 37 to 230 °C, while the DTA curve displayed an endothermic peak centering at 42 °C and is ascribed to dehydration and loss of water molecules.43 An exothermic peak around 380–400 °C indicates the crystallization temperature and phase change of the photocatalyst to the anatase phase. The large particle size lowers the crystallization temperature.44 There is no considerable weight loss (total weight loss is about 0.2%) with respect to temperature change and this indicates that the prepared FeTiO2 is thermally stable and reusable. Further XRD, UV and PL spectra of the doped sample, as depicted in Fig. 5 of ESI, before and after five cycles of hydrogen evolution, reveal similar patterns confirming the undisturbed lattice structure and stability after repeated use.

The electronic structure of the modified titania has hence been observed to be influenced by crystal structure, crystallite size (increase) and surface morphology (nanocrystalline structure), and can be well correlated to its electronic and optical properties to study its enhanced photocatalytic capacity to split water and evolve hydrogen.

3.4 Photocatalytic hydrogen evolution

The prepared nanomaterial was evaluated for its efficiency as a photocatalyst to cause water reduction and hydrogen evolution under visible light irradiation (tungsten source). The efficiency of a metal ion (as in a doped sample/composite iron oxide) to induce enhanced photoreaction depends on whether it serves as a mediator of interfacial charge transfer or as a recombination center. The efficiency of the photocatalyst then further depends on much more intricate parameters such as the dopant concentration, its electronic configuration, their energy levels and the distribution of the dopants within the particles. As mentioned earlier, 0.15 by atom percent of Fe gives the optimum evolution of hydrogen. The above formulation was observed to give a maximum extension of light absorption into the visible range (600 nm) as confirmed by UV-visible spectra (Fig. 7). Doping causes mid bands which decrease the band gap energy to the visible range. Fig. 10 shows the H2 evolution from visible light mediated catalytic water reduction using FeTiO2 (0.15%, Fe) at different pH conditions. A remarkable H2 evolution rate of 255 mmol g−1 h−1 with a quantum efficiency45,46 of 39.7% was observed in the visible region from this system when compared to presently available literature. The average solar to hydrogen efficiency47 of 6.4% is obtained as per the equation below,
STH% = {output energy of hydrogen evolvedAM 1.5G/energy of incident solar light} × 100

image file: c5ra04578a-t1.tif

image file: c5ra04578a-f10.tif
Fig. 10 H2 evolution from 0.15% FeTiO2 (a) pH = 6 (b) pH = 8 (c) pH = 10.

The mechanism of visible light activity of Fe-induced titania can be explained based on its energy band potentials. Fe doped nano-titania consists of broad Ti 3d and sharp Fe 3d orbitals as the conduction band and O 2p as the valence band of TiO2.17 The composite of Fe2O3–TiO2 consists of an additional O 2p of Fe2O3 as the valence band. On the basis of these results, a band structure for synthesized sample is as shown in Scheme 1; it is suggested that electron–hole pairs are generated under visible light illumination and the electrons are transferred by three approaches: (a) from the valence band of FeTiO2 to Fe 3d level, when the energy of the photon is ≥EFe 3dEV; (b) from the valence band of O 2p of Fe2O3 into Fe 3d level, when the energy of the photon is ≥ECEV; and (c) from the valence band of Fe2O3 to Ti 3d, when the energy of the photon is ≥ETi 3dEV, (d) and also excitation of electron from Fe 3d band to conduction band of Ti, when the energy of photon is ≥ECEFe 3d. In addition there can also be a transfer of an electron from O 2p of FeTiO2 to O 2p of Fe2O3, which acts as good acceptor (A) level placed at a potential of 2.4 eV, when the photon energy is ≥EAEV, causing holes in the Ti valence band. These holes are then scavenged by a pre-adsorbed SA to avoid the back reaction. The presence of mid bands/vacancies/defect sites (Fe3+ mid band, Ti3+–Vo, Fe3+–Vo) adds to good electron transfer and charge separation. The trapped electrons in the above-mentioned energy states are then detrapped, transported to the reaction site at the surface, resulting efficiently in a much higher hydrogen production. The reduced recombination on doping is strongly evident by PL studies which display a decrease in the PL emission.48 Thus the efficient charge separation (reduced electron–hole recombination) and visible light activity (substantiated by UV-Vis spectroscopy) due to the dopant/composite is justified.


image file: c5ra04578a-s1.tif
Scheme 1 Schematic representation of the electronic band structure of the synthesize photocatalyst.

The decomposition of water into hydrogen and oxygen is a chemical reaction with a large positive Gibbs free energy (ΔG = 237 kJ mol−1) and thus the back reaction is very facile. SA scavenges holes favorably to avoid the back reaction in the above water reduction reaction. The efficacy of SA in such photocatalytic water reduction reactions depends on: (a) the extent of pre adsorption of SA on to the surface of TiO2; (b) its reduction potential (the measure of thermodynamic ability to reduce the photogenerated hole in photocatalyst); and (c) the kinetic barrier for the electron transfer process. The optimum amount of 0.5 M sodium acetate has been used as an SA. In order to facilitate direct electron transfer from the SA to TiO2, the attachment of SA to the TiO2 surface is one of the primary requirements. Also the two polar OH groups in sodium acetate [–(C–O)] reduce the kinetic barrier for electron transfer from sodium acetate to TiO2 (termed as reductive quenching). It is substantiated and can be confirmed from PL studies, that least amount of charge carrier recombination occurs when SA is used with modified titania for the water reduction reaction. Carbonyl species can suppress effectively the back reaction and activate the photoabsorption of oxygen on TiO2. Sodium acetate is, hence, a hole scavenger, through indirect reduction of h+ to form the reducing species CO2˙.

It is observed that an increase in pH enhances the H2 evolution rate. A change in pH causes a change in the semiconductor flat band potential due to the change in the adsorbed charge (H+ and OH) on the electrode surface. The addition of negative charge (OH ions) shifts the band to a more negative potential, whereas adsorption of a positive charge (such as H+ ions) shifts it to the positive potential.49 When the onset shifts towards the negative potential, it supports the shift of the conduction band position of TiO2 towards the more negative side so as to produce a higher driving force for electron transfer to the H+/H2O redox level, efficiently contributing to hydrogen evolution. The photocurrent on-set potentials obtained from FeTiO2 powder pressed onto a conductive glass plate show that the flat band potential (approximately equal to the on-set potential) becomes more negative with increase in pH and has a value sufficient for photo-reduction of water. Flat band potentials obtained for the photo-electrode were −0.15 V, −0.12 V and 0.11 V vs. NHE at pH = 10, 8 and 6, respectively. In all it can be stated that a perfect alignment of the energy levels led to a shallow trapping and detrapping of electrons, necessary for efficient charge separation and electron transfer. The decrease in band gap energy to ∼2.0 eV and hence the extended light absorption in modified titania, together with a shift in band edge potentials (caused by pH variation), results in an activated titania, desired for enhanced visible light hydrogen evolution.

It is important to mention that the present group has earlier performed a comparative study of photocatalytic oxidative degradation with two sources of light: tungsten and sunlight. These observations indicated that the sunlight is more effective in causing photocatalytic oxidation by ≈4.5 times over tungsten light.50 Hence it is reasonable to presume that if a photocatalytic reactor is designed aptly to harvest sunlight, then it can cause much more enhanced water reduction and economic hydrogen evolution. However the present investigating group is working on this and shall soon communicate it as a follow up work to this.

4. Conclusions

The present study reports the synthesis of a 0.15% Fe induced titania nanostructure, at high calcination temperature through a wet impregnation technique. The Fe-induced titania posses a highly reactive tetragonal anatase phase with dispersed nanospheroid structure desired for high interaction of water molecules with the photocatalyst. It shows a remarkably high photocatalytic capacity to evolve hydrogen, to an extent of 850 μmol/5 mg within 40 min. The Fe3+/defects/oxygen vacancies create mid bands (0.2 eV wrt NHE)) between the conduction and valence band of titanium dioxide causing a favorable alignment of the band edge for efficient electron generation, separation and transfer on absorption of visible light. The created mid bands contribute to an efficient charge trapping and reduced recombination. Applying an optimum pH of 10 facilitates favorable alignment of band edges towards the negative potential to enhance the redox potential necessary for water reduction.

Acknowledgements

The authors greatly acknowledge Jain University for the financial support and Wayamba University of Sri Lanka.

References

  1. H. Wender, R. V. Gonçalves, C. B. Dias, M. J. M. Zapata, L. F. Zagonel, E. C. Mendonça, S. R. Teixeira and Flávio Garcia, Nanoscale, 2013, 5, 9310 RSC.
  2. A. Fujishima and K. Honda, Nature, 1972, 238, 37 CrossRef CAS.
  3. S. T. Martin, H. Herrmannt and M. R. Hoffmann, J. Chem. Soc., Faraday Trans., 1994, 90(21), 3323 RSC.
  4. H. Choi, M. G. Antoniou, M. Pelaez, A. A. De la Cruz, J. A. Shoemaker and D. D. Dionysiou, Environ. Sci. Technol., 2007, 41, 7530 CrossRef CAS.
  5. C. Belver, R. Bellod, A. Fuerte and M. Fernandez Garcia, Appl. Catal., B, 2006, 65, 301 CrossRef CAS PubMed.
  6. J. L. Gole, J. D. Stout, C. Burda, Y. Lou and X. Chen, J. Phys. Chem. B, 2004, 108(4), 1230 CrossRef CAS.
  7. M. Anpo, Y. Yamashita and Y. Ichihashi, Optronics, 1997, 186, 161 CAS.
  8. M. Anpo, Pure Appl. Chem., 2000, 72, 1265 CAS.
  9. M. Anpo and M. Takeuchi, Int. J. Photoenergy, 2001, 3, 89 CrossRef CAS.
  10. H. Yamashita, M. Harada, J. Misaka, M. Takeuchi, Y. Ichihashi and F. Goto, J. Synchrotron Radiat., 2001, 8, 569 CrossRef CAS.
  11. J. A. Navio, M. Macias, M. Gonzalez-Catalan and A. Justo, J. Mater. Sci., 1992, 27, 3036 CrossRef CAS.
  12. R. I. Bickley, J. S. Lees, R. J. D. Tilley, L. Palmisano and M. Schiavello, J. Chem. Soc., Faraday Trans., 1992, 88, 377 RSC.
  13. W. Choi, A. Termin and M. R. Hoffmann, J. Phys. Chem., 1994, 98, 13669 CrossRef.
  14. K. Ranjit and B. Viswanathan, J. Photochem. Photobiol., A, 1997, 108, 79 CrossRef CAS.
  15. S. Ikeda, N. Sugiyama, S. Murakami, H. Kominami, Y. Kera and H. Noguchi, Phys. Chem. Chem. Phys., 2003, 5, 778 RSC.
  16. J. K. Reddy, K. Lalitha, P. V. L. Reddy, G. Sadanandam, M. Subrahmanyam and V. D. Kumari, Catal. Lett., 2014, 144, 340 CrossRef CAS PubMed.
  17. M. Alam Khan, S. I. Woo and O. Yang, Int. J. Hydrogen Energy, 2008, 33, 5345 CrossRef PubMed.
  18. A. Kudo and Y. Miseki, Chem. Soc. Rev., 2009, 38, 253 RSC.
  19. Y. Wang, H. Cheng, Y. Hao, J. Ma, W. Li and S. Cai, J. Mater. Sci., 1999, 34, 3721 CrossRef CAS.
  20. V. Jagadeesh Babu, S. Vempati and S. Ramakrishna, RSC Adv., 2014, 4, 27979 RSC.
  21. S. Ikeda, N. Sugiyama, S. Murakami, H. Kominami, Y. Kera and H. Noguchi, Phys. Chem. Chem. Phys., 2003, 5, 778 RSC.
  22. R. Shwetharani, M. S. Jyothi, P. D. Laveena and R. Geetha Balakrishna, Photochem. Photobiol., 2014, 90(5), 1099 CAS.
  23. Q. Xiang, J. Yu and M. Jaroniec, J. Am. Chem. Soc., 2012, 134, 6575 CrossRef CAS PubMed.
  24. S. K. Sahoo, K. Agarwal, A. K. Singh, B. G. Polke and K. C. Raha, Int. J. Eng. Sci. Technol., 2010, 2(8), 118 Search PubMed.
  25. J. Araña, O. González Díaz, M. Miranda Saracho, J. M. Doña Rodríguez, J. A. Herrera Melián and J. Pérez Peña, Appl. Catal., B, 2001, 32, 49 CrossRef.
  26. H. Zhu, E. Zhu, G. Ou, L. Gao and J. Chen, Nanoscale Res. Lett., 2010, 5, 1755 CrossRef CAS PubMed.
  27. D. B. Williams and C. B. Carter, Transmission Electron Microscopy, Part 1 – Basics, Springer, New York, 2nd edn, 2009 Search PubMed.
  28. L. Deng, S. Wang, D. Liu, B. Zhu, W. Huang, S. Wu and S. Zhang, Catal. Lett., 2009, 129, 513 CrossRef CAS.
  29. C. Shifu, Y. Xiaoling and L. Wei, ECS Trans., 2009, 21(1), 3 Search PubMed.
  30. M. I. Litter and J. A. Navfo, J. Photochem. Photobiol., A, 1996, 98, 171 CrossRef CAS.
  31. N. T. K. Thanh, Magnetic Nanoparticles: From Fabrication to Clinical Applications, CRC press, 2012 Search PubMed.
  32. S. George, S. Pokhrel, Z. Ji, B. L. Henderson, T. Xia, L. Li, J. I. Zink, A. E. Nel and L. Mädler, J. Am. Chem. Soc., 2011, 133(29), 11270 CrossRef CAS PubMed.
  33. A. Elaziouti, N. Laouedj, A. Bekka and R. N. Vannier, J. King Saud Univ., Sci., 2015, 27, 120 CrossRef PubMed.
  34. C. Nasr, P. V. Kamat and S. Hotchandani, J. Phys. Chem. B, 1998, 102, 10047 CrossRef CAS.
  35. Y. Ma, X. Wang, Y. Jia, X. Chen, H. Han and C. Li, Chem. Rev., 2014, 114, 9987 CrossRef CAS PubMed.
  36. J. Moser and M. Gratzel, Helv. Chim. Acta, 1987, 70, 1596 CrossRef CAS PubMed.
  37. J. Yan, G. Wu, N. Guan, L. Li, Z. Li and X. Cao, Phys. Chem. Chem. Phys., 2013, 15, 10978 RSC.
  38. W. F. Zhang, M. S. Zhang, Z. Yin and Q. Chen, Appl. Phys. B: Lasers Opt., 2000, 70, 261 CrossRef CAS.
  39. Y. Wang, Q. Lai, F. Zhang, X. Shen, M. Fan, Y. Heae and S. Renf, RSC Adv., 2014, 4, 44442 RSC.
  40. W. Hung, S. Fu, J. Tseng, H. Chu and T. Ko, Chemosphere, 2007, 66, 2142 CrossRef CAS PubMed.
  41. A. Heller, Y. Degani, D. W. Johnson and P. K. Gallogher, J. Phys. Chem., 1987, 91, 5987 CrossRef CAS.
  42. X. H. Wang, J. G. Li, H. Kamiyama, M. Katada, N. Ohashi, Y. Moriyoshi and T. Ishigaki, J. Am. Chem. Soc., 2005, 127, 10982 CrossRef CAS PubMed.
  43. A. Abidov, B. Allabergenov, J. Lee, H. Jeon, S. Jeong and S. Kim, Int. J. Machining Machinability Mater., 2013, 1(3), 294 CAS.
  44. N. Hafizah and I. Sopyan, Int. J. Photoenergy, 2009, 962783 Search PubMed.
  45. R. Sasikala, V. Sudarsan, C. Sudakar, R. Naik, T. Sakuntala and S. R. Bharadwaj, Int. J. Hydrogen Energy, 2008, 33, 4966 CrossRef CAS PubMed.
  46. Q. Li, B. Guo, J. Yu, J. Ran, B. Zhang, H. Yan and J. R. Gong, J. Am. Chem. Soc., 2011, 133, 10878 CrossRef CAS PubMed.
  47. X. Li, J. Yu, J. Low, Y. Fang, J. Xiaoc and X. Chen, J. Mater. Chem. A, 2015, 3, 2485 CAS.
  48. J. A. Navio, G. Colon, M. I. Litter and G. N. Bianco, J. Mol. Catal. A: Chem., 1996, 106, 267 CrossRef CAS.
  49. R. R. Lieten, Epitaxial Growth of Nitrides on Germanium, VUB University Press, 2009 Search PubMed.
  50. K. U. Minchitha and R. G. Balakrishna, Mater. Chem. Phys., 2012, 136, 720 CrossRef CAS PubMed.

Footnote

Electronic supplementary information (ESI) available. See DOI: 10.1039/c5ra04578a

This journal is © The Royal Society of Chemistry 2015
Click here to see how this site uses Cookies. View our privacy policy here.