 Open Access Article
Creative Commons Attribution 3.0 Unported Licence
Molecular dynamics simulation of heterogeneous nucleation on nanotubes†
Donguk Suh*a,
Kenji Yasuokaa and
Xiao Cheng Zengb
aDepartment of Mechanical Engineering, Keio University, Yokohama, Japan. E-mail: suh@mech.keio.ac.jp
bDepartment of Chemistry, University of Nebraska-Lincoln, Lincoln, Nebraska, USA
First published on 29th April 2015
Abstract
Vapour-to-liquid nucleation of argon on silicon nanotubes is studied by means of classical molecular dynamics. The aim of this simulation study is primarily to address the question of whether condensation is faster on the inner surface or on the outer surface of the nanotube. A constant particle number, volume and temperature ensemble was used for the molecular dynamics simulation with the system having different supersaturation ratios, tube lengths, and pore sizes. For a larger pore, the growth rate of droplets was higher on the inner surface, whereas for a smaller pore, a crossover occurred depending on the supersaturation ratio. Pore plugging was strongly affected by the tube diameter, where initial clogging was critical in expediting the filling process inside the tube. Furthermore, in order to examine how the pore existence affects the surrounding vapour, lids on both ends of the tube were placed. In terms of growth, the open-ended tube was typically the slowest, whereas the fully filled cylinder generally gave rise to the highest growth rate.
1. Introduction
Nanotubes have attracted considerable interest due to their novel thermophysical and electrochemical properties that can be exploited in various technological applications. Recent studies have found black carbon emissions to be in the form of nanotubes,1 and other studies find that nanotubes can be also used to grow crystals and nanowires within the pores.2,3 Another application of nanotubes is to confine and store elements and molecules such as hydrogen,4 lithium5,6 and methane.7 Most of these applications involve a phase transition inside the nanotube or on the surface of the tube (nucleation and/or condensation). The first theoretical and simulation studies on nucleation and condensation in nanotubes, however, actually started, before the advent of the term “nanotube”, as cylindrical pores.8–17 A variety of topics ranging from capillary condensation, adsorption, phase coexistence, and hysteresis were examined by molecular dynamics (MD), variations of Monte Carlo simulations and classical density functional theory. Even after the term “nanotube” became more popular to the public, the studies on how fluids behave inside narrow pores continued under the concept of confinement.18–33 With rapid advancement in computational power, MD has become one of the primary tools in studying nanoscale confinement because dynamical properties can be extracted without any closure problems. To our knowledge, the first study on nanoscale confinement by MD was for planar slit pores.34 Numerous studies followed for different pore geometries,11,17,35–40 mixtures of substances,19,21,41,42 and combination of phases within the pore.14,20,21,30,43–47Contrary to previous studies that mostly focused on the filling and emptying of a fixed pore; the present study focuses on the simultaneous adsorption of supersaturated vapour on the outer and inner surface of the nanotube. The aim of this simulation study is to address the question whether condensation is faster on the inner surface or on the outer surface of the nanotube. The study is also an extension on how different precursor particles alter the homogeneous and heterogeneous nucleation characteristics in a bulk vapour system.48,49 The goal is to see what different nucleation characteristics a seed particle with a pore would have compared with simple spherical and cubic particles. The seed in this article is a nanotube, and supersaturated argon vapour is the component condensing (growing) on the tube. The following section explains more details of the simulation setup of the system, followed by the section of results.
2. Simulation setup and methods
A single-walled silicon nanotube (SiNT) is immersed inside a cubic periodic system with supersaturated argon vapour. The constant number, volume and temperature ensemble was used for the molecular dynamics simulation, so that the supersaturation ratios (S) could be controlled by changing the temperature of the system. Nine supersaturation ratios, 2.22, 3.04, 4.27, 5.11, 6.17, 7.15, 8.12, 9.25, and 10.23, were considered, where the S values correspond to 114.96, 109.8, 104.64, 102.06, 99.48, 97.6, 96.00, 94.32, and 93.20 K, respectively.50 A previous study51 on the homogeneous nucleation of the aforementioned S values shows that no spontaneous nucleation is observed below 6.17, which implies a critical S value to exist between 5.11 and 6.17. 21![[thin space (1/6-em)]](https://www.rsc.org/images/entities/char_2009.gif) 952 atoms were treated as argon vapour, but among them 10
952 atoms were treated as argon vapour, but among them 10![[thin space (1/6-em)]](https://www.rsc.org/images/entities/char_2009.gif) 000 were modified to act as a carrier gas by omitting the attractive part of the Lennard-Jones (LJ) 12-6 potential and applying velocity rescaling to control the temperature. At the onset of nucleation, there is a sudden drop in monomer number density, but as the simulation progresses there is also a semi-constant monomer density region between 0.5–1.5 ns. This is where nucleation takes place and naturally the nucleation and growth rates are calculated from this constant monomer density region. This phenomenon and methodology are well-documented in Suh and Yasuoka,48 and the authors have confirmed the same happens for the current systems.
000 were modified to act as a carrier gas by omitting the attractive part of the Lennard-Jones (LJ) 12-6 potential and applying velocity rescaling to control the temperature. At the onset of nucleation, there is a sudden drop in monomer number density, but as the simulation progresses there is also a semi-constant monomer density region between 0.5–1.5 ns. This is where nucleation takes place and naturally the nucleation and growth rates are calculated from this constant monomer density region. This phenomenon and methodology are well-documented in Suh and Yasuoka,48 and the authors have confirmed the same happens for the current systems.
The dimensions and the number of atoms (N) comprising the seed are in Table 1. All length dimensions are nondimensionalized by the silicon molecular length σSi = 2.2 Å. The potential energy well depth for silicon was εSi = 1.39 × 10⁻²¹ J (100.0 K)52 and typical LJ parameters for argon were used, where σAr = 3.405 Å and εAr = 1.67 × 10⁻²¹ J (119.8 K). The target (argon)-seed (silicon) and seed–seed interactions are essentially LJ interactions based on the Lorentz–Berthelot relations. The seed itself was constrained by the RATTLE method53 rendering a short Δt of 1.0 fs necessary. Four types of tubes, which have combinations of short/long length and small/large diameter, were examined. Short length is denoted as L1 and small diameter as D1, whereas the larger dimensions are labelled with 2. The chirality for type D1 was (10, 0), whereas type D2 was (20, 0), where truncation of the tube was performed based on the tube length. The two ends of SiNT were not terminated by hydrogen. Furthermore, the aspect ratio is the length of the tube divided by the diameter. The system volume changed proportionally with the number of atoms in the seed. The length of one side of the cubic box was 111.4σSi, 111.8σSi, and 112.7σSi for the smallest to the largest seed sizes, respectively.
| Type | N | Diameter | Length | Aspect ratio | Surface area |
|---|---|---|---|---|---|
| L1D1 | 250 | 5.78 | 18.9 | 3.27 | 693 |
| L1D2 | 500 | 11.4 | 18.9 | 1.65 | 1353 |
| L2D1 | 500 | 5.78 | 38.2 | 6.61 | 1387 |
| L2D2 | 1000 | 11.4 | 38.2 | 3.35 | 2706 |
In MD simulation, the time integration was performed by the velocity Verlet algorithm, and a cutoff radius of 4.5σSi was used for truncation throughout the entire simulation without shifting. To identify whether two atoms are in the same cluster, a Stillinger radius of 1.8σSi was used.54 Five replications were conducted for each seed type to obtain better statistics for computing the nucleation and growth (condensation) rates, the data from the five replications were merged into one in order to apply the Yasuoka–Matsumoto (YM) method.55,56 Details of the YM method and the rationale to its use are thoroughly explained by Suh and Yasuoka.48,49
3. Results and discussion
3.1 Nanotube
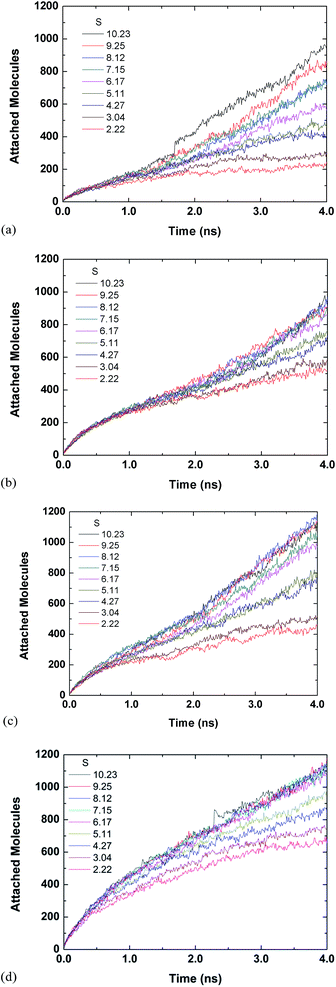
The time evolution of condensation on the outside of the tube is in Fig. 2, where, unlike the inside growth, there is an inclining tendency throughout the observation time. For large pores, however, there is an inflection point, where the initial slope of the incline is steeper than the latter. This change for large pores is caused by the difference between the rate of growth from direct bombardment onto the tube and thermodynamics from the supersaturation. For small pores, the bombardment rate is similar to high supersaturation conditions, but as S decreases the tendencies follow those of the large pore. The supersaturation influence is more definite for the outside growth than for the inside growth. As time evolves the divergence of the lower S values from the mainstream is evident. The larger diameter tubes shows less scatter for the mainstream (S values higher than 6).
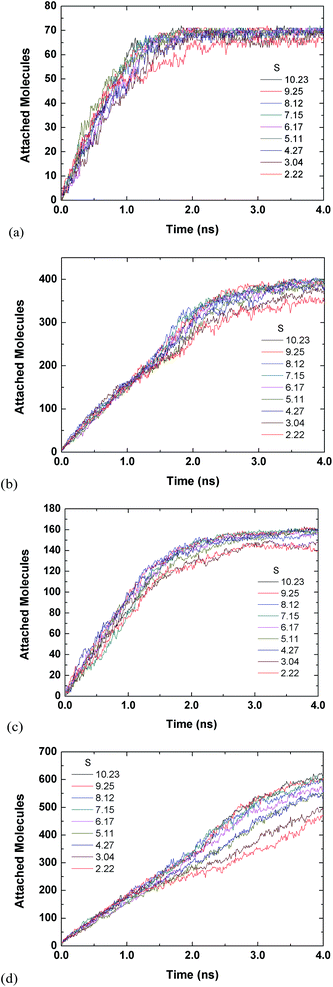
Fig. 3 and 4 are for both the inside and outside growth for single S values of 2.22 and 10.23, respectively. The growth for the inside has a relatively smooth increase and eventual plateau (except for L2D2) for higher supersaturation ratios and smaller tube diameters. The smaller pores are easier to fill and once they are filled the condensed vapour molecules do not have room to diffuse like the larger pore. Furthermore, the filling is faster for the higher supersaturation and thus the effect is accelerated. The slight jumps in Fig. 4(a) and (d) are from spontaneously formed droplets coalescing onto the tube surface.
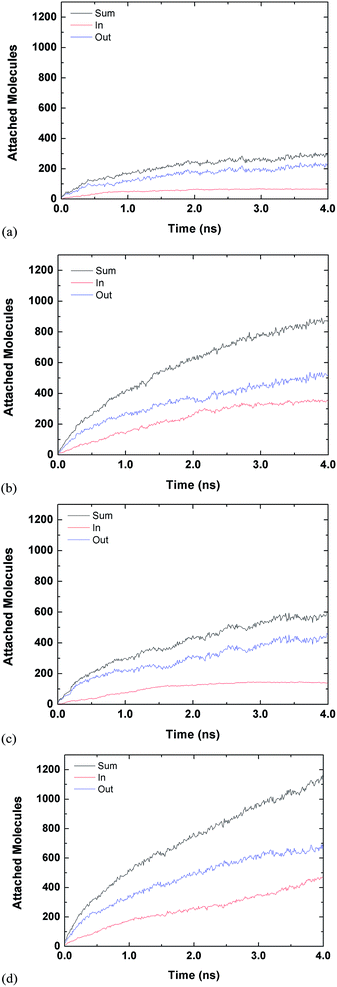 | ||
| Fig. 3 Time evolution of inside and outside growth for S = 2.22 (a) L1D1 (b) L1D2 (c) L2D1 and (d) L2D2. | ||
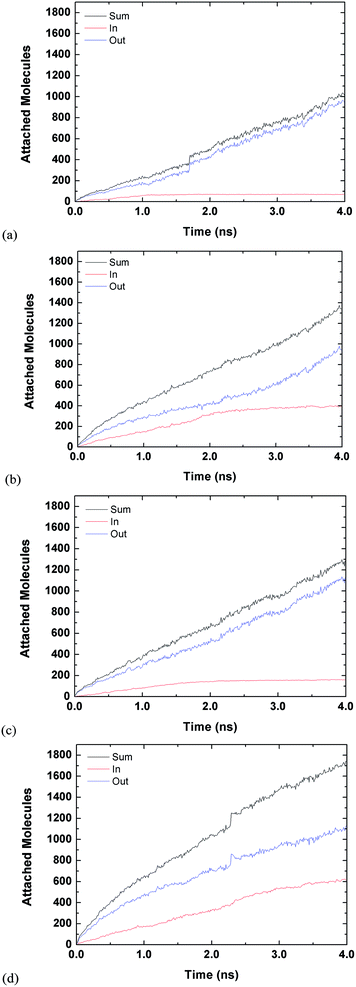 | ||
| Fig. 4 Time evolution of inside and outside growth for S = 10.23 (a) L1D1 (b) L1D2 (c) L2D1 and (d) L2D2. | ||
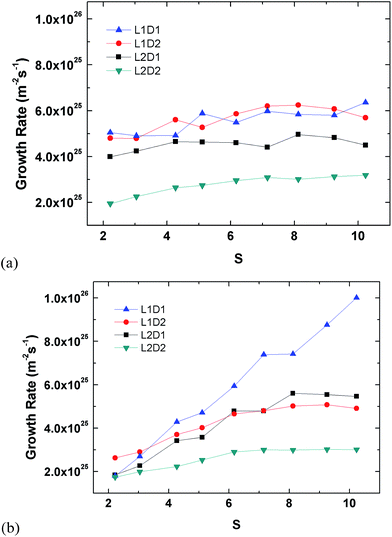
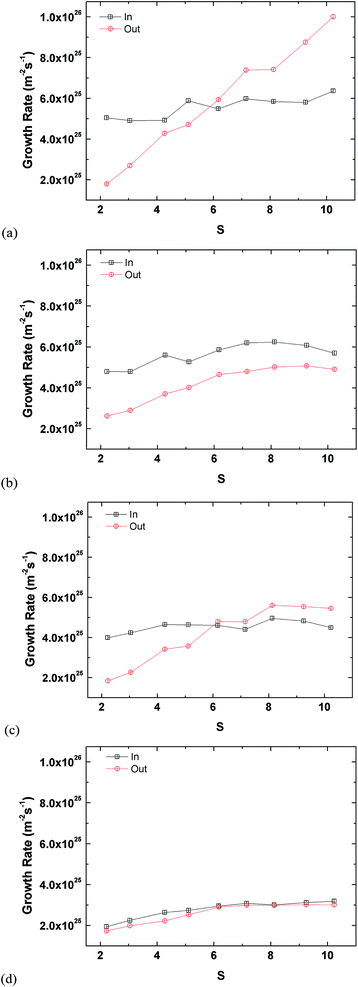
Fig. 5 presents growth rates inside and outside the tube. The growth (condensation) rate is defined as the number of argon molecules attaching onto the tube surface divided each by the inner or outer surface areas over time. Molecules inside the tube are classified by those within the confined cylindrical volume of the tube. Any other molecule outside the inner volume is considered to be attached on the outer region. Fig. 5(a) shows the growth rate inside the tube. The largest tube has the lowest growth rate because it has the largest surface area. Type L2D1 has a clearly lower growth rate compared to L1D2 even though their surface areas are similar. This is because the latter can capture more argon inside the pore, which can be seen from the plateaus in Fig. S1,† and the difference in the rate of capture between the two is insignificant. Furthermore, the inner growth rate for L1D2 is comparable to L1D1 even though the latter has a smaller surface area, again because more argon can be saturated inside the tube. Based on the potential amount of saturation within the pore, the packing time is defined as the time the tube reaches 95% saturation for the first time. The amount of complete saturation is taken from the latter part of the plateaus in Fig. 1. Although L2D2 does not reach complete saturation, the latter 0.25 ns of the data is averaged and used as the saturated value. The packing times of L1D1, L1D2, L2D1, and L2D2, are 1.33 ns, 2.92 ns, 2.46 ns, and 3.41 ns, respectively. The narrow tube has a lower packing time due to the smaller pore volume.
Although there is a slight correlation between the growth rate inside the tube and the supersaturation ratio, it is weaker than that shown in Fig. 5(b), which shows the growth rates for the outside of the tube. For growth on the outside of the tube, the smallest tube clearly has the most influence of S, whereas the largest tube does not react as much to S, even though there is a clear increase and eventual saturation in the overall growth rate. Moreover, the growth rates for L2D2 for the inside and outside are comparable since the inside of the tube has enough volume to accommodate all condensing vapour molecules. Interestingly, for L1D2 the outer growth rate for the lowest supersaturation ratio is higher than other types, which is related to the higher growth rate for the inside of the tube. When the inside of the tube is filled, the condensed molecules on the inner surface apply additional attraction to the molecules on the outside because the cutoff radius of the vapour molecules is larger than the condensed monolayer thickness. This additional attraction is weaker for L2D1 since the inner growth rate and packing in the volume is lower. Furthermore, as S increases, the additional attraction becomes insignificant since condensation is more prevalent for higher supersaturation conditions.
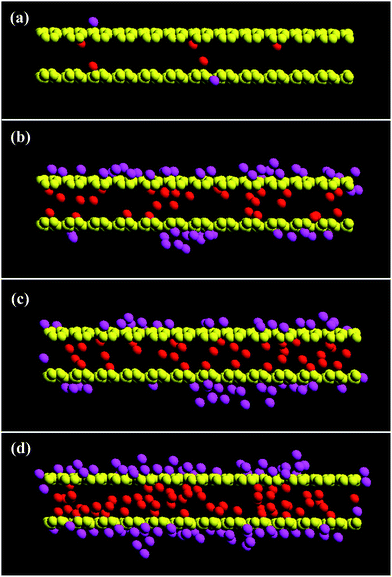
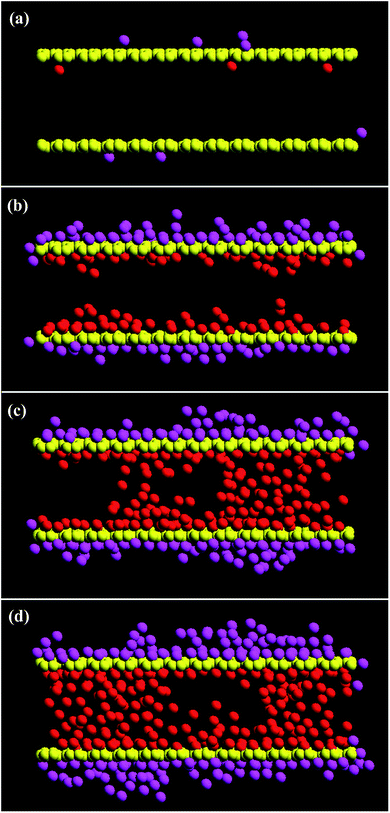
Fig. 6 and 7 provide snapshots of the slice plots with regards to the growth process for the L2D1 and L2D2 tubes, respectively. According to the figures, a temporal liquid wall is stochastically assembled perpendicular to the surface within the tube, which traps vapour molecules that could have simply tunnelled through beforehand, further accelerating the packing process. The narrow pores can only retain three atomic layers, so the temporal walls that are not stationary, form and dissipate during the packing process, which is visible within the short interval of 0.01 ns in Fig. 6(b) and (c) showing very different vapour deposition within the pore. For larger diameters, the process takes more time and is more complex. Islands form on the completely wetted surface and these islands need to coincide with those that grow on the other side of the tube (Fig. 7(b) and (c)). Depending on the interaction strength between the substrate and the vapour molecules, the initial amount of wetting on the surface will vary. According to previous studies,12,14,34,35 liquid menisci form within the pore at both ends, but here that is not the case. Moreover, temporal cavities or bubbles are actually commonly observed within the volume before packing is complete (Fig. 6(d) and 7(d)). Basically the same packing phenomenon occurs for the shorter tubes at a faster pace.
The answer to the question on whether the vapour condenses faster inside or outside of the tube is illustrated in Fig. 8. According to the plots, the answer is evidently not as simple as the question because there is a clear discrepancy in the phenomena depending on the pore size. For large pores (L1D2 and L2D2), the growth inside is faster than the outside for all supersaturation ratios. Though the extent of the difference in the condensation for inside and outside decreases as the tube length becomes longer, the overall tendency persists. For small pores (L1D1 and L2D1), however, there is a crossover effect, where at relatively low supersaturation ratios, inside growth is faster than the outside, and condensation occurs more quickly for the outside at high S values. As in the case of the large pores, this tendency is more obvious for the shorter tube (L1D2). Furthermore, the crossover point is around the critical supersaturation ratio, which was the threshold value, where homogeneous nucleation can first be observed. This means the condensation rate is affected by the homogeneous nucleation characteristics of the system, which is directly proportional to the supersaturation ratio. As previously stated, condensation inside the tube is not as affected by S as much as the outside, so the origin of the crossover effect is simply the difference for the condensation rate on the inside and outside of the tube. For larger pores, the independence on supersaturation for the inside becomes weaker, making the growth rate for both the inside and outside in parallel with S.
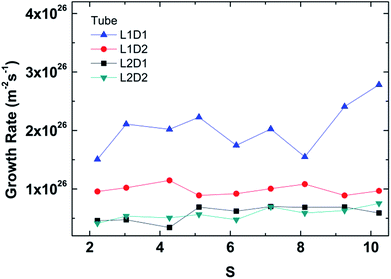
The overall growth rate for the tube is depicted in Fig. 9. Note that the overall growth rate is not the simple sum of the inside and outside growth rate in Fig. 5 since the inner and outer surface areas used in the calculation are different. Unlike the separate growth rates for inside and outside, the overall growth rates show an independence from the supersaturation ratio like previous studies.48,49 The smallest seed (L1D1) clearly is fastest because of the smallest surface area, but the second fastest is interestingly L1D2. This is because a larger pore has more packing than a tube with a smaller diameter. The rate of condensation for large-diameter tubes overtakes the surface area effect.
3.2 Closed ended tubes (hollow and filled cylinders)
In order to understand how the existence of the pore affects homogeneous nucleation and condensation on the seed, lids on both ends of the tube were placed, making the tube a hollow cylinder. Moreover, to check how the increase in the mass of the tube would affect condensation, the hollow cylinder was filled with Si atoms. The process of creating the filled cylinder was by simply making a multi-walled nanotube. The overall dimensions of the seed did not change from the initial tube in Table 1. There is a difference, however, in the number of atoms of the new seeds and the surface area. The surface areas for the cylinders have a couple of additional circular flat lids besides the outer surface area, where the tube had an inside as well. The system volume was not changed for each seed type even though the number of atoms in each seed increased for the cylinders to compare the seed in the same supersaturation conditions. The summaries for the hollow and filled cylinders are in Tables 2 and 3, respectively.| Type | N | Diameter | Length | Aspect ratio | Surface area |
|---|---|---|---|---|---|
| L1D1 | 274 | 5.78 | 18.9 | 3.27 | 552.5 |
| L1D2 | 610 | 11.4 | 18.9 | 1.65 | 1496 |
| L2D1 | 524 | 5.78 | 38.2 | 6.61 | 940.0 |
| L2D2 | 1110 | 11.4 | 38.2 | 3.35 | 2190 |
| Type | N | Diameter | Length | Aspect ratio | Surface area |
|---|---|---|---|---|---|
| L1D1 | 527 | 5.78 | 18.9 | 3.27 | 552.5 |
| L1D2 | 1852 | 11.4 | 18.9 | 1.65 | 1496 |
| L2D1 | 1052 | 5.78 | 38.2 | 6.61 | 940.0 |
| L2D2 | 3702 | 11.4 | 38.2 | 3.35 | 2190 |
The mass effect for the cylinder was investigated because the cutoff radius exceeds the monolayer thickness on the outer surface of the tube and thus the condensed vapour molecules will most likely interact with the filled Si atoms in the inside of the filled cylinder.
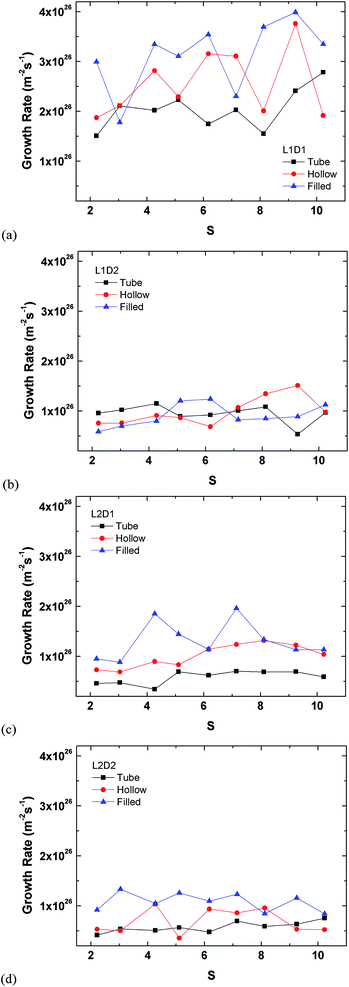
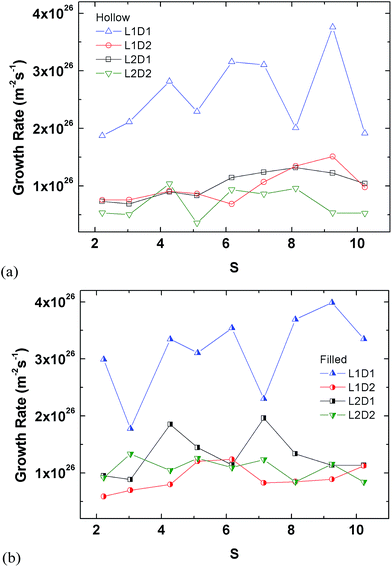
The plots in Fig. 12 are rearrangements of the data in Fig. 11 minus that of Fig. 9, which already showed the results for the tube. The smallest seed type (L1D1) clearly has the highest growth rate in all cases, whereas the other three types show similar rates.
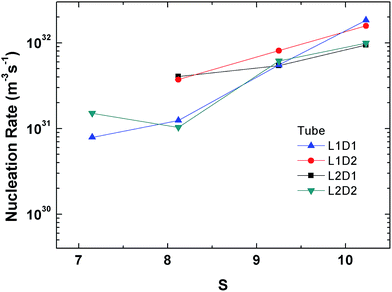
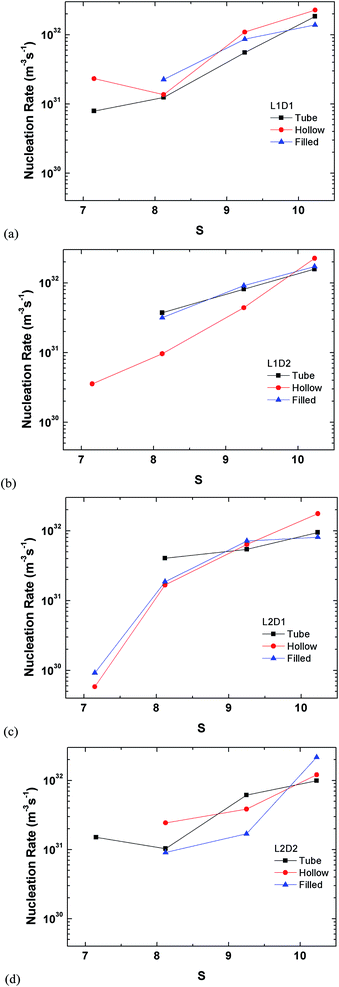
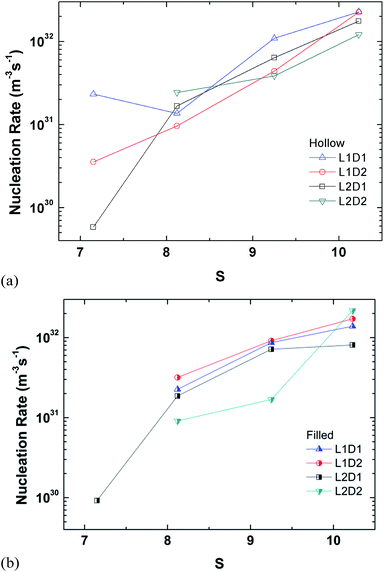
The perspective of the data was changed in Fig. 14 for just the hollow and filled cylinder, but again, no clear pattern is observable. The only consistent fact is that the nucleation rate generally increases with the supersaturation ratio, which was explained previously.
4. Conclusion
Heterogeneous vapour-to-liquid nucleation on silicon nanotubes was studied by classical molecular dynamics simulation. A fundamental question addressed was whether droplet growth is faster on the inner surface or on the outer surface of the nanotube. The answer, however, was not uniform because it can vary, depending on the pore size. For a large pore the growth rate inside was higher, but for a small pore, a crossover occurred due to the degree of supersaturation. To examine the influence of the pore, lids on both ends were placed. Mass effects of the cylinder were also investigated. In terms of growth the tube typically was the slowest; furthermore, the filled cylinder generally had the highest growth rate. The critical supersaturation ratio increased for homogeneous nucleation. Finally, although the quantitative results from this study may differ, depending on the material chosen for the tube or the vapour, we believe the qualitative trend will be the same.Notes and references
- S. Banerjee, S. N. Tripathi, U. Das, R. Ranjan, N. Jadhav, V. P. Singh, C. Jariwala, S. Sonkar and S. Sarkar, J. Appl. Phys., 2012, 112, 024901 CrossRef.
- Y. F. Li, H. Li, F. W. Sun, X. Q. Zhang and K. M. Liew, J. Appl. Phys., 2011, 110, 014307 CrossRef.
- Q. X. Liu, C. X. Wang, S. W. Li, J. X. Zhang and G. W. Yang, Carbon, 2004, 42, 629–633 CrossRef CAS.
- Y. Y. Xia, M. W. Zhao, Y. C. Ma, X. D. Liu, M. J. Ying and L. M. Mei, Phys. Rev. B: Condens. Matter Mater. Phys., 2003, 67, 115117 CrossRef.
- M. W. Zhao, Y. Y. Xia and L. M. Mei, Phys. Rev. B: Condens. Matter Mater. Phys., 2005, 71, 165413 CrossRef.
- M. W. Zhao, Y. Y. Xia, X. D. Liu, Z. Y. Tan, B. D. Huang, F. Li, Y. J. Ji and C. Song, Phys. Lett. A, 2005, 340, 434–439 CrossRef CAS.
- V. Ortiz, Y. M. Lopez-Alvarez and G. E. Lopez, Mol. Phys., 2005, 103, 2587–2592 CrossRef CAS.
- A. A. Gorbunov, E. B. Zhulina and A. M. Skvortsov, Polymer, 1982, 23, 1133–1142 CrossRef CAS.
- Z. M. Tan, F. van Swol and K. E. Gubbins, Mol. Phys., 1987, 62, 1213–1224 CrossRef CAS.
- U. Heinbuch and J. Fischer, Chem. Phys. Lett., 1987, 135, 587–590 CrossRef CAS.
- P. J. M. Carrott, R. A. Roberts and K. S. W. Sing, Chem. Ind., 1987, 855–856 CAS.
- G. S. Heffelfinger, F. van Swol and K. E. Gubbins, Mol. Phys., 1987, 61, 1381–1390 CrossRef CAS.
- A. Z. Panagiotopoulos, Mol. Phys., 1987, 62, 701–719 CrossRef CAS.
- B. K. Peterson and K. E. Gubbins, Mol. Phys., 1987, 62, 215–226 CrossRef CAS.
- G. S. Heffelfinger, Z. Tan, K. E. Gubbins, U. M. B. Marconi and F. van Swol, Int. J. Thermophys., 1988, 9, 1051–1060 CrossRef CAS.
- B. K. Peterson, K. E. Gubbins, G. S. Heffelfinger, U. M. B. Marconi and F. van Swol, J. Chem. Phys., 1988, 88, 6487–6500 CrossRef CAS.
- S. Sokolowski and J. Fischer, Mol. Phys., 1990, 71, 393–412 CrossRef CAS.
- S. Sokolowski, Mol. Phys., 1992, 75, 1301–1327 CrossRef CAS.
- L. D. Gelb and K. E. Gubbins, Physica A, 1997, 244, 112–123 CrossRef CAS.
- L. D. Gelb and K. E. Gubbins, Phys. Rev. E: Stat. Phys., Plasmas, Fluids, Relat. Interdiscip. Top., 1997, 56, 3185–3196 CrossRef CAS.
- L. D. Gelb and K. E. Gubbins, Phys. Rev. E: Stat. Phys., Plasmas, Fluids, Relat. Interdiscip. Top., 1997, 55, R1290–R1293 CrossRef CAS.
- G. K. Papadopoulos, D. Nicholson and S. H. Suh, Mol. Simul., 1999, 22, 237–256 CrossRef CAS.
- L. D. Gelb and K. E. Gubbins, Mol. Phys., 1999, 96, 1795–1804 CrossRef CAS.
- L. D. Gelb, K. E. Gubbins, R. Radhakrishnan and M. Sliwinska-Bartkowiak, Rep. Prog. Phys., 1999, 62, 1573–1659 CrossRef CAS.
- S. Mohanty, H. T. Davis and A. V. McCormick, Chem. Eng. Sci., 2000, 55, 3377–3383 CrossRef CAS.
- L. D. Gelb, Mol. Phys., 2002, 100, 2049–2057 CrossRef CAS.
- L. Szybisz and I. Urrutia, Phys. Rev. E: Stat., Nonlinear, Soft Matter Phys., 2002, 66, 051201 CrossRef.
- A. Saugey, L. Bocquet and J. L. Barrat, J. Phys. Chem. B, 2005, 109, 6520–6526 CrossRef CAS PubMed.
- E. A. Ustinov and D. D. Do, J. Phys. Chem. B, 2005, 109, 11653–11660 CrossRef CAS PubMed.
- D. Wilms, A. Winkler, P. Virnau and K. Binder, Phys. Rev. Lett., 2010, 105, 045701 CrossRef PubMed.
- A. Winkler, D. Wilms, P. Virnau and K. Binder, J. Chem. Phys., 2010, 133, 164702 CrossRef CAS PubMed.
- P. T. M. Nguyen, D. D. Do and D. Nicholson, J. Phys. Chem. C, 2011, 115, 4706–4720 CAS.
- Y. Wang, D. D. Do and D. Nicholson, Colloids Surf., A, 2011, 380, 66–78 CrossRef CAS.
- J. J. Magda, M. Tirrell and H. T. Davis, J. Chem. Phys., 1985, 83, 1888–1901 CrossRef CAS.
- R. Evans, U. M. B. Marconi and P. Tarazona, J. Chem. Soc., Faraday Trans. 1, 1986, 82, 1763–1787 Search PubMed.
- S. Ozeki, Y. Masuda, Y. Nishimoto and T. Henmi, Water in Spherical, Cylindrical and Slitlike Pores, Elsevier Science Publ B V, Amsterdam, 1994 Search PubMed.
- K. Yasuoka, G. T. Gao and X. C. Zeng, J. Chem. Phys., 2000, 112, 4279–4285 CrossRef CAS.
- K. T. Kholmurodov, K. Yasuoka and X. C. Zeng, J. Chem. Phys., 2001, 114, 9578–9584 CrossRef CAS.
- A. G. Cherstvy, Biopolymers, 2012, 97, 311–317 CrossRef CAS PubMed.
- A. J. Page and R. P. Sear, Phys. Rev. Lett., 2006, 97, 065701 CrossRef PubMed.
- G. S. Heffelfinger, Z. M. Tan, K. E. Gubbins, U. M. B. Marconi and F. van Swol, Mol. Simul., 1989, 2, 393–411 CrossRef.
- C. Nguyen and D. D. Do, J. Phys. Chem. B, 2000, 104, 11435–11439 CrossRef CAS.
- Z. P. Zhang and A. Chakrabarti, Phys. Rev. E: Stat. Phys., Plasmas, Fluids, Relat. Interdiscip. Top., 1994, 50, R4290–R4293 CrossRef CAS.
- C. Alba-Simionesco, B. Coasne, G. Dosseh, G. Dudziak, K. E. Gubbins, R. Radhakrishnan and M. Sliwinska-Bartkowiak, J. Phys.: Condens. Matter, 2006, 18, R15–R68 CrossRef CAS PubMed.
- P. A. Monson, Langmuir, 2008, 24, 12295–12302 CrossRef CAS PubMed.
- I. Brovchenko and A. Oleinikova, J. Phys. Chem. B, 2010, 114, 16494–16502 CrossRef CAS PubMed.
- C. Marcolli, Atmos. Chem. Phys., 2014, 14, 2071–2104 CrossRef.
- D. Suh and K. Yasuoka, J. Phys. Chem. B, 2011, 115, 10631–10645 CrossRef CAS PubMed.
- D. Suh and K. Yasuoka, J. Phys. Chem. B, 2012, 116, 14637–14649 CrossRef CAS PubMed.
- P. J. Linstrom and W. G. Mallard, NIST Chemistry WebBook, NIST Standard Reference Database Number 69, National Institute of Standards and Technology, Gaithersburg MD, 20899, http://webbook.nist.gov, 2010.
- D. Suh, W. Yoon, M. Shibahara and S. Jung, J. Chem. Phys., 2008, 128, 154523 CrossRef CAS PubMed.
- P. M. Zimmerman, M. Head-Gordon and A. T. Bell, J. Chem. Theory Comput., 2011, 7, 1695–1703 CrossRef CAS.
- M. P. Allen and D. J. Tildesley, Computer Simulation of Liquids, Oxford University Press, USA, New York, 1989 Search PubMed.
- F. H. Stillinger Jr, J. Chem. Phys., 1963, 38, 1486–1494 CrossRef.
- K. Yasuoka and M. Matsumoto, J. Chem. Phys., 1998, 109, 8451–8462 CrossRef CAS.
- G. Chkonia, J. Wolk, R. Strey, J. Wedekind and D. Reguera, J. Chem. Phys., 2009, 130, 064505 CrossRef PubMed.
- D. Kashchiev, Nucleation: Basic Theory with Applications, Butterworth Heinemann, Oxford, Boston, 2000 Search PubMed.
- V. I. Kalikmanov, J. Wolk and T. Kraska, J. Chem. Phys., 2008, 128, 124506 CrossRef CAS PubMed.
Footnote |
| † Electronic supplementary information (ESI) available. See DOI: 10.1039/c5ra04398k |
| This journal is © The Royal Society of Chemistry 2015 |

