Elucidation of the wettability of graphene through a multi-length-scale investigation approach

Carlo A. Amadeiab, Chia-Yun Laib, Maria José Esplandiua, Francesc Alzinaa, Chad D. Vecitisc, Albert Verdaguera and Matteo Chiesa*b
aICN2 – Institut Catala de Nanociencia i Nanotecnologia, CSIC – Consejo Superior de Investigaciones Cientificas, ICN2 Building, Campus UAB, 08193 Bellaterra, Barcelona, Spain
bLaboratory for Energy and NanoScience (LENS), Institute Center for Future Energy (iFES), Masdar Institute of Science and Technology, PO Box 54224, Abu Dhabi, UAE. E-mail: mchiesa@masdar.ac.ae
cSchool of Engineering and Applied Sciences, Harvard University, Cambridge, MA, USA 02138

Received 12th March 2015 , Accepted 21st April 2015

First published on 23rd April 2015


Abstract

Univocal conclusions around the wettability of graphene exposed to environmental conditions remain elusive despite the recent efforts of several research groups. The main discrepancy rests on the question of whether a graphene monolayer (GML) is transparent or not to water and more generally what the role is that the substrate plays in determining the degree of wetting of the GML. In this work, we investigate the water transparency of GML by means of a multi-length-scale approach. We complement traditional static contact angle measurements and environmental scanning electron microscopy experiments with atomic force microscopy based force spectroscopy to assess the role that intermolecular interactions play in determining the wetting of GML. To gain deeper insight into the wetting transparency issue, we perform experiments on inert metals, such as gold and platinum, covered or not covered by GML. The comparison of the results obtained for different systems (i.e. GML covered and uncovered inert metals), provides unambiguous evidence that supports the non-wetting transparency theory of GML. This work aims to assist the development of technologies based on graphene–water interaction, such as graphitic membranes for water separation processes.
Introduction

Graphene is a single layer sp2 lattice of carbon atoms, organized in a honeycomb atomic configuration. Since its first isolation by Novoselov and Geim in 2004,1 graphene has attracted the interest of the scientific community which has investigated the properties of this fascinating 2D material system.2 The superior properties of graphene span from electrical3 and thermal4 conductivity to mechanical stiffness,5 elasticity6 and optical transparency.7 It is the combination of such properties that may lead graphene to replace other materials in existing applications8 or, more importantly, could trigger the fantasy of researchers in the conception of new applications.9

As a 2D material, graphene's surface chemistry is an important aspect to evaluate when graphene interacts with its surrounding. The latter can be represented by water or air, in applications for which graphene is implemented as ion-filtration membrane,10,11 gas barrier respectively12–14 or self-cleaning coating.15,16 Alternatively, the surroundings can be also represented by the human organism, if graphene is used in biomedical applications, such as tissue engineering17 or drug delivery,18 as promising results demonstrated.19 For all these possible applications carefully determining the interaction between graphene and its environment20 will assist researchers in tailoring and optimizing the functionality of graphene-based applications.

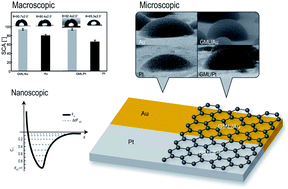
In this context, graphene–water is one of the most fundamental interactions and it has been recently investigated by several research groups. However, a controversial scenario emerges from these studies, which can be summarized with the following question: “Is a monolayer of graphene transparent to water–substrate interactions or not?” Rafiee et al.21 stated that a graphene monolayer (GML) on top of a metal substrate is wetting transparent to long-range (i.e. up to 5 nm) van der Waals (vdW) forces, whereas the transparency is lost, if the substrate forms short-range chemical bonds (i.e. H-bond) with water. By contrast, Raj et al.22 rejected the graphene wetting transparency theory demonstrating that the type of interaction and the role of the substrate is negligible. A further model was proposed by Shih et al.23 suggesting that graphene wetting transparency depends on the wettability of the substrate. Recently, Li et al.24 reported a transition in the wettability of graphene from hydrophilic to hydrophobic behaviour after exposed to the ambient air. The cause of this transition is explained with the adsorption of hydrocarbon contaminants on graphene surface,25 which echoes earlier investigations on the wettability transition of graphitic surfaces.26 The adsorption of molecules from the atmosphere, demonstrated on graphitic surfaces27 by means of atomic force microscope (AFM) and spectroscopy techniques,28,29 can represent the root of the debate around the wettability of graphene. Research groups may have analysed the same graphene system, but decorated with different adsorbed molecules, and this might have led to different experimental results, such as contact angle measurements. Furthermore, the discrepancy in the literature extends also to modelling efforts, such as molecular dynamics (MD) simulations. Disagreement between theoretical simulations can be attributed to the different water–carbon interaction model employed30 or different input parameters. For instance the cut-off distance used by Shih et al. (i.e. 0.9 nm) is less than half compared to the one used by Raj et al. (i.e. 2 nm). This highlights the need for nanoscale measurements, which can shed light on the fundamental interaction between water and graphene-based systems.31 This work aims to study the wettability of graphene from macro- to nano-scale dimensions. The investigation is carried out on surfaces after being exposed for days to environmental conditions in order to study stable systems, which are not subjected to time-dependent wettability.24,25 Moreover, exposed surfaces can represent models samples, when graphene will be applied in applications under ambient conditions. Traditional contact angle studies are employed to examine the macroscopic wettability of graphene. Environmental scanning electron microscope (ESEM) allows imaging droplets of circa 10 μm, accessing to the micron-range-wettability. Finally, by means of AFM we reconstruct the force profile between the tip and the substrate,32 evaluating the nanoscale interaction. All our experiments are carried out for a GML grown via chemical vapor deposition (CVD) on platinum (Pt) and GML mechanically transferred onto gold (Au) foil (see ESI). The results are then compared with those obtained on the bare substrates (i.e. Pt and Au). Pt and Au are chosen because of their lowest reactivity towards water and its constituting elements among metals.33,34 This yields Pt and Au resistance to corrosion and oxidation. Despite their possible hydrocarbon contaminations,35 the lowest reactivity of Pt and Au allows these metal surfaces to interact with water via vdW interactions something that makes the comparison between the GML/metal and bare metal significant for evaluating the wetting transparency of graphene. In case of comparable wettability results for GML/metal surface and bare metal at different length scale, one would confirm wetting transparency of graphene. On the other hand, incompatible wettability results between the two systems would lead to the rejection of wetting transparency theory.

Experiemental

Graphene synthesis and characterization

Graphene films were grown on Pt foils (0.025 mm thick, Premion, 99.99%, Alfa-Aesar) with low pressure chemical vapor deposition using a Lindberg blue tube furnace. The Pt foil was loaded in the furnace quartz tube followed by air evacuation up to reach a basal pressure of 2 mbar. Then a flux of Ar of 400 sccm was introduced in the furnace tube while heating up to 1020 °C. Prior to the graphene growth the sample was annealed at that temperature in presence of 400 sccm of Ar and 20 sccm of H2 during 30 minutes. After that the graphene growth was taking place by introducing 35 sccm of CH4 to the previous fluxes of Ar and H2 during 10 minutes and at the same temperature. Then the sample was fast cooling under the flow of Ar and H2. The GML/Au was purchased from Graphenea, which produced the sample according to the following procedure. The sample was prepared by growing the GML on Cu foil. Then, a wet transfer process occurred in order to deposit the graphene film on the new substrate (Au). During the process, protective polymer (PMMA) was used. Micro-Raman spectra were taken in backscattering geometry at room temperature using the 5145 Å line of an Argon+ laser with a Jobin-Yvon T-64000 spectrometer in single mode configuration and liquid-nitrogen-cooled CCD detection. The laser spot size was ∼1 μm and the laser power onto the sample was kept below 0.5 mW to avoid sample overheating.

Atomic force microscope force spectroscopy

Most of the information regarding material properties can be extracted from the force sensed by the probe when approaching the sample. The ability of recovering the force versus d from observables is defined as AFM force spectroscopy. In our investigation the AFM is operating in AM and the observable used for the force spectroscopy are the oscillation amplitude (A) and phase shift (Φ) relative to the driving force. By means of these observables we can recover the interactions between the tip and the sample, which are generally divided between conservative and dissipative interactions. For the reconstruction of the conservative part of the force, we exploited Sader–Jarvis–Katan (SJK) formalism (eqn (1)),36 which represents the evolution of the earlier formalisms proposed by Giessibl37 and Sader38 in frequency modulation (FM) AFM:
 
image file: c5ra04397b-t1.tif(1)
where Ω is the normalized frequency shift expressed by:
 
image file: c5ra04397b-t2.tif(2)
where Q is the quality factor which has been quantified by performing the standard thermal analysis a tip-sample separation of ∼50 nm. All the experiments are carried out with a Cypher AFM from Asylum Research and standard OLYMPUS cantilevers (AC160TS). The tip radius R was constantly monitored in situ to assure that no change occurs throughout the experiment. The monitoring of the tip is paramount, since it is well-known that R significantly affects the interaction force between the tip and the surface.39

The free amplitudes employed in these experiments were A0 ≈ 40 nm. These relatively large values of free amplitude implied that smooth transitions from the attractive to the repulsive regime followed throughout this work.32 Thus, no transients due to discontinuous transitions were present in the interaction40 and the relevant attractive to repulsive distances were recovered successfully without discontinuities.

The dissipative interactions are evaluated with Cleveland's equation:41

 
image file: c5ra04397b-t3.tif(3)
where all the parameters have been already described.

Contact angle measurements

Macroscopic contact angle measurements were executed with a Krüss FM40Mk2 EasyDrop contact angle instrument. The standard software supplied by Krüss was used for the evaluation of the data. SCAs were measured using 2 μL droplets and the data for each time step refers to 5 measurements. In order to determine the contact angle at the micro-scale, we employed an ESEM using FEI, Quanta 250 to investigate the surface wettability of the graphene surfaces. We achieved a static contact angle inside the ESEM (SCAESEM) chamber by carefully tuned the chamber pressure so that the droplets were condensed in a really slow manner (i.e. equilibrium). We first cooled down the sample to 0 °C while kept the chamber pressure at 100 Pa. Then we slowly increased the chamber pressure to 580 Pa and waited the system to be in equilibrium (judged by the scanning images). Finally, the chamber pressure was slowly increased to 620 Pa and the droplets were condensed. The sample stage was tilted for 7–10° in order to increase the droplets counts. Video was recorded while droplets were forming on the graphene surfaces. The droplets shape was then analyzed by ImageJ to obtain values of SCA at the micro scale.

Results and discussion

Graphene characterization

An extensive AFM study is carried out to characterize the GML/metal surface, however for clarity, the most representative data sets are reported in Fig. 1. Fig. 1a and b represent topographical images acquired via amplitude modulation (AM) for GML on Pt and on Au, respectively. In order not to perturb the system, the tip was not in contact with the surface during the acquisition and the topographical image is dictated by long range interactions (i.e. vdW). The systems are characterized by similar roughness (i.e. topography RMS is 2.4 nm and 3.5 nm for GML/Pt and GML/Au, respectively) and they present sharply corrugations that can be connected to different interfacial restructuring during the graphene growth by CVD.42,43 The roughness values are comparable to the one obtained on the bare metals surfaces (see ESI Fig. S1), thus the GML does not change the topography of the samples. Furthermore, the surfaces are clean at the micro-scale, avoiding influence of macro-contamination in the following studies of wettability. An intensity ratio of the Raman 2D and G peaks of I(2D)/I(G) > 3, together with a full width at half-maximum (FWHM) of the 2D band of ∼35 cm−1 on the Raman spectra of, both, Pt and Au systems (Fig. 1c and d) reveal the presence of monolayer graphene.44,45
image file: c5ra04397b-f1.tif
Fig. 1 GML characterization by means of AFM and Raman spectroscopy. (a and b) AFM images acquired in non-contact mode on bare Pt and Au. Scale bars are 100 nm. (c and d) Raman spectra of GML/Pt and GML/Au respectively. (e) AFM lateral force map acquired on GML/Au. Scale bar is 0.5 nm.

The presence of graphene on the surface is corroborated by a lateral force map (Fig. 1e) obtained on GML/Au. In this mode of operation, the tip is in continuous contact with the surface and the force (i.e. lateral) experienced by the tip when scanning the sample is recorded. This force is mainly due to the local topography and it allows resolving the hexagonal pattern typical of the graphene.42 However, the lattice dimension is larger than C–C bond and is due to the thermal drifting during the image acquisition. Nevertheless, this represents an important achievement, knowing the fact that the images are acquired in normal ambient conditions without additional sample preparation. A fast Fourier transform (FFT) of the hexagonal pattern is carried out in order to evaluate the crystallographic structure of the surface. Results show that the FFT is identical to the ones obtained by scanning tunneling microscope images or transmission electron microscope images46 (see ESI Fig. S2).

Wettability analysis

First, we study the macroscopic wettability of the GML/metal and bare metal for the Au and Pt system (Fig. 2). From Fig. 2a one can observe a significant difference between the water static contact angle (SCA) for GML/Au and bare Au. In particular, the SCA of GML/Au is ≈93°, which is a value 10° higher compared to the one obtained on bare Au. A similar trend was also observed by Li et al.24 when analyzing GML/Au systems. In Fig. 2b the relative behaviour between the bare Pt and the Pt covered by GML is even more evident. To our knowledge, this is the first time that the SCA for GML/Pt has been reported. Pt surface is characterized by SCA values of ≈65°, whereas GML/Pt reaches value comparable to exposed highly ordered pyrolytic graphite (HOPG)25 and GML/Au. This highlights the low influence of the metal substrate in dictating the interaction with water. Note that during SCA image acquisition, no hysteresis of the contact line (solid/liquid/vapour) is observed, indicating that the system is in thermodynamic equilibrium with the surroundings. However, the results refer to metals exposed to environmental conditions and they could be subjected to molecular adsorption. We also perform SCA on bare metal surface after annealing process (see ESI). Those surface are characterized by SCA generally smaller than the ones of exposed surfaces, strengthening our observation on the low influence of the metal substrate. Fourier transform infrared spectroscopy confirms small water adsorption from the atmosphere (i.e. 14% of increase in the spectra intensity) as the metal surface has been exposed to ambient conditions. ESI also contains dynamic contact angel analysis performed on both bare metal and graphene covers systems.
image file: c5ra04397b-f2.tif
Fig. 2 SCA analysis. (a) SCA on GML on Au and bare Au. (b) SCA on GML on Pt and bare Pt. Images illustrate the most representative contact angle for each case.

From a macroscopic point of view we moved our investigation towards the micron-range domain. With the use of ESEM, it is possible to describe the wetting behavior of the surface at the micro-scale, by analyzing the water droplets condensed on the surface. The implementation of ESEM in analyzing graphene wettability was already reported by Raj et al.22 with satisfactory results. Fig. 3a represents a typical image obtained inside the ESEM chamber where all the droplets' SCAESEM (ESEM subscript is used to distinguish between SCA obtained by traditional techniques) are evaluated and they represent the statistical population for that particular system. In Fig. 3b we display the most representative droplets for the four systems (i.e. GML/metal and bare metal for the two metals) and in Table 1 the statistical analysis (i.e. average and standard deviations of SCAESEM) is reported. The results are qualitatively in agreement with macroscopic results and they share three aspects with the macroscopic SCA. (i) Surfaces of the metal covered by GML are more hydrophobic than the bare metal. In particular, SCAESEM for GML/Au and GML/Pt is ≈15° and ≈25° higher compared to the bare Au and Pt respectively, which underlines the importance of GML in varying the surface wettability. (ii) GML covered systems are characterized by comparable SCAESEM (i.e. 75°–79°), thus implying the minimal effect of the underneath substrate. (iii) Quantitatively SCAESEM display lower values compare to traditional SCA, with a reduction in the order of 15–20%. This difference could be attributed to the fact that the ESEM stage is tilted and, thus, the observation angle is not parallel to the surface47 or to the different ESEM-chamber pressure (see ESI) compared to environmental pressure.48


image file: c5ra04397b-f3.tif
Fig. 3 SCAESEM analysis. (a) Water droplets condensed on GML/Au obtained by ESEM. The droplets construct the statistics of Table 1. (b) Single zoom of a droplet formation for the four systems (GML/Au, bare Au, GML/Pt and bare Pt). Scale bar is 50 μm and 5 μm for (a) and (b) respectively.
Table 1 SCAESEM obtained for the four systems. Mean and standard deviation values refer to 15 measurements
System SCAESEM (°)
GML/Au 79.4 ± 5.6
Au 64 ± 5.4
GML/Pt 75.9 ± 5.1
Pt 51.9 ± 4.6


Moved by the need of the research community to explore the wettability at smaller length scales,31 we proceed toward investigating the phenomena at the nanoscale length. Physically, we achieved this by exploiting a recent developed AFM force spectroscopy technique. The technique allows us to recover the conservative force field49 versus tip-sample minimum distance of approach (d) felt by the tip when interacting with the sample. The force field, Fts, is then characterized by the distance of force of adhesion (ΔdFAD, gray dash lines in Fig. 4a), which is a metric, defined as the range of horizontal distances for which Fts = C1FAD; where C1 is an arbitrary coefficient and FAD is the minima in the force field. In order to describe the force field in a complete manner, we carried out our analysis using seven different coefficients (i.e. 0.05, 0.1, 0.2, 0.35, 0.5, 0.65 and 0.8). In Fig. 4b and c the most representative normalized force fields (i.e. F*ts) for the Au systems (i.e. GML/Au and bare Au) and Pt system (GML/Pt and bare Pt) are reported. From these experimental plots, for the two graphene systems, the interaction of the GML/metal (gray lines) is shorter compared to the bare metal (black lines). For each sample, 50 force curves were randomly taken on the surface and the results are summarized in Fig. 4d and e. In Fig. 4d, it is possible to observe that ΔdFAD for bare Au (black line) is higher compared to GML/Au (gray line) for all the seven C1 coefficients used. This means that the bare metal is characterized by an interaction with the tip at larger distances as compared to the one of the GML/Au surface. From Fig. 4e, similar behaviour is obtained when the tip is interacting with the Pt system. Also in this case, the bare metal substrate (black line) interacts with the tip at larger distances as compared to the case of GML/Pt system. Quantitatively, the presence of the graphene reduces the distance of interaction of circa 20%. For instance, in the case of Au, the presence of the graphene determines a decrease of ΔdFAD from ≈0.29 Å to ≈0.23 Å and from ≈0.14 Å to ≈0.10 Å for C1 = 0.05 and C1 = 0.8 respectively. One could note that the tip interaction with the graphene covered systems present different shapes. This might be due to the fact that graphene systems are prepared with different fabrication methods (i.e. CVD and wet mechanical transfer) or to possible evolution of the graphene surface when exposed to environmental conditions.50


image file: c5ra04397b-f4.tif
Fig. 4 Tip/surface conservative interactions by means of AFM. (a) Characterization of the conservative force field (Fts, black line) by means of ΔdFAD (with gray dash lines) for different C1 coefficients. (b and c) Conservative interactions analyzed with ΔdFAD for 7 different C1 coefficients (0.05, 0.1, 0.2, 0.35, 0.5, 0.65 and 0.8) data refer to GML/Au-bare Au and GML/Pt-bare Pt. (d and e) Reconstructed conservative profiles interaction for GML/metal (gray lines) and bare metal (black lines).

We also analysed the nanoscale dissipative interactions, calculating the energy dissipation (Edis) between the oscillating tip and the surface, with the use of the Cleveland equation41 (see ESI). From Fig. 5a it is possible to see that the bare metals are characterized by higher values of Edis compared to the metals covered by GML. The increase is on the order of 10–15 eV, which can be related to additional dissipative mechanisms (i.e. capillary phenomena)51 detected by the reconstructed energy dissipation profiles. In Fig. 5b we report the most representative normalized energy dissipation profile (E*dis) for the GML/Pt and bare Pt system. The bare metal surface is characterized with an energy dissipation profile which starts at larger distance compared to the graphene covered system, in accordance with the conservative interactions. This phenomenon, in combination with the presence of inflection points (red circles), is related to capillary interaction between the tip and the surface. Note that in ambient conditions AFM tips are usually covered by a thin layer of water (i.e. less than 1 nm).51


image file: c5ra04397b-f5.tif
Fig. 5 Tip/surface dissipative interactions by means of AFM. (a) Dissipative interactions according to Cleveland's equation.41 Energy dissipation for GML on metal substrate and bare metal. Data on the left hand side and right hand side refer to Pt system and Au system respectively. (b) Normalized energy dissipation profile of Pt system. Black line represents for bare Pt and gray line represents for GML/Pt. Red circles represent inflection points related to the presence of capillary phenomena.

Conclusions

Summarizing, from SCA analysis obtained at the macro- and micro-range, it is possible to observe that only one layer of graphene changes the wetting properties of the surface, leading to different contact angles. It is well recognized that the wetting of a surface is related to its chemical and morphological properties.52,53 From AFM observations, the GML does not significantly change the roughness of the sample, thus the presence of GML dictates a different chemical state of the surface when interacting with water. This aspect highlights the low influence of the substrate and it agrees with non-transparency theory.22 Furthermore, nanoscale parameters (i.e. ΔdFAD and Edis) are able to capture the different interactions felt by the tip when oscillating in the proximity of GML/metal surface. The differences found in these two parameters demonstrate that interactions on bare metals are dominated by stronger capillary interactions at larger distances than on GML/metals, thus indicating different wetting behavior on coated and uncoated metals. The shorter conservative interactions when the tip is interacting with GML/metal systems compared to the bare metal are due to the presence of the graphene itself and its influence in shielding the surface/tip interaction. In conclusion, coherent evidences are provided at different length scales, which indicate the non-wetting transparency of graphene exposed to environmental conditions. The insights offered in this work will assist researchers when developing graphene-based applications in which interaction with water is the most important phenomenon, such as separation membranes.

Acknowledgements

A.V. and M. J. E. acknowledge financial support by the Ministerio de Economía y Competitividad (MINECO), Spain, through project MAT2012-38319-C02-01.

References

  1. K. S. Novoselov, A. K. Geim, S. V. Morozov, D. Jiang, Y. Zhang, S. V. Dubonos, I. V. Grigorieva and A. A. Firsov, Science, 2004, 306, 666–669 CrossRef CAS PubMed.
  2. A. K. Geim, Science, 2009, 324, 1530–1534 CrossRef CAS PubMed.
  3. A. H. C. Neto, F. Guinea, N. M. R. Peres, K. S. Novoselov and A. K. Geim, Rev. Mod. Phys., 2009, 81, 109–162 CrossRef.
  4. A. A. Balandin, Nat. Mater., 2011, 10, 569–581 CrossRef CAS PubMed.
  5. C. Lee, X. Wei, J. W. Kysar and J. Hone, Science, 2008, 321, 385–388 CrossRef CAS PubMed.
  6. C. Gómez-Navarro, M. Burghard and K. Kern, Nano Lett., 2008, 8, 2045–2049 CrossRef PubMed.
  7. K. S. Kim, Y. Zhao, H. Jang, S. Y. Lee, J. M. Kim, K. S. Kim, J.-H. Ahn, P. Kim, J.-Y. Choi and B. H. Hong, Nature, 2009, 457, 706–710 CrossRef CAS PubMed.
  8. S. Bae, H. Kim, Y. Lee, X. Xu, J.-S. Park, Y. Zheng, J. Balakrishnan, T. Lei, H. Ri Kim, Y. I. Song, Y.-J. Kim, K. S. Kim, B. Ozyilmaz, J.-H. Ahn, B. H. Hong and S. Iijima, Nat. Nanotechnol., 2008, 5, 574–578 CrossRef PubMed.
  9. K. S. Novoselov, V. I. Fal'ko, L. Colombo, P. R. Gellert, M. G. Schwab and K. Kim, Nature, 2012, 490, 192–200 CrossRef CAS PubMed.
  10. D. Cohen-Tanugi and J. C. Grossman, Nano Lett., 2012, 12, 3602–3608 CrossRef CAS PubMed.
  11. S. C. O'Hern, M. S. H. Boutilier, J.-C. Idrobo, Y. Song, J. Kong, T. Laoui, M. Atieh and R. Karnik, Nano Lett., 2014, 14, 1234–1241 CrossRef PubMed.
  12. L. W. Drahushuk and M. S. Strano, Langmuir, 2012, 28, 16671–16678 CrossRef CAS PubMed.
  13. H. W. Kim, H. W. Yoon, S.-M. Yoon, B. M. Yoo, B. K. Ahn, Y. H. Cho, H. J. Shin, H. Yang, U. Paik, S. Kwon, J.-Y. Choi and H. B. Park, Science, 2013, 342, 91–95 CrossRef CAS PubMed.
  14. K. Celebi, J. Buchheim, R. M. Wyss, A. Droudian, P. Gasser, I. Shorubalko, J.-I. Kye, C. Lee and H. G. Park, Science, 2014, 344, 289–292 CrossRef CAS PubMed.
  15. S. Pan, R. Guo and W. Xu, Soft Matter, 2014, 10, 9187–9192 RSC.
  16. S. Anandan, T. Narasinga Rao, M. Sathish, D. Rangappa, I. Honma and M. Miyauchi, ACS Appl. Mater. Interfaces, 2013, 5, 207–212 CAS.
  17. L. Zhang, Z. Wang, C. Xu, Y. Li, J. Gao, W. Wang and Y. Liu, J. Mater. Chem., 2011, 21, 10399–10406 RSC.
  18. V. K. Rana, M.-C. Choi, J.-Y. Kong, G. Y. Kim, M. J. Kim, S.-H. Kim, S. Mishra, R. P. Singh and C.-S. Ha, Macromol. Mater. Eng., 2011, 296, 131–140 CrossRef CAS PubMed.
  19. V. C. Sanchez, A. Jachak, R. H. Hurt and A. B. Kane, Chem. Res. Toxicol., 2011, 25, 15–34 CrossRef PubMed.
  20. Y. J. Shin, Y. Wang, H. Huang, G. Kalon, A. T. S. Wee, Z. Shen, C. S. Bhatia and H. Yang, Langmuir, 2010, 26, 3798–3802 CrossRef CAS PubMed.
  21. J. Rafiee, X. Mi, H. Gullapalli, A. V. Thomas, F. Yavari, Y. Shi, P. M. Ajayan and N. A. Koratkar, Nat. Mater., 2012, 11, 217–222 CrossRef CAS PubMed.
  22. R. Raj, S. C. Maroo and E. N. Wang, Nano Lett., 2013, 13, 1509–1515 CAS.
  23. C.-J. Shih, Q. H. Wang, S. Lin, K.-C. Park, Z. Jin, M. S. Strano and D. Blankschtein, Phys. Rev. Lett., 2012, 109, 176101 CrossRef.
  24. Z. Li, Y. Wang, A. Kozbial, G. Shenoy, F. Zhou, R. McGinley, P. Ireland, B. Morganstein, A. Kunkel, S. P. Surwade, L. Li and H. Liu, Nat. Mater., 2013, 12, 925–931 CrossRef CAS PubMed.
  25. A. Kozbial, Z. Li, J. Sun, X. Gong, F. Zhou, Y. Wang, H. Xu, H. Liu and L. Li, Carbon, 2014, 74, 218–225 CrossRef CAS PubMed.
  26. M. E. Schrader, J. Phys. Chem., 1975, 79, 2508–2515 CrossRef CAS.
  27. Y.-H. Lu, C.-W. Yang and I.-S. Hwang, Langmuir, 2012, 28, 12691–12695 CrossRef CAS PubMed.
  28. C. A. Amadei, C.-Y. Lai, D. Heskes and M. Chiesa, J. Chem. Phys., 2014, 141, 084709 CrossRef PubMed.
  29. A. Ashraf, Y. Wu, M. C. Wang, N. R. Aluru, S. A. Dastgheib and S. Nam, Langmuir, 2014, 30, 12827–12836 CrossRef CAS PubMed.
  30. T. Werder, J. H. Walther, R. L. Jaffe, T. Halicioglu and P. Koumoutsakos, J. Phys. Chem. B, 2003, 107, 1345–1352 CrossRef CAS.
  31. F. Mugele, Nature, 2012, 11, 182–183 CrossRef CAS PubMed.
  32. S. Santos, C. A. Amadei, A. Verdaguer and M. Chiesa, J. Phys. Chem. C, 2013, 117, 10615–10622 CAS.
  33. B. Hammer and J. K. Norskov, Nature, 1995, 376, 238–240 CrossRef CAS.
  34. P. S. Skell and J. J. Havel, J. Am. Chem. Soc., 1971, 93, 6687–6688 CrossRef CAS.
  35. K. W. Bewig and W. A. Zisman, J. Phys. Chem., 1965, 69, 4238–4242 CrossRef CAS.
  36. A. J. Katan, M. H. Van Es and T. H. Oosterkamp, Nanotechnology, 2009, 20, 165703 CrossRef PubMed.
  37. F. J. Giessibl, Phys. Rev. B: Condens. Matter Mater. Phys., 1997, 56, 16010–16015 CrossRef CAS.
  38. J. E. Sader and S. P. Jarvis, Appl. Phys. Lett., 2004, 84, 1801–1803 CrossRef CAS PubMed.
  39. S. Santos, L. Guang, T. Souier, K. Gadelrab, M. Chiesa and N. H. Thomson, Rev. Sci. Instrum., 2012, 83, 043707 CrossRef PubMed.
  40. R. García and A. San Paulo, Phys. Rev. B: Condens. Matter Mater. Phys., 1999, 60, 4961–4967 CrossRef.
  41. J. P. Cleveland, B. Anczykowski, A. E. Schmid and V. B. Elings, Appl. Phys. Lett., 1998, 72, 2613–2615 CrossRef CAS PubMed.
  42. N. Wilson, A. Marsden, M. Saghir, C. Bromley, R. Schaub, G. Costantini, T. White, C. Partridge, A. Barinov, P. Dudin, A. Sanchez, J. Mudd, M. Walker and G. Bell, Nano Res., 2013, 6, 99–112 CrossRef CAS.
  43. A. Reina, X. Jia, J. Ho, D. Nezich, H. Son, V. Bulovic, M. S. Dresselhaus and J. Kong, Nano Lett., 2008, 9, 30–35 CrossRef PubMed.
  44. L. Gao, W. Ren, H. Xu, L. Jin, Z. Wang, T. Ma, L.-P. Ma, Z. Zhang, Q. Fu, L.-M. Peng, X. Bao and H.-M. Cheng, Nat. Commun., 2012, 3, 699 CrossRef PubMed.
  45. O. Frank, J. Vejpravova, V. Holy, L. Kavan and M. Kalbac, Carbon, 2014, 68, 440–451 CrossRef CAS PubMed.
  46. M. H. Gass, U. Bangert, A. L. Bleloch, P. Wang, R. R. Nair and A. K. Geim, Nat. Nanotechnol., 2008, 3, 676–681 CrossRef CAS PubMed.
  47. M. Brugnara, C. D. Volpe, S. Siboni and D. Zeni, Scanning, 2006, 28, 267–273 CrossRef CAS PubMed.
  48. N. A. Stelmashenko, J. P. Craven, A. M. Donald, E. M. Terentjev and B. L. Thiel, J. Microsc., 2001, 204, 172–183 CrossRef CAS.
  49. J. E. Sader, T. Uchihashi, M. J. Higgins, A. Farrell, Y. Nakayama and S. P. Jarvis, Nanotechnology, 2005, 94–101 CrossRef.
  50. C.-Y. Lai, T.-C. Tang, C. A. Amadei, A. J. Marsden, A. Verdaguer, N. Wilson and M. Chiesa, Carbon, 2014, 80, 784–792 CrossRef CAS PubMed.
  51. L. Zitzler, S. Herminghaus and F. Mugele, Phys. Rev. B: Condens. Matter Mater. Phys., 2002, 66, 155436 CrossRef.
  52. J. N. Isreaelchvili, Intermolecular and surface forces, Elsevier, Waltham, MA, USA, 2011 Search PubMed.
  53. A. Méndez-Vilas, A. B. Jódar-Reyes and M. L. González-Martín, Small, 2009, 5, 1366–1390 CrossRef PubMed.

Footnote

Electronic supplementary information (ESI) available: AFM images of metal substrates, the FFT from the AFM images and contact angles (static and dynamic) of surfaces. See DOI: 10.1039/C5ra04397b

This journal is © The Royal Society of Chemistry 2015