DOI:
10.1039/C5RA04391C
(Paper)
RSC Adv., 2015,
5, 34777-34787
3D porous hybrids of defect-rich MoS2/graphene nanosheets with excellent electrochemical performance as anode materials for lithium ion batteries†
Received
12th March 2015
, Accepted 9th April 2015
First published on 9th April 2015
Abstract
In recent years, the global energy crisis and environmental concerns have put forward an ever-growing demand for efficient energy storage, which has accelerated the development of lithium ion batteries with higher power density and longer cycle life. Herein, we demonstrate a facile and scalable process to prepare three-dimensional (3D) porous hybrids comprised of ultrathin defect-rich MoS2 nanosheets (dr-MoS2 NSs) and conductive graphene nanosheets (GNS) via a hydrothermal co-assembly process. The resulting dr-MoS2/graphene (dr-MoS2/GNS) hybrids possess a 3D porous structure with large specific surface area, which enables rapid diffusion of lithium ions to access active materials. The ultrathin dr-MoS2 NSs with exposure of additional active edge sites significantly facilitate the intercalation of lithium ions, thus leading to higher specific capacity. The interconnected graphene network not only provides highly conductive pathways facilitating the charge transfer and lithium ion transport, but also maintains its structural stability during the lithiation/delithiation process. As a consequence, the dr-MoS2/GNS (6![[thin space (1/6-em)]](https://www.rsc.org/images/entities/char_2009.gif) :1) hybrid exhibits a high reversible capacity of 1130.9 mA h g−1 at a current density of 0.1 A g−1, with excellent cyclic stability and rate capability. The outstanding electrochemical performance of the dr-MoS2/GNS hybrids can be ascribed to their 3D porous structure and the synergetic effect between ultrathin dr-MoS2 NSs and the conductive graphene network, making them promising anode materials for high performance lithium ion batteries.
:1) hybrid exhibits a high reversible capacity of 1130.9 mA h g−1 at a current density of 0.1 A g−1, with excellent cyclic stability and rate capability. The outstanding electrochemical performance of the dr-MoS2/GNS hybrids can be ascribed to their 3D porous structure and the synergetic effect between ultrathin dr-MoS2 NSs and the conductive graphene network, making them promising anode materials for high performance lithium ion batteries.
1. Introduction
An increasing demand for efficient energy storage has created a strong driving force for the development of high performance lithium ion batteries (LIBs), which have become one of the predominant power sources for portable electronic devices, electric vehicles and hybrid electric vehicles.1–3 In order to meet the requirements of these applications, it is of great significance to develop rechargeable LIBs with higher energy density and power density, better cyclic stability and rate capability.4 As the anode material for LIBs, the commercialized graphite has been widely used owing to its natural abundance, flat potential profile versus lithium and stable cycling performance.5 However, it has a relatively low theoretical specific capacity (∼372 mA h g−1) due to the limit of thermodynamic equilibrium saturation composition of LiC6, which cannot fully accommodate the ever-growing demand for high performance LIBs.6–8 Therefore, alternative anode materials with higher specific capacity and better cycling stability for LIBs have recently become the subject of intensive research worldwide.9
Compared to other potential anode materials, molybdenum disulfide (MoS2) has recently attracted tremendous attention as an outstanding candidate for the next-generation LIBs owing to its unique properties.10,11 As a typical type of layered transition metal dichalcogenides, MoS2 has a similar structure to graphite, consisting of three atom layers (S–Mo–S) stacked together through van der Waals interaction.12,13 The weak van der Waals interaction between MoS2 layers enables the easy insertion/extraction of lithium ions without an obvious increase in volumetric expansion during the lithiation/delithiation process.14,15 Moreover, MoS2 exhibits much higher theoretical specific capacity (∼669 mA h g−1) than the commercially used graphite, based on the redox conversion reaction between lithium ions and MoS2 leading to four moles of lithium incorporation per mole of MoS2.16 However, the poor cyclic stability and inferior rate performance of bulk MoS2 materials are the major obstacles for their practical applications, which mainly results from the intrinsic poor electric/ionic conductivity between two adjacent S–Mo–S layers.17–19 In addition, restacking of MoS2 layers and difficulty to full lithiation of the internal portion in bulk MoS2 materials often lead to decreased lithium storage capacity.20
In order to solve these problems, one effective approach is to optimize the MoS2 materials to nanostructures with a larger surface area and shortened lithium ion diffusion pathway.21 Extensive researches have proved that nanostructured MoS2 materials manifest higher reversible capacity and better cyclic stability in comparison with their bulky counterparts.22,23 Furthermore, MoS2 is inclined to form two-dimensional lamellar structure and its preferentially exposed surface is the thermodynamically stable basal plane rather than the electrochemically active edge plane.24 Therefore, designing MoS2 nanostructure and simultaneously increasing the exposure of active edge sites are effective strategies to improve the electrochemical performances of MoS2 materials.25 Recently, Xie's group reported a scalable pathway to prepare defect-rich MoS2 nanosheets with abundant defect cracking of the basal planes, thus leading to disordered structure with exposure of additional active edge sites, which resulted in greatly enhanced electrocatalytic performances.26,27
Another effective approach to solve the capacity fading problem is to construct hybrid structure with MoS2 dispersed in a conductive matrix such as graphene, carbon nanotubes, carbon fiber cloth or amorphous carbon so as to improve electrical conductivity and structural stability.28,29 Among various kinds of carbonaceous materials, graphene has attracted great attention as an outstanding candidate due to its high electrical conductivity, excellent mechanical properties and large specific surface area.30–32 Many efforts have been made to prepare MoS2/graphene composites, which exhibit improved electrochemical performance.33–36 For example, Chang et al. reported a L-cysteine-assisted solution-phase method to synthesize MoS2/graphene composites, which exhibited high capacity of ∼1100 mA h g−1 at a current density of 100 mA g−1 with excellent cyclic stability and high rate capability.37 Similarly, nanocomposites comprised of layered MoS2, graphene and amorphous carbon delivered a high capacity of 1116 mA h g−1 at a current density of 100 mA g−1 with negligible capacity fading after 250 cycles.38 More recently, Gong et al. reported a bottom-up approach to construct three-dimensional (3D) porous MoS2–graphene aerogels by employing the liquid-exfoliated MoS2 and graphene oxide as starting materials, which achieved high reversible capacity of ∼1200 mA h g−1 at a current density of 74 mA g−1 with good cycling performance.39 The 3D porous hybrid aerogels possess high surface areas, which can facilitate the rapid diffusion of electrolyte to access active materials and subsequently lead to improved lithium storage capacity. However, the liquid exfoliation process of MoS2 is extremely sensitive to the environmental conditions, takes a very long time and consumes a large amount of organic solvents, which could not meet the requirement for large-scale production with low cost.40 In sharp contrast, large-scale fabrication of defect-rich MoS2 nanosheets with excellent dispersibility and additional active edge sites can be achieved via a simple hydrothermal method.26 To the best of our knowledge, the research work on defect-rich MoS2 nanosheets as anode materials for LIBs has not been reported so far.
Herein, we demonstrate a facile and scalable process to prepare 3D porous hybrids comprised of ultrathin defect-rich MoS2 nanosheets (dr-MoS2 NSs) and graphene nanosheets (GNS) via a hydrothermal route. This process is environmentally friendly, and scalable to industrial level with low cost. The ultrathin dr-MoS2 NSs with excellent dispersibility in aqueous solution were firstly synthesized, and subsequently mixed with graphene oxide to co-assemble into 3D porous dr-MoS2/GNS hybrids. First of all, the nanostructured dr-MoS2 NSs provide additional active edge sites which enormously facilitate the rapid insertion/extraction of lithium ions, thus leading to greatly improved specific capacity. Secondly, the interconnected graphene network significantly enhances the electrical conductivity and maintains the structural stability during the lithium ion insertion/extraction process. Finally, the dr-MoS2/GNS hybrids possess 3D porous structure with high surface areas and large pore volume, which enables the fast diffusion of electrolyte to access active materials and accommodates the volumetric expansion of active materials during the lithiation/delithiation process. When evaluated as anode materials for LIBs, the dr-MoS2/GNS hybrids exhibit high reversible capacity of 1130.9 mA h g−1 at a current density of 0.1 A g−1 with excellent cycling stability and rate performance. Therefore, the as-prepared 3D porous hybrids comprised of defect-rich MoS2 NSs and conductive graphene network is expected to be a promising candidate as novel anode materials for high performance lithium ion batteries.
2. Experimental section
2.1. Materials
Natural graphite powder (325 meshes) was purchased from Alfa-Aesar. All the other reagents were purchased from Sinopharm Chemical Reagent Co. Ltd. and used as received without further purification. Deionized (DI) water was used throughout all the experiments.
2.2. Preparation of MoS2 nanosheets
Defect-rich MoS2 nanosheets (dr-MoS2 NSs) were synthesized according to the procedures reported elsewhere.26 In a typical synthesis, 1 mmol hexaammonium heptamolybdate tetrahydrate ((NH4)6Mo7O24·4H2O) and 30 mmol thiourea (N2H4CS) were dissolved in 35 mL water under vigorous stirring to form a homogeneous solution. After being stirred for several minutes, the mixture solution was then transferred into a 45 mL Teflon-lined stainless steel autoclave, sealed tightly and maintained at 220 °C for 18 h. After the reaction system cooled down to room temperature naturally, the obtained black precipitate was washed with water and absolute ethanol for several times and dried at 60 °C under vacuum. For the synthesis of defect-free MoS2 NSs (df-MoS2 NSs), 1 mmol (NH4)6Mo7O24·4H2O (i.e. 7 mmol Mo) and 14 mmol thiourea (i.e. 14 mmol S) were dissolved in 35 mL deionized water under vigorous stirring to form a homogeneous solution and then treated by the same hydrothermal procedure.26
2.3. Preparation of graphene oxide (GO)
GO was synthesized from natural graphite powder by a modified Hummers method.41 The resulting GO solid was dispersed in water by sonication under ambient condition for 30 min to make a homogeneous GO aqueous dispersion.
2.4. Preparation of dr-MoS2/GNS hybrids
Scheme 1 illustrates the preparation procedure for the 3D porous dr-MoS2/GNS hybrids. Typically, 20 mL of 2 mg mL−1 homogeneous GO aqueous dispersion was mixed with 10 mL of dr-MoS2 NS aqueous dispersion with different concentrations by sonication for 2 h. Then, the mixed dispersion was transferred into a 45 mL Teflon-lined stainless steel autoclave, sealed tightly and maintained at 180 °C for 12 h. After the reaction system cooled down to room temperature naturally, the sample was washed with water several times and dried at 60 °C under vacuum. Finally, the as-prepared dr-MoS2/GO hybrids were annealed in a conventional tube furnace at 800 °C for 2 h in N2 atmosphere (to thermally reduce GO to GNSs). In particular, the content of dr-MoS2 NSs in the dr-MoS2/GNS hybrids was easily tunable by simply adjusting the ratio of dr-MoS2 to GO during the preparation procedure. Three ratios of 10:1, 6:1 and 2:1 were chosen in this work. Correspondingly, the as-prepared hybrids were named as dr-MoS2/GNS (10:1), dr-MoS2/GNS (6:1) and dr-MoS2/GNS (2:1) hybrids for convenience. For the control experiment, dr-MoS2 NSs were treated by the same preparation procedure without adding any GO dispersion.
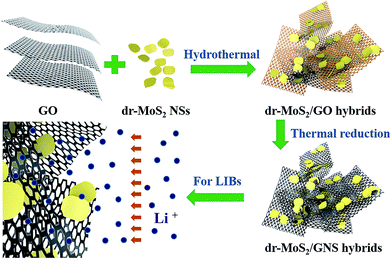 |
| | Scheme 1 Schematic illustration of the preparation of dr-MoS2/GNS hybrids. | |
2.5. Materials characterization
The morphologies of the samples were investigated using field emission scanning electron microscope (FESEM, Ultra 55, Zeiss) at an acceleration voltage of 5 kV. Transmission electron microscopy (TEM) and high-resolution transmission electron microscopy (HRTEM) observations were performed with Tecnai G2 20 TWIN TEM under an acceleration voltage of 200 kV. Atomic force microscopy (AFM) images were taken under tapping mode with a Scanning Probe Microscope (SPM) Nanoscope IV from Digital Instruments. Before AFM observations, the samples were prepared by casting and drying the solution on freshly cleaved mica at room temperature. X-ray diffraction (XRD) patterns of the samples were conducted on an X'Pert Pro X-ray diffractometer with Cu Kα radiation (λ = 0.1542 nm) under a voltage of 40 kV and a current of 40 mA. X-ray photoelectron spectroscopy (XPS) analyses were made with a VG ESCALAB 220I-XL device. All XPS spectra were corrected using C1s line at 284.5 eV. The Brunauer–Emmett–Teller (BET) surface area was measured using a Belsorp-max surface area detecting instrument by N2 physisorption at 77 K.
2.6. Electrochemical measurements
The electrochemical measurements were carried out in 2025 coin-type half-cells assembled in an argon-filled glovebox (M.Braun Inertgas Systems Co. Ltd.). Pure lithium foil was used as the counter electrode, and a polypropylene film (Celgard-2400) was used as a separator. The electrolyte was consisted of a solution of 1 M LiPF6 in ethylene carbonate (EC)/dimethyl carbonate (DMC)/diethyl carbonate (DEC) (1:1:1 by volume). The working electrodes were prepared by a slurry coating procedure. The slurry is consisted of active material, acetylene black and poly(vinylidene fluoride) dissolved in N-methyl-2-pyrrolidinone (NMP) at a weight ratio of 80:10:10, respectively. The as-prepared slurry was pasted on pure copper foil and dried at 80 °C under vacuum. The cells were assembled in an argon-filled glovebox with the concentrations of moisture and oxygen below 0.1 ppm. Cyclic voltammetry (CV) curves were collected by a CHI660C electrochemical workstation (Chenhua Instruments Co. Ltd.) at 0.1 mV s−1 in the range from 0.01 to 3.0 V. The galvanostatic discharge–charge measurements and rate-performance tests under different current densities were performed in the voltage range from 0.01 to 3.0 V at room temperature by using a CT2013A cell test instrument (LAND Electronic Co. Ltd.). The electrochemical impedance spectroscopy (EIS) was measured in the frequency range from 100 kHz to 0.01 Hz at open circuit potential with an AC voltage amplitude of 5.0 mV.
3. Results and discussion
3.1. Structure and morphology of dr-MoS2/GNS hybrids
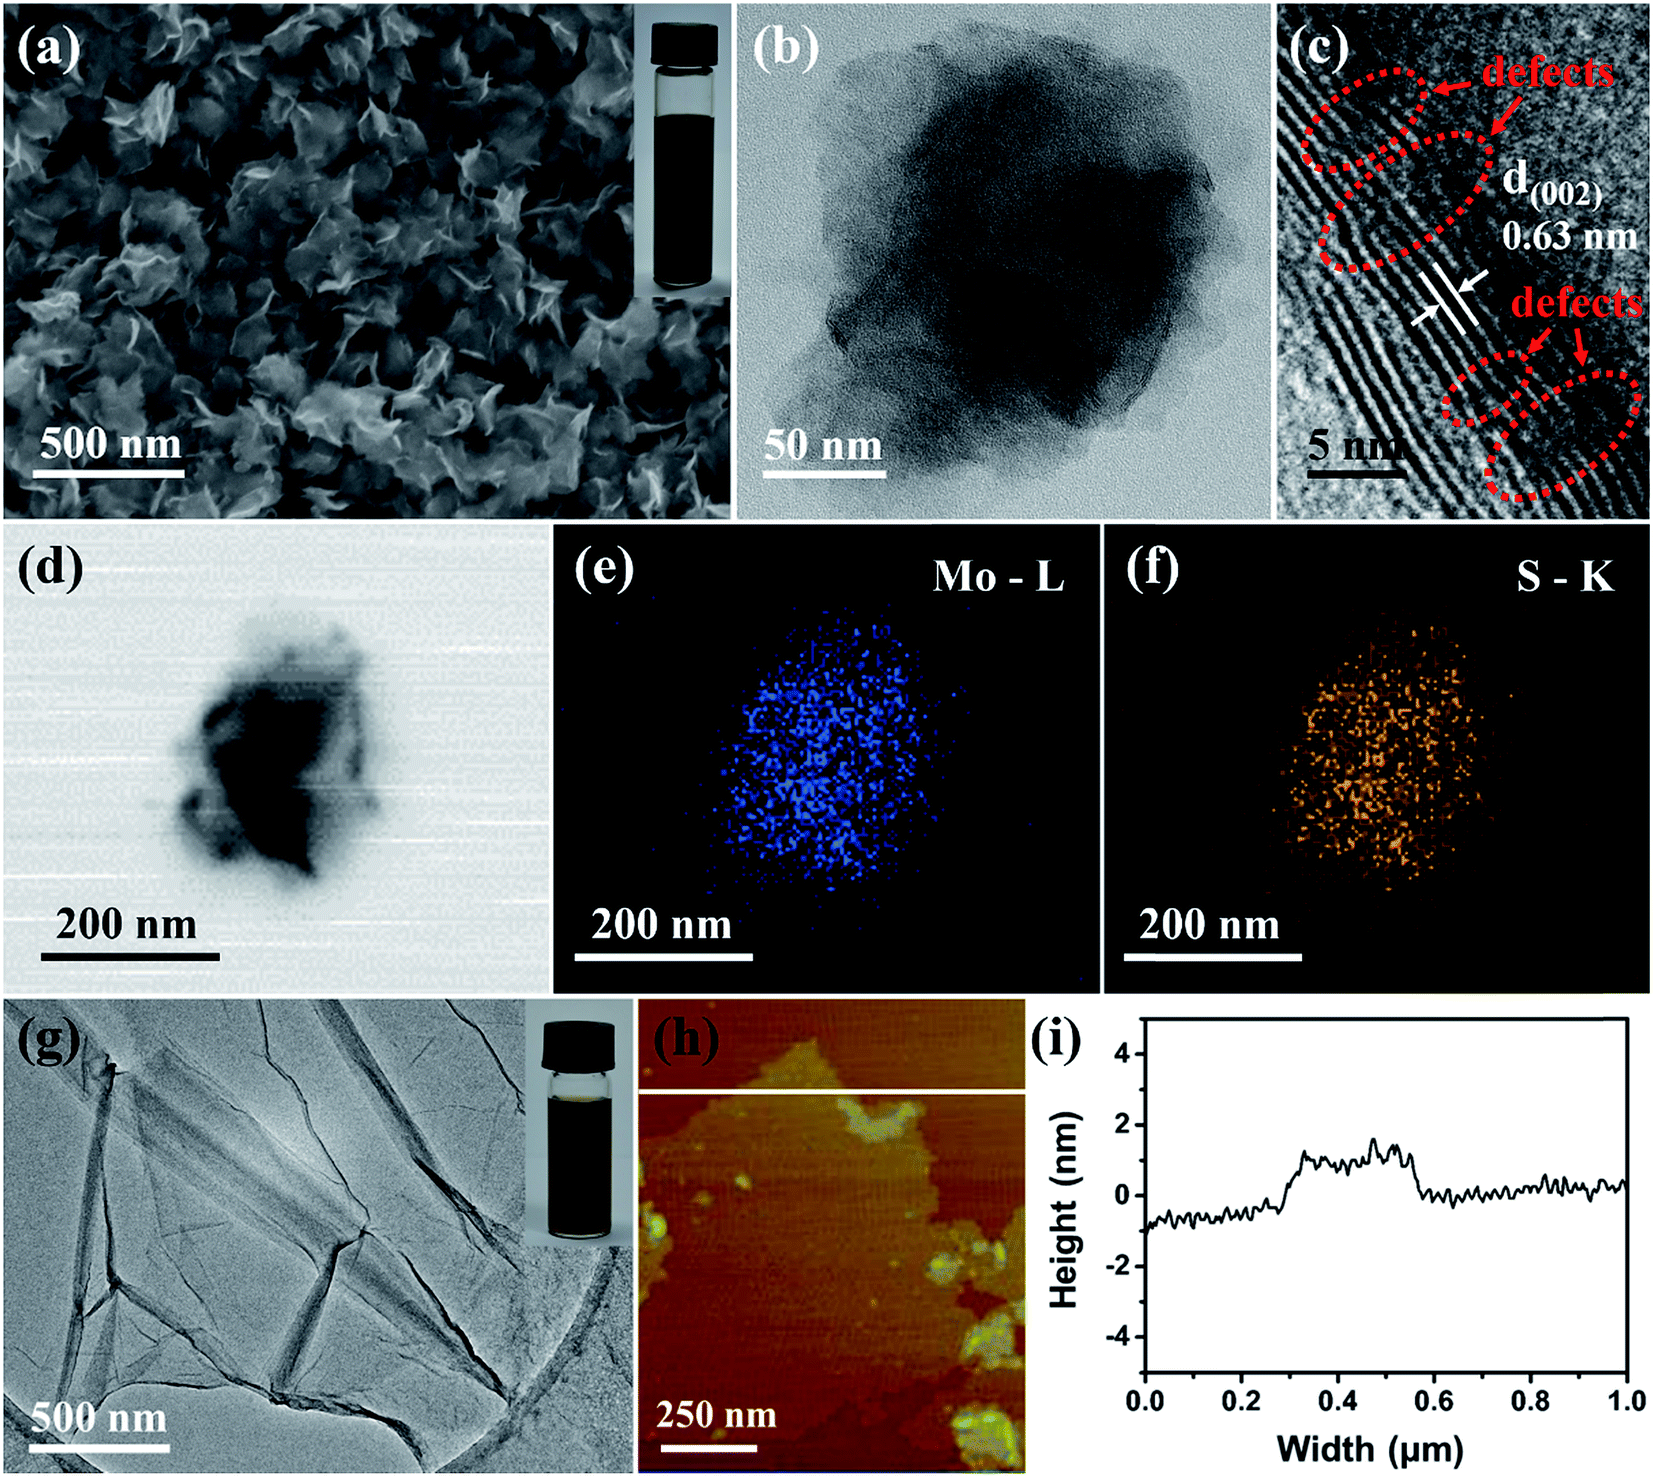
The structure and morphology of the as-prepared dr-MoS2 NSs and GO sheets were investigated via FESEM, TEM and AFM. FESEM image (Fig. 1(a)) clearly reveals the ultrathin nanosheet morphology of dr-MoS2 NSs with curled edges and uniform lateral size in the range of 100–200 nm. Notably, the ultrathin dr-MoS2 NSs synthesized by this simple hydrothermal method show excellent dispersibility in aqueous solution (inset of Fig. 1(a)), which is advantageous for constructing dr-MoS2/GNS hybrids with dr-MoS2 NSs well dispersed in the matrix of graphene. In contrast, the commercially bulk MoS2 tends to agglomerate and precipitate and displays poor dispersibility in aqueous solution, as shown in Fig. S1 (see ESI†). The TEM image in Fig. 1(b) also verifies the ultrathin nanosheet morphology of dr-MoS2 NSs. Besides, the ultrathin nanosheet morphology of dr-MoS2 NSs does not change even after the thermal reducing process (Fig. S2 and S3, see ESI†). The HRTEM image in Fig. 1(c) reveals that the dr-MoS2 NSs exhibit a layered structure with an interlayer spacing of 0.63 nm and the thickness is about 3–6 nm, corresponding to 5–10 sandwiched S–Mo–S layers. Interestingly, as indexed in Fig. 1(c), the crystal fringes along the curled edge of dr-MoS2 NSs are discontinuous, which can be attributed to the existence of abundant defects on the surfaces of dr-MoS2 NSs.26 Furthermore, as shown in Fig. 1(d)–(f), the TEM image and corresponding EDS mapping images indicate the homogeneous distribution of molybdenum and sulfur elements in the whole ultrathin nanosheet. In contrast, the defect-free MoS2 NSs (df-MoS2 NSs) synthesized via a quantitative reaction with high concentration of precursors but no excess thiourea (Mo:S = 1:2) display similar ultrathin nanosheet morphology with an interlayer spacing of 0.63 nm, but no discontinuous crystal fringes are observed along the curled edge of df-MoS2 NSs (Fig. S4, see ESI†). This result reveals the significance of excess thiourea to introduce defects into the MoS2 surfaces. Specifically, excess thiourea can attach onto the surface of primary MoS2 nanocrystallites, partially hindering its oriented crystal growth and leading to the formation of defect-rich structure.26 From the TEM image of GO (Fig. 1(g)), the exfoliated GO sheets were typically a few micrometers in size and slightly scrolled on sheet edges. As shown in Fig. 1(h) and (i), the typical AFM image and height profiles of GO sheets reveal the same morphology as observed from TEM images, and the thickness of GO sheets is about 1 nm. Besides, as shown in inset of Fig. 1(g), GO aqueous dispersion is very stable due to the abundant oxygenated functional groups on graphene sheets, which is crucial for constructing 3D porous dr-MoS2/GNS hybrid nanostructures.
 |
| | Fig. 1 (a) FESEM, (b) TEM and (c) HRTEM images of dr-MoS2 NSs. (d–f) TEM and corresponding EDS mapping images of an individual dr-MoS2 NS. (g) TEM, (h) AFM images and (i) height profiles of GO sheets. The inset of (a) and (g) shows the dispersions of dr-MoS2 NSs (3 mg mL−1) and GO (1 mg mL−1) in aqueous solution, respectively. The dispersions stood still for one week before taking photos. | |
Benefiting from the excellent dispersibility of 2D nanosheets of dr-MoS2 NSs and GO in aqueous solution, a homogenous dispersion of dr-MoS2/GO mixture can be easily prepared. And subsequently, the dr-MoS2/GO mixture dispersion can be hydrothermally co-assembled to form a 3D porous dr-MoS2/GNS hybrid, due to the crosslinks formed by partial overlapping or coalescing of flexible graphene sheets via π-stacking interactions.42 Fig. 2(a) shows the digital images of the 3D porous dr-MoS2/GNS (6:1) hybrid, which has a similar morphology to those reported for graphene-based hydrogels.39,43,44 In contrast, bare MoS2 hydrogels could not be built by using dr-MoS2 NSs alone, which indicates the importance of graphene nanosheets with excellent self-assembly property to the formation of 3D macrostructure. Fig. 2(b)–(d) displays the FESEM images of dr-MoS2/GNS (2:1), dr-MoS2/GNS (6:1) and dr-MoS2/GNS (10:1) hybrids. It can be seen that all dr-MoS2/GNS hybrids possess 3D hierarchical structure with interconnected pores, and the pore sizes are in the range of several nanometers to several micrometers. Moreover, the content of dr-MoS2 NSs in the dr-MoS2/GNS hybrids clearly increases with the increasing of ratio of dr-MoS2 to GO. As shown in Fig. 2(c), for the dr-MoS2/GNS (6:1) hybrid, ultrathin dr-MoS2 NSs are homogeneously dispersed in the 3D porous graphene network, which effectively prevent their restacking and aggregation. However, excessive amount of dr-MoS2 NSs in the dr-MoS2/GNS (10:1) hybrid will result in serious agglomeration (Fig. 2(d)). The corresponding EDX mapping images of the dr-MoS2/GNS hybrids reveal the homogeneous distribution of carbon, molybdenum and sulfur elements, which verifies that dr-MoS2 NSs are uniformly dispersed in the 3D porous graphene matrix (Fig. S5, see ESI†). Furthermore, four peeks located at 0.27, 0.52, 2.29 and 2.3 keV are observed in the EDX spectra for all the three dr-MoS2/GNS hybrids (Fig. S5, see ESI†), corresponding to carbon KR, oxygen KR, molybdenum LR and sulfur KR energy, respectively. These results indicate the existence of C, Mo, S and O elements in all the three dr-MoS2/GNS hybrids, and no detectable impurity is observed. The low oxygen content reveals that graphene nanosheets in all the three dr-MoS2/GNS hybrids are highly reduced after calcination process. Moreover, it can be clearly seen that the content of Mo and S elements in the dr-MoS2/GNS hybrids increases with increasing the ratio of dr-MoS2 to GNS, which is consistent with the morphology analysis of all these samples.
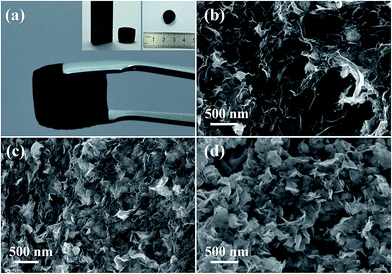 |
| | Fig. 2 (a) Digital photos of 3D porous dr-MoS2/GNS hybrids. FESEM images of (b) dr-MoS2/GNS (2:1), (c) dr-MoS2/GNS (6:1) and (d) dr-MoS2/GNS (10:1) hybrids. | |
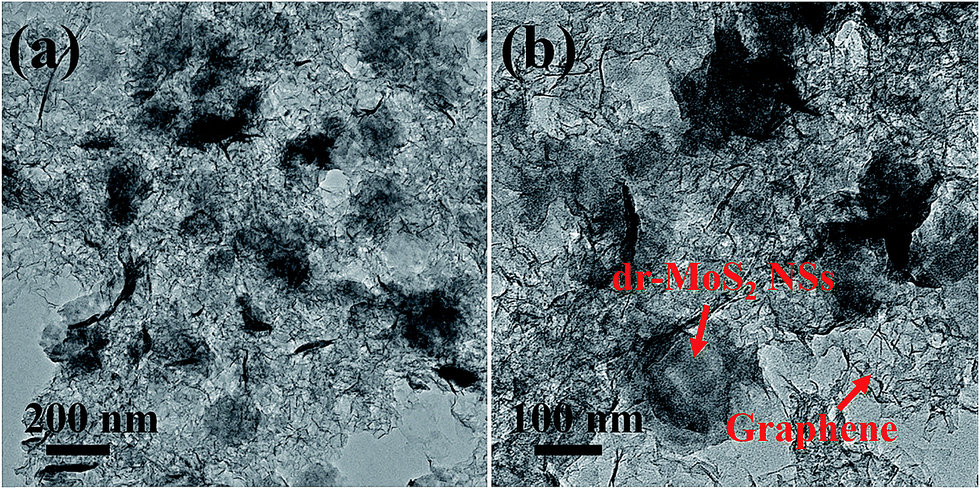
The detailed microstructures of the dr-MoS2/GNS (6:1) hybrid were further investigated by TEM observations, as shown in Fig. 3. It can be clearly seen that ultrathin dr-MoS2 NSs are homogeneously confined in the matrix of porous graphene, which agrees well with the FESEM observations. Besides, the dr-MoS2/GNS (6:1) hybrid possesses a porous structure with interconnected pores and thin walls, which not only greatly hinders dr-MoS2 NSs from restacking and aggregating but also provides large surface area for rapid diffusion of lithium ions to access active materials. The interconnected graphene network enables the rapid charge transfer for improving the electrical conductivity of overall dr-MoS2/GNS hybrid electrodes. Furthermore, the matched layer structure between dr-MoS2 NSs and GNS can increase their contact areas for rapid transfer of lithium ions and electrons across their interface, thus enormously enhancing the electrochemical performance of the dr-MoS2/GNS hybrids.
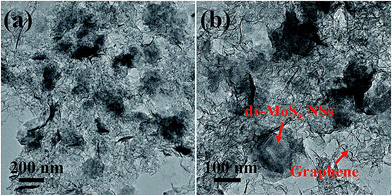 |
| | Fig. 3 TEM images of dr-MoS2/GNS (6:1) hybrid at (a) low and (b) high magnifications. | |
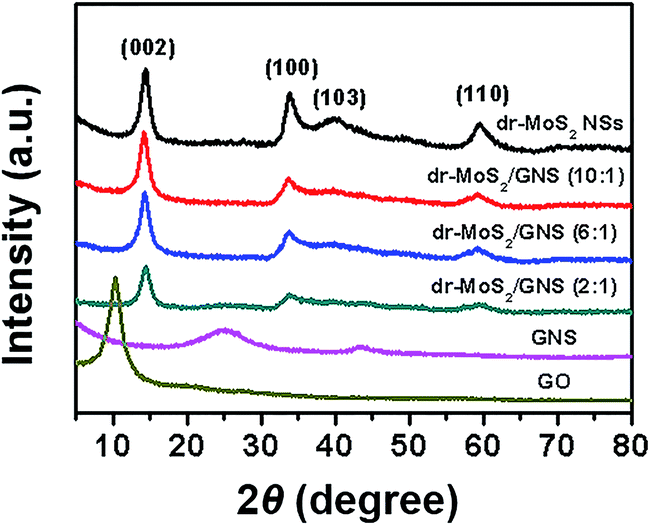
Fig. 4 shows the XRD patterns of GO, GNS, dr-MoS2 NSs and dr-MoS2/GNS hybrids prepared by different ratios of dr-MoS2 to GO. GO displays a typical diffraction peak at 2θ = 10.6° as a result of the introduction of oxygenated functional groups on graphene sheets. In contrast, the (002) diffraction peak of GNS can be clearly observed at 2θ = 25.2°, which indicates that GO sheets are reduced to graphene after the hydrothermal procedure followed by thermal treatment. Bare dr-MoS2 NSs show the diffraction peaks at 2θ = 14.2°, 33.5°, 39.6° and 59.3°, which can be indexed to (002), (100), (103) and (110) planes of MoS2 (JCPDS 37-1492). Notably, the structure of dr-MoS2 NSs does not change even after the hydrothermal assembly and thermal reduction process (Fig. S6, see ESI†). All of the dr-MoS2/GNS hybrids show the combination of both components and no obvious peaks from the impurity phase are observed, indicating the co-existence of dr-MoS2 NSs and GNS. For all the three dr-MoS2/graphene hybrids, the diffraction peak of graphene is relatively weak in comparison with the diffraction peak of dr-MoS2 NSs. Thus, the diffraction peak of graphene could not be clearly observed for all the dr-MoS2/graphene hybrids. Nevertheless, a very weak diffraction peak of graphene located at 2θ = 25.2° can still be observed for the dr-MoS2/GNS (2:1) hybrids. Moreover, the diffraction peak of graphene become weaker and weaker with increasing the ratio of dr-MoS2 NSs to graphene in dr-MoS2/GNS hybrids.
 |
| | Fig. 4 XRD patterns of GO, GNS, dr-MoS2 NSs, dr-MoS2/GNS (2:1), dr-MoS2/GNS (6:1) and dr-MoS2/GNS (10:1) hybrids. | |
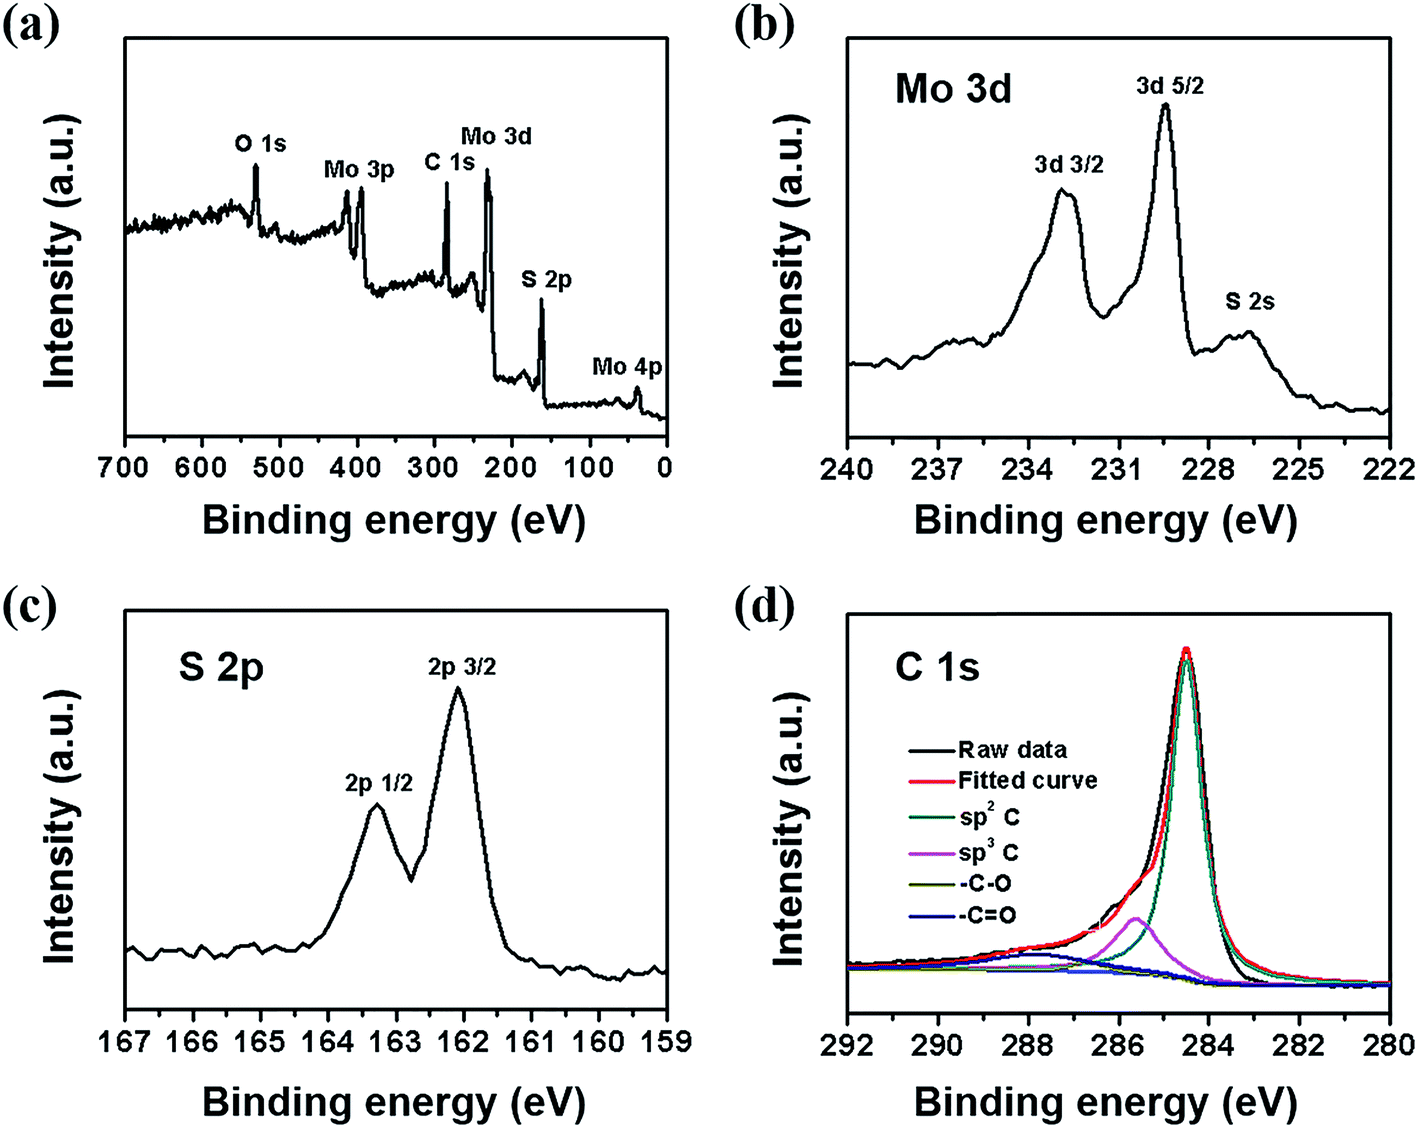
The surface electronic state and composition of dr-MoS2/GNS (6:1) hybrid were investigated by XPS analysis. As shown in Fig. 5(a), the dr-MoS2/GNS (6:1) hybrid contains C, Mo, S and O elements without detectable impurities, which indicates the co-existence of dr-MoS2 NSs and graphene in the dr-MoS2/GNS hybrids. Fig. 5(b) shows the high resolution Mo 3d spectrum in the binding energy range of 222–240 eV. Two peaks are observed at 229.3 eV and 232.5 eV, which can be attributed to the Mo 3d5/2 and Mo 3d3/2 binding energies respectively, characteristic of Mo4+ in MoS2, suggesting the dominance of Mo(IV) in the dr-MoS2/GNS samples. And the small peak at about 226 eV corresponds to the S 2s component of MoS2.45 In the high resolution S 2p spectrum shown in Fig. 5(c), the peaks at 163.3 eV and 162.1 eV are observed, corresponding to S 2p1/2 and S 2p3/2 orbitals of divalent sulfide ions (S2−), respectively.45 These results are consistent with those reported previously for MoS2 NSs.26 Fig. 5(d) shows the high resolution C 1s spectrum of the dr-MoS2/GNS (6:1) hybrid. Furthermore, from the C1s spectra of dr-MoS2/GNS (6:1) hybrid (Fig. 5(d)) and GO sheets (Fig. S7, see ESI†), four different peaks centered at 284.5, 285.6, 286.7 and 287.8 eV are observed, corresponding to sp2 C, sp3 C, –C–O and –C![[double bond, length as m-dash]](https://www.rsc.org/images/entities/char_e001.gif) O groups, respectively.46 For the dr-MoS2/GNS (6:1) hybrid, the intensities of C 1s peaks of the carbons binding to oxygen (–C–O and –CO groups) dramatically decrease in comparison with GO sheets, indicating that most of the oxygen-containing functional groups are removed after the thermal reduction process.
O groups, respectively.46 For the dr-MoS2/GNS (6:1) hybrid, the intensities of C 1s peaks of the carbons binding to oxygen (–C–O and –CO groups) dramatically decrease in comparison with GO sheets, indicating that most of the oxygen-containing functional groups are removed after the thermal reduction process.
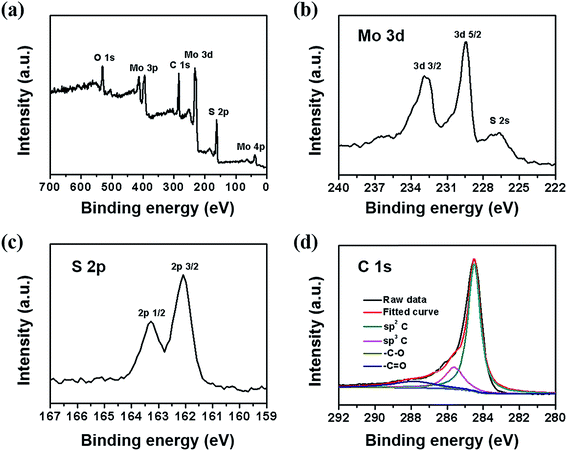 |
| | Fig. 5 (a) XPS survey spectrum, high resolution (b) Mo 3d spectrum, (c) S 2p spectrum and (d) C 1 s spectrum of dr-MoS2/GNS (6:1) hybrid. | |
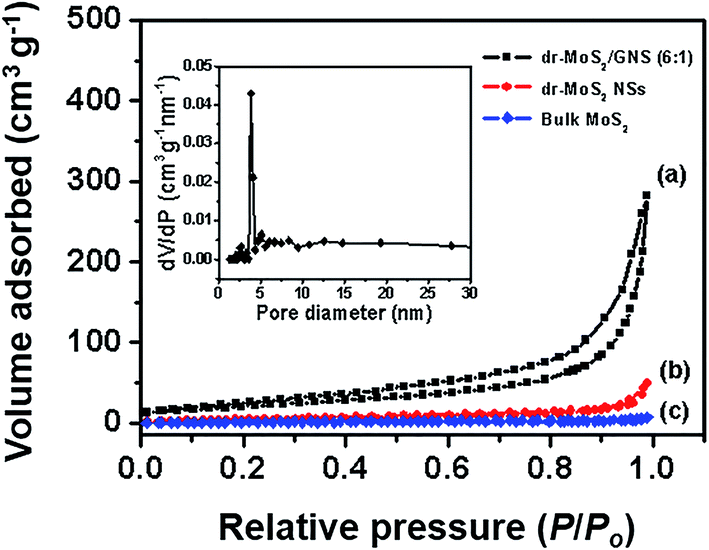
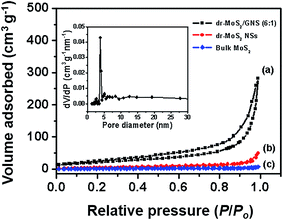
To further investigate the porous structure and specific surface area of the dr-MoS2/GNS hybrids, BET analysis of the nitrogen adsorption/desorption isotherms was performed. As shown in Fig. 6, the dr-MoS2 NSs and bulk MoS2 display reversible type II isotherms, which is an indication of non-porous materials. In contrast, the dr-MoS2/GNS (6:1) hybrid exhibits a typical IV isotherm with a typical H2 hysteresis loop, which verifies the dr-MoS2/GNS hybrids as mesoporous materials. As displayed in the inset of Fig. 6, the pore size distribution of the dr-MoS2/GNS (6:1) hybrid calculated from the Barrett–Joiner–Halenda (BJH) method is mainly centered at about 4 nm, which is in the mesoporous range. The specific surface area and pore volume of all the samples are summarized in Table 1. The specific surface area of the dr-MoS2/GNS (6:1) hybrid is 131.1 m2 g−1, which is nearly 26 times higher than that of bulk MoS2 and about 7 times larger than that of dr-MoS2 NSs. Additionally, the pore volume of dr-MoS2/GNS (6:1) hybrid also greatly increases in comparison to those of dr-MoS2 NSs and bulk MoS2. Compared to bare MoS2, the largely improved surface area and pore volume of dr-MoS2/GNS (6:1) hybrid could be ascribed to the 3D porous structure derived from graphene network (the theoretical specific surface area of graphene is 2600 m2 g−1).47 Meanwhile, it is worth to mention that the surface area and pore volume of dr-MoS2 NSs are higher than those of bulk MoS2. This is mainly due to the nanostructure and disordered architecture of dr-MoS2 NSs resulting from abundant defect cracking of the basal planes. The higher surface area and larger pore volume are favorable for electrode materials, which can facilitate rapid diffusion of lithium ions to access active material and accommodate the volumetric expansion of active material during the lithiation/delithiation process.
 |
| | Fig. 6 Nitrogen adsorption isotherms of (a) dr-MoS2/GNS (6:1) hybrid, (b) dr-MoS2 NSs and (c) bulk MoS2. The inset shows the corresponding pore size distribution of dr-MoS2/GNS (6:1) hybrid. | |
Table 1 Specific surface area and pore volume of bulk MoS2, dr-MoS2 NSs and dr-MoS2/GNS (6:1) hybrid
| Samples |
BET specific surface area (m2 g−1) |
Pore volume (cm3 g−1) |
| Bulk MoS2 |
5.0 |
0.029 |
| dr-MoS2 NSs |
18.6 |
0.078 |
| dr-MoS2/GNS (6:1) hybrid |
131.1 |
0.451 |
3.2. Electrochemical performance of dr-MoS2/GNS hybrids
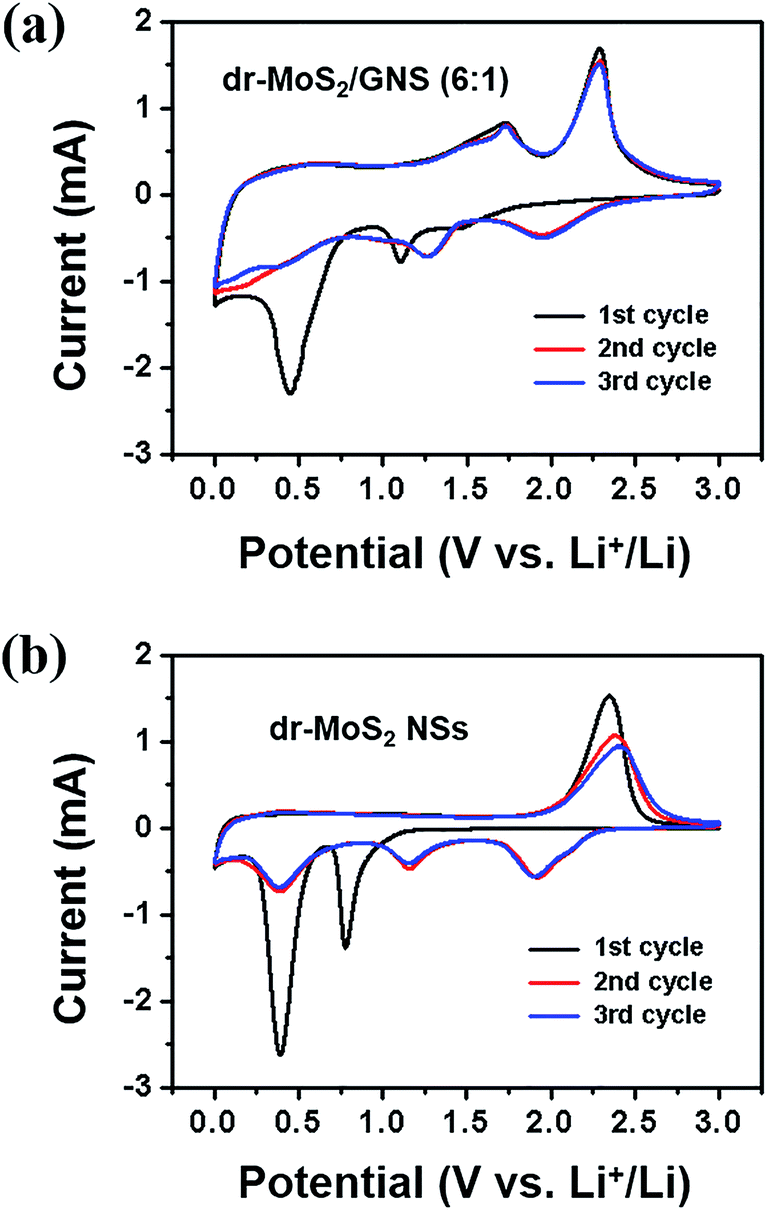
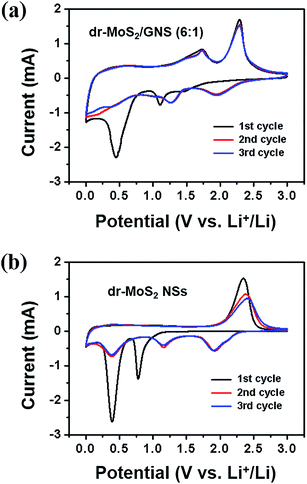
In order to evaluate the electrochemical performance of dr-MoS2/GNS hybrids as anode materials for LIBs, cyclic voltammetry (CV), galvanostatic discharge–charge experiments and electrochemical impedance (EIS) analysis have been performed. Fig. 7 displays the first three cycles of CV curves of the dr-MoS2/GNS (6:1) hybrid and dr-MoS2 NSs measured at a scan rate of 0.1 mV s−1 in the voltage range from 0.01 to 3.0 V. As shown in Fig. 7(a), during the first CV cycle, there are two reduction peaks and two oxidation peaks for the dr-MoS2/GNS (6:1) hybrid. The first reduction peak at 1.10 V results from Li insertion into defect sites of dr-MoS2, forming LixMoS2 according to eqn (1).48 The second reduction peak located at 0.45 V is ascribed to the subsequent Li insertion into LixMoS2, which entails the reduction of LixMoS2 to Mo metal nanoparticles and Li2S according to eqn (2).49 In the reverse anodic scan, the small oxidation peak at 1.73 V should be ascribed to the reversible lithium storage on graphene sheets, which is not found in the first three CV curves of bare dr-MoS2 NSs (Fig. 7(b)). The pronounced oxidation peak at 2.30 V is attributed to the oxidation of Li2S into S according to eqn (3).48 In the following cycles, the reduction peaks at 0.46 V and 1.10 V disappear and two new peaks at 1.26 V and 1.95 V are observed, which indicates the multistep conversion from S with Li+ to the formation of Li2S.48 For the bare dr-MoS2 NSs (Fig. 7(b)), two reduction peaks located at 0.39 V and 0.78 V and one oxidation peak located at 2.34 V in the first cycle are observed, which is similar to the profiles of dr-MoS2/GNS (6:1) hybrid. It is noticed that the intensities of oxidation peaks at 2.34 V decrease evidently with cycling, indicating a capacity fading of bare dr-MoS2 anode. In contrast, the 2nd and 3rd cycles of CV curves are overlapped for the dr-MoS2/GNS (6:1) hybrid (Fig. 7(a)), suggesting a good reversibility during the cycling process.| | |
MoS2 + xLi+ + xe− → LixMoS2
| (1) |
| | |
Li2S − 2e− → 2Li+ + S
| (3) |
 |
| | Fig. 7 First three cycles of CV curves of (a) dr-MoS2/GNS (6:1) hybrid and (b) dr-MoS2 NSs measured in the voltage range from 0.01 to 3.0 V with a scan rate of 0.1 mV s−1. | |
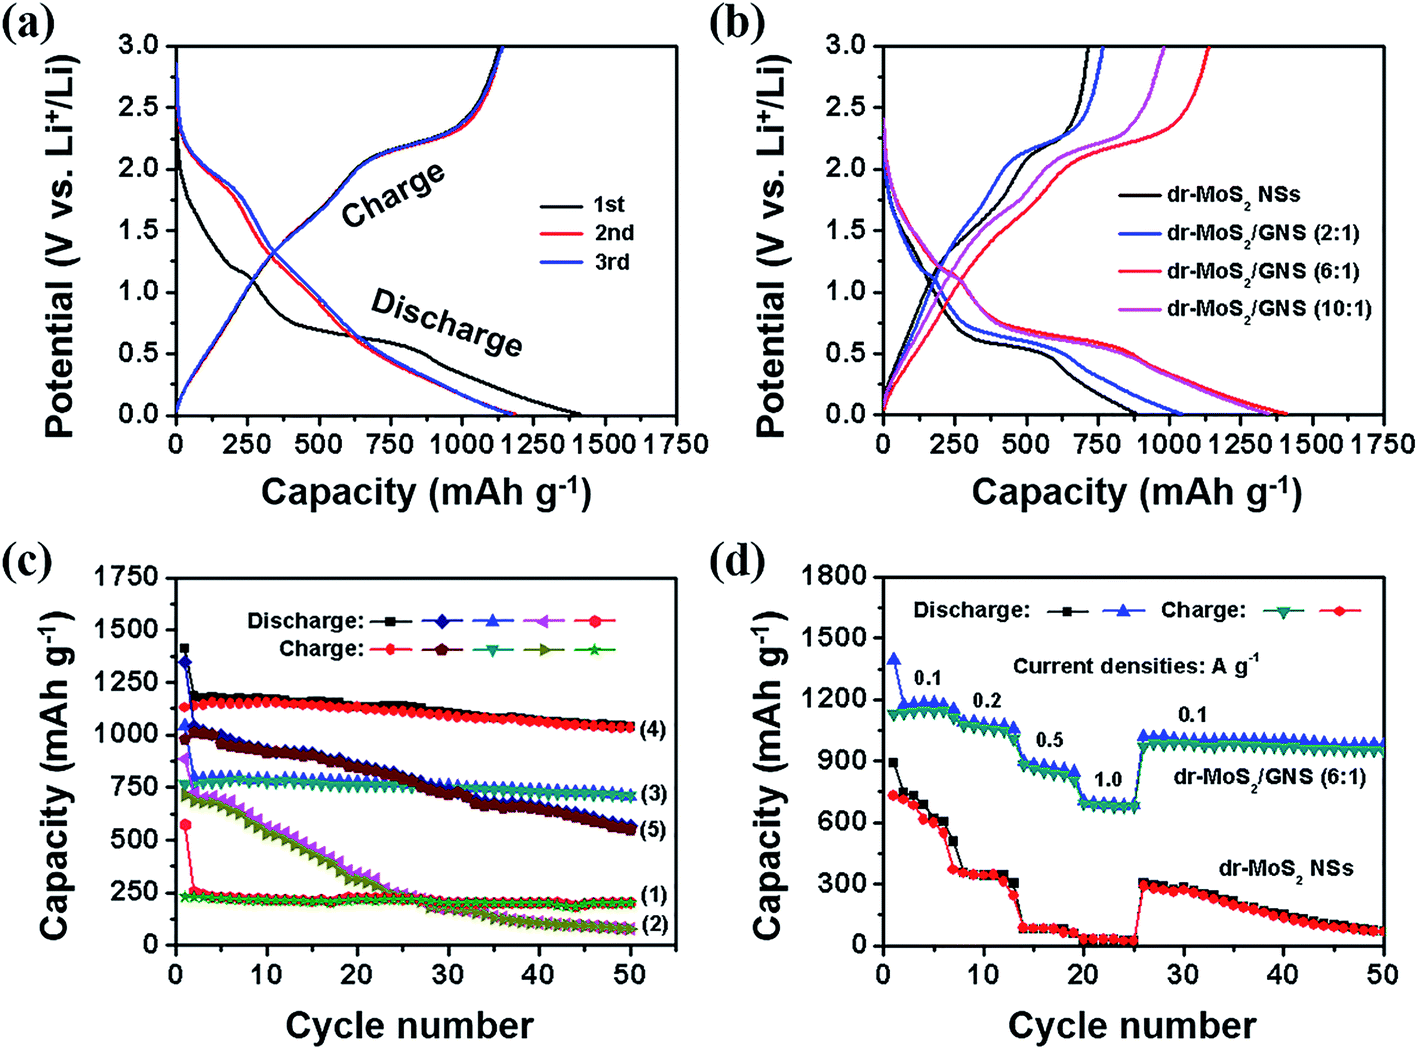
Fig. 8(a) shows the galvanostatic discharge–charge profiles of dr-MoS2/GNS (6:1) hybrid for the first three cycles at a current density of 0.1 A g−1. As seen in Fig. 8(a), two potential plateaus at ∼1.2 and ∼0.6 V in the first discharge (lithiation) curve are observed, which is in accordance with the CV results. In the 2nd and 3rd discharge curves, the potential plateau at ∼0.6 V in the first discharge disappears and two potential plateaus at ∼1.9 V and ∼1.2 V are observed, corresponding to the cathodic peak at 1.95 V and 1.26 V of CV curves. During the charge (delithiation) process, there is one potential plateau located at ∼2.3 V, which also agrees well with the previous CV curves. For bare GNS, only one flat potential plateau at ∼0.25 V in the first discharge curve is observed and the plateaus mentioned above for the dr-MoS2/GNS (6:1) hybrid are not found (Fig. S8, see ESI†). As shown in Fig. 8(b), the initial discharge capacities of GNS, dr-MoS2 NSs, dr-MoS2/GNS (2:1), dr-MoS2/GNS (6:1) and dr-MoS2/GNS (10:1) hybrids are 572.5, 886.1, 1043.2, 1412.4 and 1349.1 mA h g−1, while their initial charge capacities are 232.2, 715.2, 766.6, 1130.9 and 980.6 mA h g−1, respectively. The irreversible capacity loss during the first cycle is inevitable, which is attributed to the formation of the solid electrolyte interphase resulting from electrochemically driven electrolyte degradation. Notably, the initial charge capacity of dr-MoS2 NSs exceeds the theoretical capacity of MoS2 (∼669 mA h g−1) owing to the additional defect sites introduced to the surfaces of dr-MoS2 NSs. Among these samples, the dr-MoS2/GNS (6:1) hybrid exhibits the highest discharge/charge capacities during the first cycle. These results indicate that the greatly enhanced lithium storage capacity of dr-MoS2/GNS (6:1) hybrid is attributed to its optimum ratio of dr-MoS2 NSs to GNS, which maximize the synergetic effect between defect-rich MoS2 NSs and highly conductive graphene network.
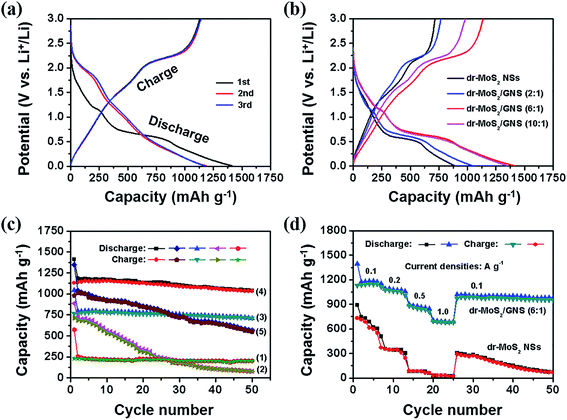 |
| | Fig. 8 (a) First three discharge/charge curves of dr-MoS2/GNS (6:1) hybrid. (b) The initial discharge/charge curves of dr-MoS2 NSs, dr-MoS2/GNS (2:1), dr-MoS2/GNS (6:1) and dr-MoS2/GNS (10:1) hybrids. (c) Cycling performance of (1) GNS, (2) dr-MoS2 NSs, (3) dr-MoS2/GNS (2:1), (4) dr-MoS2/GNS (6:1) and (5) dr-MoS2/GNS (10:1) hybrids in the voltage range from 0.01 to 3.0 V at a current density of 0.1 A g−1. (d) Rate performance of dr-MoS2 NSs and dr-MoS2/GNS (6:1) hybrid at various current densities. | |
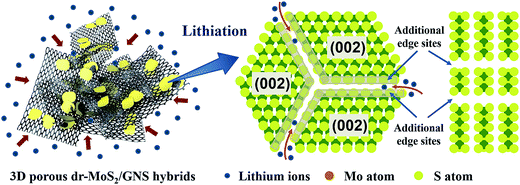
Not only high reversible capacity but also good cyclic stability is desirable for promising anode materials in LIBs. Fig. 8(c) shows the cycling behaviors of GNS, dr-MoS2 NSs and dr-MoS2/GNS hybrids at a current density of 0.1 A g−1. The GNS electrode manifests excellent cyclic stability, but its reversible capacity is only about 201.9 mA h g−1. Although the dr-MoS2 NS electrode has an initial charge capacity of 715.2 mA h g−1, it dramatically decreases to 312.8 mA h g−1 after 20 cycles and only delivers a reversible capacity of 78.2 mA h g−1 after 50 cycles. In contrast, dr-MoS2/GNS (2:1), dr-MoS2/GNS (6:1) and dr-MoS2/GNS (10:1) hybrids retain higher reversible capacities of 710.9, 1035.6 and 553.2 mA h g−1 after 50 cycles, respectively. Among these dr-MoS2/GNS hybrids, dr-MoS2/GNS (6:1) exhibits the highest reversible capacity, implying the significance of graphene content in the dr-MoS2/GNS hybrids. Associated with the structural and morphological analyses, the cyclic stability of dr-MoS2/GNS hybrids is strongly dependent on the dispersion degree of dr-MoS2 NSs in the matrix of graphene. The incorporation of graphene can not only efficiently prevent the aggregation of dr-MoS2 NSs, but also maintain the high electrical conductivity of overall dr-MoS2/GNS electrode and stabilize the electrode structure during the lithium-ions insertion/extraction process. Furthermore, as shown in Fig. S9 (see ESI†), the dr-MoS2 NSs generally exhibit higher reversible capacities than df-MoS2 NSs and bulk MoS2, even though they all show continuous capacity decay along with the cycling processes. The enhanced lithium storage capacity of dr-MoS2 NSs can be ascribed to the existence of abundant defects introduced to the surfaces of dr-MoS2 NSs, which leads to cracking of the basal planes and increases the accessible internal surface areas for the lithium ion insertion/extraction (Scheme 2). Moreover, the electrochemically active sites of MoS2 are specifically located at its edge planes rather than its basal planes.24 Thus, the defect-rich structure of dr-MoS2 NSs with cracks on the basal planes can significantly increase the exposure of much more additional active edge sites (as indicated by gray shading in Scheme 2), which results in greatly improved lithium storage performance.
 |
| | Scheme 2 (a) Schematic representation of 3D porous dr-MoS2/GNS hybrids during the lithium ion insertion/extraction process. (b) Constructed model of an individual defect-rich MoS2 nanosheet and illustration of the lithiation process at the active edge sites. Additional active edge sites are indicated by gray shading. | |
Fig. 8(d) displays the rate performance of dr-MoS2 NSs and dr-MoS2/GNS (6:1) hybrid tested at current densities of 0.1, 0.2, 0.5 and 1 A g−1. It can be clearly seen that the dr-MoS2/GNS (6:1) hybrid demonstrates a better rate performance than dr-MoS2 NSs. Specifically, the dr-MoS2/GNS (6:1) hybrid delivers a reversible capacity of about 1050, 850 and 680 mA h g−1 as the current density increases to 0.2, 0.5 and 1 A g−1, and shows good cycling stability even at a high current density. When the current density decreases back to 0.1 A g−1 after cycling under high current densities, the dr-MoS2/GNS (6:1) hybrid can still retain a high reversible capacity of about 960 mA h g−1 (about 85% of the initial charge capacity) with good cycling performance. In contrast, the reversible capacity of dr-MoS2 NSs fades to less than 30 mA h g−1 as the current density increases to 1 A g−1, and regains a capacity of about 290 mA h g−1 (only about 40% of the initial capacity) in the first cycle when the current density decreases back to 0.1 A g−1. Besides, dr-MoS2 NSs show serious capacity decay along with cycling after the current density is reversed back to 0.1 A g−1. The excellent cyclic stability and rate performance of dr-MoS2/GNS (6:1) hybrid could be attributed to the hierarchical hybrid structure with nanostructured dr-MoS2 NSs homogeneously dispersed in the matrix of conductive graphene network. Such structure can effectively hinder the aggregation of dr-MoS2 NSs, accommodate the volumetric expansion and subsequently protects active materials from pulverization during the lithiation/delithiation process.
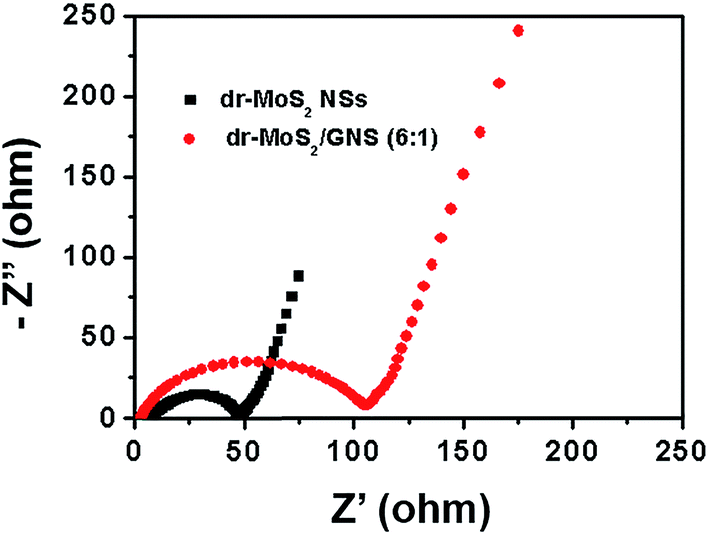
To better understand the superior electrochemical performance of dr-MoS2/GNS (6:1) hybrid in comparison with dr-MoS2 NSs, EIS measurements were carried out in a frequency range from 100 kHz to 0.01 Hz. Fig. 9 shows the Nyquist plots of dr-MoS2 NSs and dr-MoS2/GNS (6:1) electrodes after 5 cycles. It can be clearly seen that the dr-MoS2/GNS (6:1) electrode displays a much smaller radius of semicircle in the high-medium frequency region compared to that of dr-MoS2 NS electrode, indicating that the dr-MoS2/GNS (6:1) hybrid possesses much lower contact and charge-transfer resistance at the electrode/electrolyte interface. These results confirm that the incorporation of graphene can significantly enhance the electrical conductivity of the hybrid, thus facilitating rapid transfer of both lithium ions and electrons during the discharge–charge cycling process, which subsequently leads to significant improvement of electrochemical performance. Moreover, the dr-MoS2/GNS (6:1) hybrid has a 3D porous structure with large surface area, which shortens the diffusion paths of lithium ions, thus resulting in enhanced electrochemical kinetics of lithium storage. Therefore, the dr-MoS2/GNS (6:1) hybrid is able to demonstrate high reversible capacity, excellent cyclic stability and rate performance due to its hierarchical hybrid nanostructure, large surface area and high electrical conductivity.
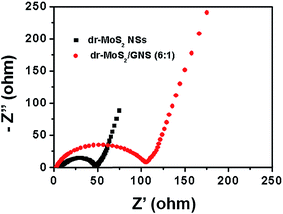 |
| | Fig. 9 Nyquist plots of dr-MoS2 NSs and dr-MoS2/GNS (6:1) hybrid measured in the frequency range from 100 kHz to 0.01 Hz with an AC voltage amplitude of 5.0 mV. | |
4. Conclusions
In summary, 3D porous dr-MoS2/GNS hybrids have been prepared by a simple hydrothermal co-assembly of GO and dr-MoS2 NSs, followed by the thermal reduction of GO to graphene. The ultrathin dr-MoS2 NSs can provide additional defect sites for rapid insertion/extraction of lithium ions, thus leading to greatly enhanced specific capacity. In addition, the conductive graphene network not only effectively prevents dr-MoS2 NSs from restacking or aggregation, but also provides highly conductive pathways facilitating the kinetics for both charge transfer and lithium ion transport throughout the dr-MoS2/GNS electrodes. Furthermore, the 3D porous structure of dr-MoS2/GNS hybrids can greatly enhance the specific surface area and pore volume, which facilitates rapid diffusion of lithium ions to access active materials and accommodates the volumetric expansion of active material during the discharge/charge cycling process. As a consequence, the dr-MoS2/GNS (6:1) hybrid delivers the highest reversible capacity of 1130.9 mA h g−1 at a current density of 0.1 A g−1, and retains 91.6% of the initial capacity after 50 cycles. Even at a current density of 1 A g−1, the capacity of dr-MoS2/GNS (6:1) hybrid can remain 680 mA h g−1, indicating a good rate performance. The high reversible capacity, excellent cyclic stability and rate performance of dr-MoS2/GNS hybrids are attributed to the synergetic effect between ultrathin dr-MoS2 NSs and highly conductive graphene network. Therefore, this work highlights the great potential of 3D porous dr-MoS2/GNS hybrids with excellent electrochemical performances as anode materials for high performance lithium ion batteries.
Acknowledgements
The authors are grateful for the financial support from the National Natural Science Foundation of China (51125011, 51433001).
Notes and references
- P. G. Bruce, B. Scrosati and J. M. Tarascon, Angew. Chem., Int. Ed., 2008, 47, 2930–2946 CrossRef CAS PubMed.
- J. H. Liu and X. W. Liu, Adv. Mater., 2012, 24, 4097–4111 CrossRef CAS PubMed.
- Z. G. Yang, J. L. Zhang, M. Kintner-Meyer, X. C. Lu, D. W. Choi, J. P. Lemmon and J. Liu, Chem. Rev., 2011, 111, 3577–3613 CrossRef CAS PubMed.
- B. Scrosati, J. Hassoun and Y. K. Sun, Energy Environ. Sci., 2011, 4, 3287–3295 CAS.
- K. S. Kang, Y. S. Meng, J. Breger, C. P. Grey and G. Ceder, Science, 2006, 311, 977–980 CrossRef CAS PubMed.
- M. Armand and J. M. Tarascon, Nature, 2008, 451, 652–657 CrossRef CAS PubMed.
- J. B. Goodenough and Y. Kim, Chem. Mater., 2010, 22, 587–603 CrossRef CAS.
- M. S. Dresselhaus and G. Dresselhaus, Adv. Phys., 1981, 30, 139–326 CrossRef CAS.
- F. Y. Cheng, J. Liang, Z. L. Tao and J. Chen, Adv. Mater., 2011, 23, 1695–1715 CrossRef CAS PubMed.
- M. Chhowalla, H. S. Shin, G. Eda, L. J. Li, K. P. Loh and H. Zhang, Nat. Chem., 2013, 5, 263–275 CrossRef PubMed.
- X. Huang, Z. Y. Zeng and H. Zhang, Chem. Soc. Rev., 2013, 42, 1934–1946 RSC.
- H. Matte, A. Gomathi, A. K. Manna, D. J. Late, R. Datta, S. K. Pati and C. Rao, Angew. Chem., Int. Ed., 2010, 49, 4059–4062 CrossRef CAS PubMed.
- Y. G. Yao, L. Tolentino, Z. Z. Yang, X. J. Song, W. Zhang, Y. S. Chen and C. P. Wong, Adv. Funct. Mater., 2013, 23, 3577–3583 CrossRef CAS PubMed.
- Z. Y. Zeng, T. Sun, J. X. Zhu, X. Huang, Z. Y. Yin, G. Lu, Z. X. Fan, Q. Y. Yan, H. H. Hng and H. Zhang, Angew. Chem., Int. Ed., 2012, 51, 9052–9056 CrossRef CAS PubMed.
- J. N. Coleman, M. Lotya, A. O'Neill, S. D. Bergin, P. J. King, U. Khan, K. Young, A. Gaucher, S. De, R. J. Smith, I. V. Shvets, S. K. Arora, G. Stanton, H. Y. Kim, K. Lee, G. T. Kim, G. S. Duesberg, T. Hallam, J. J. Boland, J. J. Wang, J. F. Donegan, J. C. Grunlan, G. Moriarty, A. Shmeliov, R. J. Nicholls, J. M. Perkins, E. M. Grieveson, K. Theuwissen, D. W. McComb, P. D. Nellist and V. Nicolosi, Science, 2011, 331, 568–571 CrossRef CAS PubMed.
- S. J. Ding, D. Y. Zhang, J. S. Chen and X. W. Lou, Nanoscale, 2012, 4, 95–98 RSC.
- X. D. Zhang and Y. Xie, Chem. Soc. Rev., 2013, 42, 8187–8199 RSC.
- S. Hu, W. Chen, J. Zhou, F. Yin, E. Uchaker, Q. F. Zhang and G. Z. Cao, J. Mater. Chem. A, 2014, 2, 7862–7872 CAS.
- H. Hwang, H. Kim and J. Cho, Nano Lett., 2011, 11, 4826–4830 CrossRef CAS PubMed.
- K. Chang and W. X. Chen, Chem. Commun., 2011, 47, 4252–4254 RSC.
- W. D. Qiu, J. Q. Jiao, J. Xia, H. M. Zhong and L. P. Chen, RSC Adv., 2014, 4, 50529–50535 RSC.
- Z. Wang, L. Ma, W. X. Chen, G. C. Huang, D. Y. Chen, L. B. Wang and J. Y. Lee, RSC Adv., 2013, 3, 21675–21684 RSC.
- Y. T. Lu, X. Y. Yao, J. Y. Yin, G. Peng, P. Cui and X. X. Xu, RSC Adv., 2015, 5, 7938–7943 RSC.
- J. V. Lauritsen, J. Kibsgaard, S. Helveg, H. Topsoe, B. S. Clausen, E. Laegsgaard and F. Besenbacher, Nat. Nanotechnol., 2007, 2, 53–58 CrossRef CAS PubMed.
- K. Zhang, H. J. Kim, J. T. Lee, G. W. Chang, X. J. Shi, W. J. Kim, M. Ma, K. J. Kong, J. M. Choi, M. S. Song and J. H. Park, ChemSusChem, 2014, 7, 2489–2495 CrossRef CAS PubMed.
- J. F. Xie, H. Zhang, S. Li, R. X. Wang, X. Sun, M. Zhou, J. F. Zhou, X. W. Lou and Y. Xie, Adv. Mater., 2013, 25, 5807–5813 CrossRef CAS PubMed.
- J. F. Xie, J. J. Zhang, S. Li, F. Grote, X. D. Zhang, H. Zhang, R. X. Wang, Y. Lei, B. C. Pan and Y. Xie, J. Am. Chem. Soc., 2014, 136, 17881–17888 Search PubMed.
- T. Stephenson, Z. Li, B. Olsen and D. Mitlin, Energy Environ. Sci., 2014, 7, 209–231 CAS.
- Q. F. Zhang, K. Yu, B. Zhao, Y. Wang, C. Q. Song, S. C. Li, H. H. Yin, Z. L. Zhang and Z. Q. Zhu, RSC Adv., 2013, 3, 10994–11000 RSC.
- K. S. Novoselov, A. K. Geim, S. V. Morozov, D. Jiang, Y. Zhang, S. V. Dubonos, I. V. Grigorieva and A. A. Firsov, Science, 2004, 306, 666–669 CrossRef CAS PubMed.
- Y. B. Zhang, Y. W. Tan, H. L. Stormer and P. Kim, Nature, 2005, 438, 201–204 CrossRef CAS PubMed.
- C. Rao, A. K. Sood, K. S. Subrahmanyam and A. Govindaraj, Angew. Chem., Int. Ed., 2009, 48, 7752–7777 CrossRef CAS PubMed.
- X. Cao, Y. Shi, W. Shi, X. Rui, Q. Yan, J. Kong and H. Zhang, Small, 2013, 9, 3433–3438 CrossRef CAS PubMed.
- Z. Wang, T. Chen, W. Chen, K. Chang, L. Ma, G. Huang, D. Chen and J. Y. Lee, J. Mater. Chem. A, 2013, 1, 2202–2210 CAS.
- X. S. Zhou, L. J. Wan and Y. G. Guo, Chem. Commun., 2013, 49, 1838–1840 RSC.
- K. Chang, D. S. Geng, X. F. Li, J. L. Yang, Y. J. Tang, M. Cai, R. Y. Li and X. L. Sun, Adv. Energy Mater., 2013, 3, 839–844 CrossRef CAS PubMed.
- K. Chang and W. X. Chen, ACS Nano, 2011, 5, 4720–4728 CrossRef CAS PubMed.
- K. Chang and W. X. Chen, J. Mater. Chem., 2011, 21, 17175–17184 RSC.
- Y. J. Gong, S. B. Yang, L. Zhan, L. L. Ma, R. Vajtai and P. M. Ajayan, Adv. Funct. Mater., 2014, 24, 125–130 CrossRef CAS PubMed.
- K. G. Zhou, N. N. Mao, H. X. Wang, Y. Peng and H. L. Zhang, Angew. Chem., Int. Ed., 2011, 50, 10839–10842 CrossRef CAS PubMed.
- W. S. Hummers and R. E. Offeman, J. Am. Chem. Soc., 1958, 80, 1339 CrossRef CAS.
- Y. Xu, K. Sheng, C. Li and G. Shi, ACS Nano, 2010, 4, 4324–4330 CrossRef CAS PubMed.
- C. Li and G. Q. Shi, Adv. Mater., 2014, 26, 3992–4012 CrossRef CAS PubMed.
- Y. Hou, B. Zhang, Z. H. Wen, S. M. Cui, X. R. Guo, Z. He and J. H. Chen, J. Mater. Chem. A, 2014, 2, 13795–13800 CAS.
- Y. M. Shi, Y. Wang, J. I. Wong, A. Tan, C. L. Hsu, L. J. Li, Y. C. Lu and H. Y. Yang, Sci. Rep., 2013, 3, 2169 Search PubMed.
- Z. J. Fan, W. Kai, J. Yan, T. Wei, L. J. Zhi, J. Feng, Y. M. Ren, L. P. Song and F. Wei, ACS Nano, 2011, 5, 191–198 CrossRef CAS PubMed.
- Y. Q. Sun, Q. Wu and G. Q. Shi, Energy Environ. Sci., 2011, 4, 1113–1132 CAS.
- J. Xiao, X. J. Wang, X. Q. Yang, S. D. Xun, G. Liu, P. K. Koech, J. Liu and J. P. Lemmon, Adv. Funct. Mater., 2011, 21, 2840–2846 CrossRef CAS PubMed.
- Q. Wang and J. H. Li, J. Phys. Chem. C, 2007, 111, 1675–1682 CAS.
Footnote |
| † Electronic supplementary information (ESI) available. See DOI: 10.1039/c5ra04391c |
|
| This journal is © The Royal Society of Chemistry 2015 |
Click here to see how this site uses Cookies. View our privacy policy here.