Xue Qiaoa,
Wei Songa,
Qi Wanga,
Ke-di Liua,
Zheng-xiang Zhangc,
Tao Boc,
Ren-yong Lid,
Li-na Liangd,
Yew-min Tzeng*e,
De-an Guoab and
Min Ye*ab
aState Key Laboratory of Natural and Biomimetic Drugs, School of Pharmaceutical Sciences, Peking University, 38 Xueyuan Road, Beijing 100191, China. E-mail: yemin@bjmu.edu.cn; Tel: +86 10 82801516
bState Key Laboratory of Drug Research, Shanghai Institute of Materia Medica, Chinese Academy of Sciences, 555 Zuchongzhi Road, Shanghai 201203, China
cAgilent Technologies, 3 Wangjing North Road, Beijing 100102, China
dThermoFisher Scientific Ltd., 8 Caihefang Road, Beijing 100085, China
eInstitute of Biochemical Sciences and Technology, Chaoyang University of Technology, Taichung 41349, Taiwan. E-mail: ymtzeng@cyut.edu.tw
First published on 20th May 2015
Antrodia cinnamomea is a precious medicinal mushroom used in adjuvant treatments of cancer. Triterpenoids (25R/S-ergostane epimers and Δ7,9/Δ8-lanostanes) and polysaccharides are its major bioactive constituents. Quality control of this mushroom is difficult, due to a lack of effective analytical methods. In this study, a series of methods were established to analyze A. cinnamomea. The ergostane- and lanostane-type triterpenoids were extracted by 50% and 100% methanol, respectively, and were then analyzed by ultra-high performance liquid chromatography coupled with diode-array detection and quadrupole time-of-flight mass spectrometry (UHPLC/DAD/qTOF-MS). In total 49 compounds, including 34 ergostanes and 10 lanostanes, were characterized by comparing with 31 reference standards or by analyzing the UV and MS spectral data. Furthermore, the contents of 18 major triterpenoids, including 10 ergostanes and 8 lanostanes, were determined by UPLC/UV or supercritical fluid chromatography coupled with mass spectrometry (SFC/MS, for 25R/S-antcin A) within 16 min. This is the first time that the contents of pure optical forms for 5 pairs of 25R- and 25S-ergostane epimers (antcins A, B, C, H, and K) were determined. On the other hand, the polysaccharides in A. cinnamomea were analyzed by ion chromatography coupled with pulsed amperometric detection (IC/PAD) after acid hydrolysis, and the contents of 7 monosaccharides were determined. Finally, the established methods were applied to the analysis of 15 batches of A. cinnamomea. Samples derived from different cultivation techniques could be distinguished according to the contents of triterpenoids. The UPLC/UV, SFC/MS and IC/PAD methods established in this work provided powerful tools to evaluate the quality of A. cinnamomea.
A. cinnamomea contains a complicated array of tetracyclic triterpenoids, including ergostanes and lanostanes. They are considered as the major bioactive constituents of A. cinnamomea.1 Thus far, at least 40 ergostanes and 13 lanostanes have been isolated from this herbal medicine, and they have been reported to possess anti-cancer, anti-inflammatory and hepatoprotective activities.4–8 These triterpenoids have very similar structures, only differing in the number, location or stereochemistry of hydroxyl groups, which renders their separation difficult. As a result, the separation of a crude extract usually needs 60–100 min.9–11 Moreover, the ergostanes in A. cinnamomea occur as C-25 epimeric pairs, and the resolution of epimers are even more difficult.12 In most previous reports, the epimers are considered as one single compound due to poor chromatographic separation, and due to lack of pure reference standards. Recently, we have isolated the pure optical forms of eight pairs of ergostane epimers from A. cinnamomea, and fully established the stereochemistry of C-25.4 We have also developed an analytical SFC method to separate ergostane epimers, which was proved to be rapid and efficient for low-polarity epimers like 25R/S-antcin A.13 On the other hand, the lanostanes in A. cinnamomea include Δ7,9(11) and Δ8 types. The Δ8 lanostanes have never been included in previous analytical studies due to their poor UV absorption. Therefore, new simple and efficient methods for qualitative and quantitative analyses of triterpenoids in A. cinnamomea are of significance.
Polysaccharides are another important class of bioactive chemicals in A. cinnamomea. They have been reported to exhibit anti-cancer, anti-inflammatory, and anti-hepatitis B virus activities.1,14,15 Although a few polysaccharides have been purified,1 little is known on the chemical composition of polysaccharides in A. cinnamomea. Several groups have analyzed the hydrolysis products of polysaccharides by gas chromatography.16 This method suffered from tedious chemical derivatization of the samples. Ion chromatography coupled with pulsed amperometric detection (IC/PAD) is a rapid, effective, and sensitive technique for the analysis of saccharides.17 More importantly, the samples can be directly analyzed without derivatization.
In the present study, we determined the contents of 18 major triterpenoids in A. cinnamomea by UPLC/UV (16 min analysis time) and SFC/MS (5 min), and characterized 31 minor compounds by comparing to reference standards or by UHPLC/DAD/qTOF-MS analysis. Particularly, the contents of pure optical forms for 5 pairs of 25R- and 25S-ergostane epimers, together with Δ8 lanostanes that have poor UV absorption, were determined for the first time. Moreover, polysaccharide composition of A. cinnamomea was profiled in acid-hydrolyzed water extracts by IC/PAD analysis. These rapid and efficient methods were applied to the analysis of 15 batches of A. cinnamomea samples.
![]() | ||
Fig. 2 Maximum UV absorption for ergostanes (A) and lanostanes (B), and their preliminary separation from Antrodia cinnamomea using a stepwise extraction (C). |
The ergostanes and lanostanes yielded intensive [M − H]− ions in (−)-ESI mode. The lanostanes carry fewer hydroxyl groups than ergostanes, and are more difficult to dissociate in MS/MS analysis upon collision-induced dissociation. Therefore, a CID collision energy 40 eV was used for ergostanes, and 55 eV was used for lanostanes. Collision induced dissociation of the [M − H]− ions included cleavages at the side chain and the tetracyclic backbone.19–21 For ergostanes, the 25R- and 25S-epimers showed identical fragments. Meanwhile, we found that subtle changes in the triterpenoid structures could lead to remarkable differences in tandem mass spectrometry fragmentations. For instance, isomers E16/E27 (m/z 469) and E7/E22 (m/z 485) showed very different MS/MS spectra. Therefore, it is important to study authentic standards with different substitution patterns, and to summarize their fragmentation pathways.
All ergostanes investigated in this study have a COOH group at C-25. They could produce [M − 44]− ions from [M − H]− in their MS/MS spectra. The loss of 43.9895 Da for E34 was assigned to CO2 (calcd 43.9898) cleavage of the side chain (Fig. 4). MS/MS spectra of E34, E29 and E27 were dominated by [M − 60]− ions. The loss of 60.0212 Da was assigned to C2H4O2 (calcd 60.0211). This fragment was also derived from the side chain, as shown in Fig. 4.19,22 The abundant [M − 60]− ion could be a diagnostic signal for 7-ΔO/7-H ergostanes.
![]() | ||
Fig. 4 (−)-ESI-MS/MS spectra of representative 7-H, 7-ΔO and 7-OH ergostanes (E10, E16, E27, E29, and E34). |
Compounds E16 and E10 are 7-OH ergostanes. They produced abundant m/z 247, 259 and 301 fragments. As depicted in Fig. 4, following the neutral loss of CO2, 7-OH of E16 could trigger B-ring RDA fragmentation to produce m/z 301.2166 (C20H29O2, Δ = −2.2 ppm) and m/z 123.0812 (C8H11O, Δ = 3.0 ppm). It could also lead to B/C-ring cleavage to yield m/z 259.2062 (C18H27O, Δ = 1.9 ppm) and m/z 247.2071 (C17H27O, Δ = −1.6 ppm).
Fragments m/z 247, 259 and 301 could be considered as diagnostic ions for 7-OH ergostanes. They were also observed in two other 7-OH compounds E7 and E1. The product ion at m/z 83 should be derived from RDA cleavage of A-ring. Ergostanes E21 and E22 were substituted by –OH at C-12 position. Their MS/MS spectra were dominated by fragments [M − H − 44 − 18]−, [M − H − 44 − 28]−, and [M − H − 44 − 58]−. For instance, E21 ([M − H]− m/z 483) produced three major product ions at m/z 421, 411, and 381. The loss of 61.9988, 71.9837, and 101.9947 was assigned to CO2 + H2O, CO2 + CO, and CO2 + CO + CH2O (calcd 62.0004, 71.9847 and 101.9953), respectively. The fragmentation pathway was proposed in Fig. 5. Yang et al. have also reported that 12-OH could trigger the neutral loss of CH2O in lanostane-type triterpenoids.19 Their report was consistent with our finding. Compound E22 is a 3-OH analogue of E21. It also showed abundant [M − CO2 − H2O]−, [M − CO2 − CO]− and [M − CO2 − CO − CH2O]− fragments.
![]() | ||
Fig. 5 (−)-ESI-MS/MS spectra of representative 12-OH, 4-OH, and Δ14(15) ergostanes (E1, E7, E13, E21, and E22). |
Compounds E1 and E7 are 4-OH ergostanes. They could readily produce [M − 62]− ions in their MS/MS spectra, which was due to the loss of CO2 and H2O. For example, ergostane E7 could produce m/z 423.2905 (C28H39O3, Δ = −0.07 ppm). Similarly, E1 could eliminate CO2 and H2O to produce m/z 425, or CO2 + 2H2O to produce m/z 407. A fragment from B-ring cleavage was also observed for E7 (m/z 137).
Antcin F (E13) contains a Δ14 double bond. Its MS/MS spectrum was different from other ergostanes. It produced m/z 233 due to CO2 elimination and C-ring cleavage. Upon a successive A-ring cleavage, m/z 149 and 83 could also be observed.
Another 14 unknown ergostanes were detected from the ergostanes-enriched extract. Their structures were tentatively characterized by analyzing their spectral data (Table 1). Six ergostanes were detected in the extracted ion chromatogram (EIC) of m/z 485. Among them, E7/E8 and E22/E23 were identified by comparing with reference standards. E6 and E12 showed identical MS and MS/MS spectra. The diagnostic fragments at m/z 149 and 233 were the same as those of E13, indicating there was a Δ14 double bond in the molecule, and that the structures for A/B/C ring were the same as that of E13. The molecular weights of E6 and E12 were 18 Da (H2O) greater than E13. Thus, E6 and E12 were tentatively characterized as hydrated antcin F. The hydration may possibly take place at the Δ24(28) double bond. E14 showed identical mass spectra to that of E13, and was identified as the C-25 epimer of E13. E31 and E32 showed [M − H]− ions at m/z 511.3057 and m/z 511.3061, respectively, establishing their formula as C31H44O6. Their UV spectra showed a maximum absorption at 250 nm, which was consistent with 7-H or 7-OH ergostanes (Fig. 2). The MS/MS spectra showed a major fragment at m/z 59.0141 (C2H3O2, Δ = −4.12 ppm), indicating the presence of an acetoxyl (OAc) group. The above information was consistent with the previously reported antcin G.23 The fragments at m/z 391 and 407 were assigned to [M − H − HOAc − CO2]− and [M − H − HOAc − C2H4O2]−, respectively. Although we had found that free 7-OH could trigger the A/B ring cleavage, acetylation of 7-OH resulted in a MS/MS fragmentation pattern similar to that for 7-H ergostanes. Given their similar HPLC retention times, E31 and E32 were tentatively characterized as 25R/S-epimers of antcin G. Their fragmentation pathways were proposed (Fig. 2S†).
No.a | tR (min) | λmax (nm) | Formula | HRMSb (m/z) | Δm (ppm) | MS/MS (m/z) | Identification | ||
---|---|---|---|---|---|---|---|---|---|
Calcd | Meas | ||||||||
a *Compounds identified by comparing with reference standards; w, UV signals were weak.b Measured and predicted [M − H]− for E1–E34, L1–L10, [M + H]+ for O1–O4, and [M + Na]+ for O5. | |||||||||
* | E1 | 4.083 | 254 | C29H44O6 | 487.3065 | 487.3072 | −1.41 | 147, 247, 301 | Antcin K, S |
* | E2 | 4.175 | 254 | C29H44O6 | 487.3065 | 487.3070 | −1.00 | 147, 247, 301 | Antcin K, R |
* | E3 | 4.559 | w | C29H44O6 | 487.3065 | 487.3074 | −1.82 | 245, 391, 407, 425 | Camphoratin A |
E4 | 4.767 | 259 | C29H42O7 | 501.2858 | 501.2867 | −1.84 | 149, 245, 395, 423, 439 | 12-OH antcamphin E/F | |
E5 | 5.235 | 259 | C29H42O7 | 501.2858 | 501.2859 | −0.24 | 149, 245, 395, 423, 439 | 12-OH antcamphin E/F | |
E6 | 4.834 | w | C29H42O6 | 485.2909 | 485.2904 | 0.95 | 149, 233 | Hydrated antcin F (Δ14) | |
* | E7 | 5.360 | w | C29H42O6 | 485.2909 | 485.2901 | 1.57 | 137, 247, 301, 423 | Antcamphin E, S |
* | E8 | 5.627 | w | C29H42O6 | 485.2909 | 485.2899 | 1.98 | 137, 247, 301, 423 | Antcamphin F, R |
E9 | 5.460 | w | C29H40O7 | 499.2701 | 499.2703 | −0.35 | 107, 245, 301 | New ergostane (tetra-O-substituted) | |
* | E10 | 5.652 | 257 | C29H44O5 | 471.3116 | 471.3109 | 1.48 | 83, 121, 247, 259, 301 | Antcamphin K, S |
* | E11 | 5.952 | 257 | C29H44O5 | 471.3116 | 471.3111 | 1.05 | 83, 121, 247, 259, 301 | Antcamphin L, R |
E12 | 5.860 | 261 | C29H42O6 | 485.2909 | 485.2903 | 1.16 | 149, 233 | Hydrated antcin F (Δ14) | |
* | E13 | 6.936 | 300 | C29H40O5 | 467.2803 | 467.2798 | 1.06 | 149, 233 | Antcin F |
E14 | 7.245 | w | C29H40O5 | 467.2803 | 467.2810 | −1.50 | 149, 233 | Antcin F epimer | |
E15 | 7.111 | w | C29H40O7 | 499.2701 | 499.2704 | −0.55 | 83, 123, 207, 249 | New ergostane (tetra-O-substituted) | |
* | E16 | 7.177 | 255 | C29H42O5 | 469.2959 | 469.2954 | 1.17 | 83, 123, 247, 259, 301 | Antcin C, S |
* | E17 | 7.437 | 255 | C29H42O5 | 469.2959 | 469.2958 | 0.31 | 83, 123, 247, 259, 301 | Antcin C, R |
E18 | 7.236 | w | C29H40O6 | 483.2752 | 483.2744 | 1.68 | 83, 123, 245, 379, 395, 439 | New ergostane (3-ΔO, 7-OH, 12-OH, Δ) | |
E19 | 7.320 | w | C29H40O6 | 483.2752 | 483.2745 | 1.47 | 83, 123, 245, 379, 395, 439 | New ergostane (3-ΔO 7-OH, 12-OH, Δ) | |
* | E20 | 7.604 | w | C29H40O6 | 483.2752 | 483.2746 | 1.26 | 381, 411, 421, 439 | Antcamphin I, R |
* | E21 | 7.704 | w | C29H40O6 | 483.2752 | 483.2748 | 0.85 | 381, 411, 421, 439 | Antcamphin J, S |
* | E22 | 7.670 | 275 | C29H42O6 | 485.2909 | 485.2904 | 0.95 | 383, 413, 423, 441 | Antcin H, R |
* | E23 | 7.837 | 275 | C29H42O6 | 485.2909 | 485.2903 | 1.16 | 383, 413, 423, 441 | Antcin H, S |
E24 | 8.071 | w | C29H40O6 | 483.2752 | 483.2746 | 1.26 | 83, 379, 395, 421, 423, 439 | Antcin D | |
E25 | 8.638 | w | C29H40O7 | 499.2701 | 499.2708 | −1.34 | 97, 207, 411 | New ergostane (tetra-O-substituted) | |
E26 | 8.805 | w | C29H40O7 | 499.2701 | 499.2706 | −0.95 | 97, 207, 411 | New ergostane (tetra-O-substituted) | |
* | E27 | 9.138 | 272 | C29H42O5 | 469.2959 | 469.2959 | 0.10 | 409, 425 | Antcin I, R |
* | E28 | 9.213 | 272 | C29H42O5 | 469.2959 | 469.2966 | −1.39 | 409, 425 | Antcin I, S |
* | E29 | 9.397 | 270 | C29H40O5 | 467.2803 | 467.2802 | 0.21 | 407, 423 | Antcin B, S |
* | E30 | 9.489 | 270 | C29H40O5 | 467.2803 | 467.2800 | 0.64 | 407, 423 | Antcin B, R |
E31 | 9.772 | w | C31H44O6 | 511.3065 | 511.3057 | 1.59 | 59, 391, 407 | Antcin G (25R/S epimer) | |
E32 | 9.856 | w | C31H44O6 | 511.3065 | 511.3061 | 0.81 | 59, 391, 407 | Antcin G (25R/S epimer) | |
* | E33/34 | 10.982 | 255 | C29H40O4 | 453.3010 | 453.3008 | 0.51 | 309, 393 | Antcin A, S + R |
* | L1 | 8.146 | 244 | C30H46O4 | 469.3323 | 469.3315 | 1.77 | 83, 97 | 3β,15α-Dihydroxylanosta-7,9(11),24(28)-triene-21-oic acid |
L2 | 8.363 | 198 | C30H48O4 | 471.3480 | 471.3488 | −1.73 | 83, 97 | 3β,15α-Dihydroxylanosta-8,24(28)-diene-21-oic acid | |
* | L3 | 9.022 | 244 | C31H48O4 | 483.3480 | 483.3477 | 0.59 | 83, 97 | Dehydrosulphurenic acid |
* | L4 | 9.247 | 198 | C31H50O4 | 485.3636 | 485.3635 | 0.27 | 83, 97, 181 | Sulphurenic acid |
* | L5 | 11.532 | w | C33H50O5 | 525.3585 | 525.3592 | −1.24 | 59 | 15α-Acetyldehydrosulphurenic acid |
L6 | 11.858 | w | C33H52O5 | 527.3742 | 527.3743 | −0.19 | 59 | Versisponic acid D | |
L7 | 13.956 | w | C30H46O3 | 453.3374 | 453.3372 | 0.48 | 97, 325 | 3β-Hydroxylanosta-7,9(11),24(28)-triene-21-oic acid | |
L8 | 14.360 | w | C30H48O3 | 455.3531 | 455.3530 | 0.15 | 97, 210, 275 | 3β-Hydroxylanosta-8,24(28)-diene-21-oic acid | |
* | L9 | 14.644 | 244 | C31H48O3 | 467.3531 | 467.3533 | −0.49 | 97, 337 | Dehydroeburicoic acid |
* | L10 | 15.069 | 198 | C31H50O3 | 469.3687 | 469.3688 | −0.17 | 97, 339 | Eburicoic acid |
* | O1 | 4.129 | w | C24H36O5 | 405.2636 | 405.2635 | 0.13 | Antcamphin A | |
* | O2 | 6.306 | w | C26H36O4 | 413.2686 | 413.2691 | −1.13 | Antcamphin B | |
* | O3 | 12.412 | w | C29H42O3 | 439.3207 | 439.3210 | −0.75 | Antcamphin C, trans | |
* | O4 | 12.645 | w | C29H42O3 | 439.3207 | 439.3212 | −1.21 | Antcamphin D, cis | |
* | O5 | 9.919 | w | C26H38O7 | 485.2519 | 485.2510 | −2.00 | 4-Acetyl-antroquinonol B |
E4/E5 had a molecular formula of C29H42O7, which was new for A. cinnamomea ergostanes. Thus, they were detected from this mushroom for the first time. The MS/MS spectra of [M − H]− at m/z 501 were similar to those of E7, showing a fragment ion at m/z 439 due to the loss of 62 Da (CO2 + H2O). Thus, they should contain hydroxyl groups at C-4 and C-7. The neutral loss of 28 Da from m/z 423 to 395 was similar to E21/E22, and indicated the presence of a hydroxyl group at C-12 (Fig. 2S†). Thus, the structures for E4/E5 were tentatively characterized as 12-hydroxyl antcamphin E/F. E18/E19/E24 all had the molecular formula C29H40O6 ([M − H]− m/z 483). E24 could fragment into m/z 423 due to the loss of 60 Da (C2H4O2), and m/z 421 due to the loss of 62 Da (CO2 + H2O). This information was consistent with the known antcin D.23 E18/E19 showed similar MS/MS spectra to E4 and E5, except that m/z 83 and m/z 123 were observed, and the [M − CO2 − H2O]− ion was absent. Thus, their C-4 was not substituted with hydroxyl group. They were identified as 3-ΔO, 7-OH, 12-OH, Δ-ergostanes (Table 1). E9, E15, E25 and E26 had the same molecular formula C29H40O7 ([M − H]− m/z 499), which was also new for A. cinnamomea. They should be ergostanes with tetra-O-substitutions, though the structures could not be established due to limited structural information.
Lanostanes exhibited only a few fragment ions upon CID at a collision energy of 50 eV, probably due to their low level of oxygenation (Fig. 3S†). Common fragment ions included m/z 83 (C6H11) or m/z 97 (C7H13) derived from the side chain,21 together with m/z 59 from the acetyl groups. Thus, we could only determine the molecular formula of lanostanes according to the high-resolution mass spectral data, and little structural information could be obtained from the tandem mass spectra. Fortunately, we found the lanostanes in A. cinnamomea were present in pairs, containing either Δ7,9(11) or Δ8 double bond. For each pair, the two compounds usually had very similar HPLC retention times. Moreover, the characteristic maximal UV absorption (around 242 and 198 nm for Δ7,9(11) and Δ8 lanostanes, respectively) could also assist in identifying their structures. A total of 10 lanostanes were characterized, and 6 of them (L1, L3, L4, L5, L9, L10) were further confirmed by comparing with reference standards. L2, L7 and L8 were reported from A. cinnamomea for the first time. L7 had been reported from Poria cocos (Fu-Ling), which is also a medicinal mushroom from polyporaceae family.24 Although L2 and L8 were present in A. cinnamomea in noticeable amounts, they might be neglected in previous phytochemical studies due to their poor UV absorption.
Two nor-ergostanes O1 and O2, as well as two ergostane aldehydes O3 and O4, were identified from A. cinnamomea by LC/MS. We had reported these novel ergostanes from the fruiting bodies very recently.4 O1 and O2 contained fewer carbon atoms (24C and 26C, respectively) than normal ergostanes (29C). O3 and O4 were the first ergostane aldehydes reported from A. cinnamomea. Because they do not contain a carboxyl group, their ionization was poor in the (−)-ESI mode. Thus, they were analyzed in the positive ion mode (Fig. 1S†). We also detected a cyclohexenone (O5), which was identified by comparing with a reference standard.
We tested different types of reversed-phase columns including Acquity CSH C18 (2.1 × 100 mm, 1.7 μm, Waters, MA, USA), Zorbax SB-C8 (2.1 × 150 mm, 1.8 μm, Agilent), Zorbax SB–Phenyl (2.1 × 150 mm, 1.8 μm, Agilent); Zorbax Eclipse Plus Phenyl–Hexyl (2.1 × 100 mm, 1.8 μm, Agilent); Zorbax Eclipse Plus C18 (2.1 × 150 mm, 1.8 μm, Agilent); HSS T3 (1.8 μm, 2.1 × 150 mm, Waters). HSS T3 showed the best resolution to ergostane epimers (Fig. 4S†), and was chosen for quantitation. Meanwhile, we found that a small portion of methanol in the mobile phase could alter the distribution of major ergostanes.25 Thus, acetonitrile containing 1% methanol was used as the organic phase. A column temperature at 45 °C could significantly improve the resolution than 40 °C, and was finally used (Fig. 5S†). Different flow rates (0.2, 0.3, 0.4 mL min−1) showed little contribution to the resolution, and the flow rate of 0.4 mL min−1 was used. The column pressure before injection was 9250 psi.
According to their UV absorption maxima, different types of triterpenoids were detected at varied wavelengths. The 7-OH/H ergostanes (E1, E2, E22, E23) and Δ7,9(11) lanostanes (L1, L3, L5, L9) were detected at 250 nm, and 7-ΔO ergostanes (E16, E17, E29, E30) were monitored at 270 nm (Fig. 6A). The 12 major peaks were well separated within 16 minutes.
Linearity of the 12 analytes were r2 > 0.9990 in a dynamic range of no less than 40 folds (1–8.33 μg mL−1 to 40–480 μg mL−1, Table 2). Precision was determined by calculating the relative standard deviation (RSD) of peak areas at three concentration levels measured in the same day (n = 5) and on three consecutive days. Intra- and inter-day precision was 0.70–1.80% and 0.22–2.12%, respectively, suggesting acceptable variation of the method. Accuracy was evaluated by standard addition test at three concentration levels (n = 3 for each level). QC solutions were spiked into a sample matrix as described in section 2.3. The recovery rates were calculated to represent accuracy of the method (recovery = amount found/amount spiked × 100%). Recoveries of the 12 triterpenoids ranged from 93.18–112.06% (Table 3). The limits of quantitation (LOQ, S/N = 10, assigned as the lowest concentration of the calibration curve) ranged from 1–8.33 μg mL−1, while the limits of detection (LOD, S/N = 3) were lower than 0.3 μg mL−1 for the analytes. Repeatability was evaluated by preparing triplicate samples at three different concentrations, and calculating the RSD values of peak areas. Variation introduced by sample preparation was lower than 4.51%. Stability was determined by analyzing samples after 2, 4, 8, 12, 24, 36 h storage in the sample tray. Variation resulted from storage never exceeded 4.88% (Table 1S†).
Detection | Calibration equation | r2 | Range (μg mL−1) | |
---|---|---|---|---|
a UV 198 nm data were collected after subtraction of a blank run (methanol). | ||||
E1 | UV 250 nm | y = 1642.2x + 1654.6 | 0.9999 | 3.33–320 |
E2 | UV 250 nm | y = 1430.6x + 1806.0 | 0.9999 | 5.00–480 |
E16 | UV 250 nm | y = 2053.6x + 674.62 | 0.9997 | 3.13–150 |
E17 | UV 250 nm | y = 2045.9x + 1841.4 | 0.9996 | 3.13–150 |
E22 | UV 270 nm | y = 2628.5x + 2458.6 | 0.9998 | 3.33–160 |
E23 | UV 270 nm | y = 2119.3x + 3644.5 | 0.9999 | 5.00–480 |
L1 | UV 250 nm | y = 1958.6x + 2181.5 | 0.9999 | 6.67–320 |
L3 | UV 250 nm | y = 2435.4x − 701.63 | 0.9998 | 5.00–480 |
E29 | UV 270 nm | y = 2256.1x + 2242.2 | 0.9998 | 4.17–200 |
E30 | UV 270 nm | y = 2546.2x + 1878.8 | 0.9998 | 3.33–160 |
L5 | UV 250 nm | y = 2252.3x + 268.98 | 0.9994 | 1.00–40 |
L9 | UV 250 nm | y = 3129.7x + 4595.2 | 0.9999 | 8.33–400 |
L10 | UV 198 nma | y = 4.6725x − 2.5000 | 0.9999 | 4.00–400 |
E1 | E2 | E16 | E17 | E22 | E23 | L1 | L3 | E29 | E30 | L5 | L9 | L10 | |
---|---|---|---|---|---|---|---|---|---|---|---|---|---|
Matrix (μg) | 20.26 | 38.51 | 19.91 | 12.70 | 23.21 | 42.72 | 33.14 | 49.36 | 26.21 | 15.41 | 2.05 | 29.18 | 44.04 |
RSD (%) | 0.41 | 0.41 | 2.29 | 0.07 | 0.54 | 0.52 | 0.54 | 0.53 | 0.40 | 0.57 | 0.06 | 0.48 | 0.90 |
![]() |
|||||||||||||
Low QC | |||||||||||||
Spiked (μg) | 10.67 | 24.00 | 10.00 | 3.67 | 11.00 | 20.00 | 16.00 | 20.00 | 17.33 | 7.00 | 0.73 | 13.33 | 20.00 |
Found (μg) | 10.61 | 23.24 | 9.81 | 3.81 | 11.48 | 20.03 | 17.16 | 20.73 | 19.42 | 6.85 | 0.76 | 13.31 | 20.77 |
Accuracy (%) | 99.50 | 96.82 | 98.07 | 101.75 | 104.32 | 100.13 | 107.24 | 103.63 | 112.06 | 97.92 | 103.07 | 98.29 | 103.87 |
RSD (%) | 3.20 | 3.49 | 4.31 | 3.51 | 3.33 | 3.39 | 3.64 | 2.99 | 2.12 | 2.63 | 4.09 | 3.50 | 1.16 |
![]() |
|||||||||||||
Medium QC | |||||||||||||
Spiked (μg) | 21.33 | 48.00 | 20.00 | 7.33 | 22.00 | 40.00 | 32.00 | 40.00 | 34.67 | 14.00 | 1.47 | 26.67 | 40.00 |
Found (μg) | 21.00 | 45.89 | 18.64 | 7.78 | 22.65 | 39.58 | 33.88 | 41.22 | 38.60 | 13.56 | 1.48 | 26.29 | 40.21 |
Accuracy (%) | 98.43 | 95.61 | 93.18 | 106.40 | 102.94 | 98.95 | 105.89 | 103.06 | 111.34 | 96.88 | 100.69 | 98.75 | 100.51 |
RSD (%) | 0.98 | 0.84 | 2.85 | 1.04 | 1.17 | 1.29 | 1.06 | 1.32 | 0.93 | 1.75 | 1.31 | 1.13 | 0.18 |
![]() |
|||||||||||||
High QC | |||||||||||||
Spiked (μg) | 32.00 | 72.00 | 30.00 | 11.00 | 33.00 | 60.00 | 48.00 | 60.00 | 52.00 | 21.00 | 2.20 | 40.00 | 60.00 |
Found (μg) | 31.18 | 68.31 | 27.96 | 11.30 | 34.48 | 58.85 | 50.41 | 61.18 | 57.52 | 20.10 | 2.19 | 39.18 | 58.67 |
Accuracy (%) | 97.42 | 94.88 | 93.18 | 102.22 | 104.50 | 98.08 | 105.03 | 101.96 | 110.61 | 95.71 | 99.34 | 97.77 | 97.79 |
RSD (%) | 0.70 | 0.78 | 2.47 | 0.89 | 1.58 | 0.49 | 0.70 | 0.40 | 0.57 | 0.18 | 0.81 | 0.31 | 0.95 |
No. | Ergostanes (mg g−1) | Lanostanes (mg g−1) | Total | ||||||||||||||||||
---|---|---|---|---|---|---|---|---|---|---|---|---|---|---|---|---|---|---|---|---|---|
E1 | E2 | E16 | E17 | E22 | E23 | E29 | E30 | E33 | E34 | Sum | L1 | L2a | L3 | L4a | L5 | L6a | L9 | L10 | Sum | ||
a Semi-quantified by using the calibration curve of L10; ND, not detected.b E1/E2, 25S/R-antcin K; E16/E17, 25S/R-antcin C; E22/E23, 25R/S-antcin H; E29/E30, 25S/R-antcin B; E33/E34, 25S/R-antcin A; L1, 3β,15α-dihydroxylanosta-7,9(11),24-triene-21-oic acid; L3, dehydrosulphurenic acid; L5, 15α-acetyldehydrosulphurenic acid; L9, dehydroeburicoic acid. | |||||||||||||||||||||
Wood culture, fruiting bodies | |||||||||||||||||||||
S1 | 11.4 | 19.8 | 3.4 | 1.8 | 5.9 | 13.3 | 7.9 | 4.6 | 0.5 | 0.2 | 68.8 | 7.8 | 3.9 | 9.7 | 23.8 | 1.6 | 3.5 | 2.0 | 13.9 | 66.2 | 135.0 |
S2 | 7.6 | 10.8 | 4.5 | 3.5 | 4.3 | 8.3 | 2.4 | 1.3 | 0.3 | 0.2 | 43.2 | 10.3 | 3.4 | 12.8 | 19.6 | 0.7 | ND | 8.1 | 12.2 | 67.1 | 110.3 |
S3 | 12.6 | 21.8 | 11.1 | 9.3 | 11.2 | 20.1 | 11.4 | 6.4 | 0.3 | 0.2 | 104.4 | 9.8 | 4.1 | 8.0 | 10.2 | 2.0 | 1.7 | 4.1 | 2.4 | 42.3 | 146.7 |
S10 | 6.8 | 12.9 | 6.8 | 4.4 | 7.8 | 14.2 | 8.5 | 5.0 | 0.3 | 0.2 | 66.9 | 10.5 | 4.0 | 15.6 | 13.7 | 0.7 | 0.7 | 9.4 | 3.7 | 58.3 | 125.2 |
S11 | 5.1 | 9.8 | 4.6 | 4.5 | 4.5 | 7.8 | 6.0 | 3.2 | 0.5 | 0.3 | 46.3 | 1.6 | 1.4 | 4.0 | 11.6 | 0.6 | 1.0 | 3.8 | 3.5 | 27.5 | 73.8 |
![]() |
|||||||||||||||||||||
Wood culture, mycelia | |||||||||||||||||||||
S4 | 1.2 | 2.3 | ND | ND | 0.8 | 1.0 | 1.7 | 1.2 | 1.1 | 0.6 | 9.9 | 2.2 | 3.4 | 11.5 | 19.6 | 0.5 | ND | 20.9 | 12.2 | 70.3 | 80.2 |
S5 | 1.5 | 3.2 | 0.7 | 0.4 | 1.2 | 2.2 | 2.6 | 1.8 | 0.7 | 0.3 | 14.6 | 6.5 | 3.9 | 23.5 | 23.8 | 1.1 | 0.9 | 29.0 | 13.9 | 102.6 | 117.2 |
S6 | 0.6 | 1.3 | ND | ND | 0.5 | 0.6 | 1.3 | 0.9 | 0.6 | 0.3 | 6.1 | 7.1 | 3.8 | 26.6 | 20.9 | 1.3 | 0.8 | 30.1 | 13.2 | 103.8 | 109.9 |
S12 | 3.3 | 3.9 | ND | ND | 0.6 | 1.0 | ND | ND | ND | ND | 8.8 | 5.0 | 2.9 | 10.8 | 13.2 | 0.3 | ND | 6.7 | 2.3 | 41.2 | 50.0 |
![]() |
|||||||||||||||||||||
Dish culture | |||||||||||||||||||||
S13 | 23.8 | 29.4 | 7.8 | 5.7 | 3.9 | 7.0 | 2.2 | 1.1 | 0.4 | 0.3 | 81.6 | 1.6 | 2.1 | 5.9 | 18.2 | 0.8 | 1.5 | 2.7 | 2.8 | 35.6 | 117.2 |
S14 | 23.8 | 29.7 | 9.2 | 6.5 | 3.6 | 6.6 | 1.6 | 0.8 | 0.4 | 0.3 | 82.5 | 1.6 | 2.1 | 5.9 | 16.1 | 0.9 | 1.4 | 2.7 | 2.6 | 33.3 | 115.8 |
![]() |
|||||||||||||||||||||
Solid support culture (commercial) | |||||||||||||||||||||
S9 | ND | ND | ND | ND | ND | ND | ND | ND | ND | ND | ND | ND | ND | ND | ND | ND | ND | ND | ND | ND | ND |
S15 | ND | ND | ND | ND | ND | ND | ND | ND | ND | ND | ND | ND | ND | ND | ND | ND | ND | ND | ND | ND | ND |
![]() |
|||||||||||||||||||||
Submerged fermentation (commercial) | |||||||||||||||||||||
S7 | ND | ND | ND | ND | ND | ND | ND | ND | ND | ND | ND | ND | ND | ND | ND | ND | ND | ND | ND | ND | ND |
S8 | ND | ND | ND | ND | ND | ND | ND | ND | ND | ND | ND | ND | ND | ND | ND | ND | ND | ND | ND | ND | ND |
It is generally considered that fruiting bodies of A. cinnamomea are better in quality than the mycelia. Thus, the products derived from fruiting bodies in the market are much more expensive than those from mycelia. Our results showed the triterpenoids in fruiting bodies and mycelia were remarkably different. The fruiting bodies contained a lot more ergostanes than mycelia (65.9 ± 24.4 vs. 9.9 ± 3.6 mg g−1), whereas the amounts of lanostanes were similar (52.3 ± 17.1 vs. 79.5 ± 29.9 mg g−1). The ratio of ergostanes to lanostanes was roughly 5:
4 in fruiting bodies, and 1
:
8 in mycelia, as shown in Fig. 8. We had discovered that the ergostanes had better oral bioavailability than lanostanes in our pharmacokinetic study on A. cinnamomea.26 From this point of view, it is reasonable that the fruiting bodies have higher prices than the mycelia.
The contents of single triterpenoids in the fruiting bodies or mycelia samples varied remarkably. For instance, the amount of E29 was 2.4 mg g−1 in batch S2, and 11.4 mg g−1 in S3. As a result, the triterpenoid profiles of different batches of sample showed big variations. This may be due to different culture conditions and cultivation ages.9
Dish culture is a relatively new and efficient cultivation technique for the manufacturing of A. cinnamomea. Our results showed the dish culture samples had very similar triterpenoid profiles to the fruiting bodies. Ergostanes were also more abundant than lanostanes. Particularly, the amount of antcin K (E1 and E2) was as high as >50 mg kg−1. Given the significant bioactivities of antcin K,27 dish culture samples may be a good source to purify this important compound. The chemical variation for dish culture samples was relatively small, though only two batches of samples from the same manufacturer were analyzed.
The amounts of 25R/S-epimers of 5 pairs of ergostanes (antcins A, B, C, H, and K) in A. cinnamomea were determined in pure optical form for the first time. Interestingly, the total amounts of 25S-forms were almost identical with those of 25R-forms, for all the wood culture or dish culture samples. The S/R ratio was 1.14, 1.03, and 1.02 for fruiting bodies, mycelia, and dish culture samples, respectively (Fig. 8). However, the ratio was different for each pair of epimers. The S-form was more abundant than the R-form for antcin C (S/R ratio 1.4 ± 0.3), antcin H (1.8 ± 0.3), antcin B (1.7 ± 0.2), and antcin A (1.8 ± 0.3). The situation was different for antcin K, which had an S/R ratio of 0.6 ± 0.1. These results were consistent with our semi-quantitative data by SFC analysis.13
Similar to 25R/S ergostanes, Δ7,9(11) and Δ8 lanostanes were also present in pairs. The total amounts of Δ7,9(11) lanostanes (29.8 ± 18.7 mg g−1, L1 + L3 + L5 + L9) were almost identical with those of Δ8 lanostanes (29.1 ± 10.4 mg g−1, L2 + L4 + L6 + L10). However, we could not draw a clear conclusion on the ratio for each pair of lanostanes.
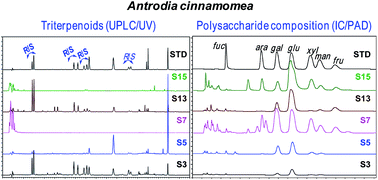
The polysaccharides in A. cinnamomea were mainly composed of 7 monosaccharides, including glucose (glu), galactose (gal), fructose (fru), fucose (fuc), mannose (man), xylose (xyl), and arabinose (ara) (Fig. 7). Other sugars like rhamnose, galacturonic acid or glucuronic acid were not detected in the hydrolyzed products. Glu and gal were the major monosaccharides. For the wood culture samples, glu and gal accounted for 87.24 ± 11.40% among the seven sugars (Fig. 8B). This result was consisted with previous reports.14,16 This ratio was lower for the other samples, which contained noticeable amounts of xyl, man, fru, and ara. Interestingly, the xyl:
man
:
fru
:
ara ratio was similar for solid culture (10
:
7
:
5
:
8) and submerged fermentation samples (10
:
8
:
10
:
8), and was remarkably different from the dish culture samples (1
:
3
:
15
:
0). This index may be useful to identify the cultivation techniques.
The contents of total polysaccharides varied from 3.2–416.7 mg g−1 among the 15 batches of samples (Table 3S†). Even for the same cultivation technique, the contents varied remarkably between the different batches. For instance, the contents in fruiting bodies ranged from 3.2–143.8 mg g−1. Although the two batches of dish culture samples contained similar amounts of triterpenoids, the polysaccharide contents varied remarkably (120.0 and 62.3 mg g−1, respectively). No triterpenoids were detected in solid culture and submerged fermentation samples. However, they generally contained high amounts of polysaccharides. For batch S7, the content of polysaccharide was as high as 416.7 mg g−1.
Footnote |
† Electronic supplementary information (ESI) available: Method validation and optimization data. See DOI: 10.1039/c5ra04327a |
This journal is © The Royal Society of Chemistry 2015 |