DOI:
10.1039/C5RA04278J
(Paper)
RSC Adv., 2015,
5, 35448-35452
Aptamer-based microcantilever array biosensor for detection of fumonisin B-1†
Received
11th March 2015
, Accepted 10th April 2015
First published on 13th April 2015
Abstract
An aptamer-based microcantilever array sensor for detection of fumonisin B-1 (FB1) was developed. The sensing cantilevers in the array were functionalized with self-assembled monolayers (SAMs) of thiolated FB1-specific aptamer, while the reference cantilevers were modified with 6-mercapto-1-hexanol SAMs to eliminate interference from the environment by detecting the deflection induced by nonspecific interactions. This differential deflection amplitude between sensing and reference cantilevers shows a linearity relation with the concentration of FB1 in the range from 0.1 to 40 μg mL−1, with a limit of detection of 33 ng mL−1 (S/N = 3). The sensor exhibits good specificity over ochratoxin A (OTA) and deoxynivalenol (DON). This biosensor provides a promising approach to detect FB1 in food and agricultural products.
1 Introduction
Mycotoxins are secondary metabolites,1 produced by molds and fungi, which always occur in grain, forage and silage.2 Most mycotoxins have toxic effects on animals, as they can be teratogenic, carcinogenic to organic systems and detrimental to reproductive functions of animals.3–5 Fumonisins are a group of most common mycotoxins in food and feedstuff. Fumonisins, mainly produced by Fusarium moniliforme Sheld, are a group of water-soluble diester compounds, composed of different types of polyhydric alcohol and tricarballylic acid. In 1988, Gelderblon first isolated fumonisins from Fusarium moniliforme Sheld culture medium.6 The fumonisin analogs are divided into four types, fumonisin A, B, C, P series.7 Among the 28 fumonisin analogs, fumonisin B (Scheme 1) are most important and naturally widespread in the contaminated maize, with fumonisin B-1 (FB1) accounting for 70%.8 FB1 can cause damage to brain, liver, lung and kidney, and especially affect horses, resulting in equine leukoencephalomalacia,9 which is related to esophageal cancer.10 International Agency for Research on Cancer (2002) has classified FB1 into group 2B.11 The levels for total fumonisin (combined FB1, FB2, FB3) should be less than 2 mg kg−1 in degermed dry-milled corn products according to the draft guidance that has been published by United States Food and Drug Administration (FDA).12 Numerous researches have been done to determine concentration of the FB1 in the food and feed.13 Cawood used thin-layer chromatography (TLC) for the preparative-scale isolation of the fumonisin B from corn cultures of Fusarium moniliforme.14 Compared to other chromatographic approaches, this method is easy to operate and low cost but limited by its poor precision. Gas chromatography tandem mass spectrometry (GC-MS)15 can be applied to determine FB1 in maize with good sensitivity and specificity by detecting tricarballylic acid. In the sample preparation, tricarballylic acid must be removed from FB1 molecule by hydrolysis and derivatizing agent is required to derivatize the amino to increase its volatility. Due to the complex sample preparation, it was displaced by other methods. High performance liquid chromatography (HPLC) is widely used to determine FB1 with low detection limit, high precision, good repeatability and high sensitivity. Martins et al.16 detected FB1 from swine feed and horse feed with a detection limit of 50 ng kg−1. However, the sample must be treated with proper derivatizing agent, for there is no UV-absorbing side group in FB1 molecule. Liquid chromatography tandem mass spectrometry (LC-MS)17 has been applied to detect FB1 with a detection limit of 0.1 μg kg−1. It also has the same disadvantage with other chromatographic approaches that require complex pretreatment procedures and trained personnel. Enzyme-linked immunosorbent assay (ELISA) has advantage in rapid detection, high specificity and sensitivity, and has been conducted to detect FB1.18 But antibody is expensive to produce and vulnerable to environmental factors. Thus, new methods of determination of FB1 are desirable in the food industry.
 |
| Scheme 1 Molecular structure of fumonisin B. | |
In the last decade, aptamers, selected in vitro through a progress referred to as systematic evolution of ligands by exponential enrichment (SELEX),19,20 have emerged as promising recognition ligands for the specific binding of mycotoxin molecules.1 As an alternative to antibodies, aptamers have gained more attention as recognition receptors with low cost, small size, high affinity, good selectivity and thermodynamic stability.21 In 2010, McKeague et al. selected a DNA aptamer that can bind with FB1 molecule specifically.22 Wu et al. presented an aptasensor based on multiplexed fluorescence resonance energy transfer.23 However, their experiments require complex sample preparation.
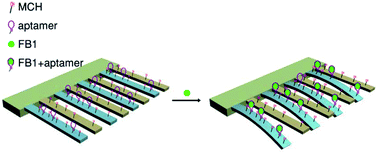
Since the advantage of microcantilever in fast response, high sensitivity, small size and their compatible integration into “lab-on-a-chip” devices,24 they have become an emerging and promising biosensors for chemicals and biooganisms.25 In our previous works, aptamer-based cantilever sensor has been used for the detection of a series of antibiotics, such as oxytetracycline,26 kanamycin,27 and vancomucin.28 Antibiotics are a type of antimicrobial used specifically against bacteria, and are often used in medical treatment of bacterial infections. Here we reported the detection of mycotoxins, FB1. Mycotoxins are secondary metabolites, produced by molds and fungi, most of them have toxic effects on animals. FB1 can cause damage to brain, liver, lung and kidney of animals. The working principle of microcantilevers is based on the translation of the biochemical reaction between target molecule and probe molecule covalently anchored to the cantilever surface into a mechanical motion. The biochemical reaction translates into deflection of cantilevers in the static mode, while the changes of resonance frequency of cantilevers in the dynamic mode. The microcantilever arrays can screen reference coatings in parallel and under identical experimental conditions29 to eliminate the influence of environmental disturbances. They are amenable for parallelization for high-throughput screening of different biomolecule interactions between target molecule and different kinds of probe molecules modified on individual cantilevers in an array. Herein, we report a new simple aptasensor based on microcantilevers to detect FB1 specifically and sensitively. This method is easy to operate and label-free. Scheme 2 illustrates the basic principle of using microcantilevers to detect FB1 in static mode. FB1 aptamers were immobilized on the sensing cantilevers (blue) to bind with FB1. Meanwhile, to eliminate the interferences from the environment, the reference ones (yellow) were functionalized with 6-mercapto-1-hexanol (MCH) self-assembled monolayers (SAMs) to detect the deflection induced by nonspecific interactions, system thermo or mechanical shifts. The specific binding of FB1 with aptamers induced differential surface stress between the functionalized gold side and silicon backside, driving cantilevers to deflect. FB1 can be detected by the microcantilever biosensor effectively and sensitively.
 |
| Scheme 2 Illustration of microcantilever modification and detection of FB1. The sensing cantilevers were modified with aptamer SAMs to bind with FB1. Meanwhile, the reference cantilevers were coated with MCH SAMs. The binding of FB1 induced the sensing cantilevers to bend downward compared to reference ones. | |
2 Experimental section
2.1 Chemicals
MCH was bought from Sigma-Aldrich (St. Louis, MO., USA). Tris (2-carboxyethyl) phosphine hydrochloride (TCEP) was purchased from Alfa Aesar(USA). FB1 was purchased from Aladdin Chemistry Co. Ltd. (Shanghai, China). Ochratoxin A (OTA) and deoxynivalenol (DON) were purchased from Pribolab Pte. Ltd. (Singapore). Ethanol was guaranteed reagent and other chemicals were of analytical reagent grade and used as received with no further purification. Deionized water (18.2 MΩ cm−1) from a Milli-Q-water purification system (Millipore) was used in all the experiments. FB1 aptamer was 5′-SH-(CH)6-ATA CCA GCT TAT TCA ATT AAT CGC ATT ACC TTA TAC CAG CTT ATT CAA TTA CGT CTG CAC ATA CCA GCT TAT TCA ATT AGA TAG TAA GTG CAA TCT-3′,22 synthesized by Sangon Biotech Co., Ltd. (Shanghai, China). Aptamers were dissolved in immobilization buffer (10 mmol L−1 Tris–HCl, 100 mmol L−1 NaCl, 100 μmol L−1 TCEP, pH 7.4) and stored at −20 °C. Binding buffer contained 10 mmol L−1 Tris–HCl, 100 mmol L−1 NaCl at pH 7.4.
2.2 Functionalization of microcantilever array
Arrays of eight identical silicon cantilever beams (500 μm long, 90 μm wide, and 1 μm thick) with a 20 nm gold layer coated on the top side were bought from Micromotive GmbH (Mainz, German). The array was cleaned using piranha solution (98% H2SO4
:
30% H2O2, 7
:
3) (Caution: piranha solution is a very strong oxidant and reacts violently with many organic materials, it must be handled with extreme care) for 30 seconds and then rinsed three times with deionized water. After being cleaned in a UV-ozone cleaner for 30 minutes, cantilevers were rinsed three times with ethanol and deionized water respectively, and then dried by infrared light. Microcantilevers were functionalized with aptamers after these cleaning procedures as above. As shown in Fig. S1,† four of the cantilevers on the array were modified by immersing in 25 μL 1 μmol L−1 DNA solution in a group of capillaries for 3 hours. And then the whole cantilevers were immersed in 2 mmol L−1 MCH ethanol solution for 1 hour to prevent non-specific adsorptions on the sensing cantilevers and to block the active sites on the reference ones.
2.3 Measurement of deflection curves
The deflection measurements were conducted on the commercial Cantisens sensor platform (Concentris GmbH, Switzerland). The microcantilever array was mounted in an array holder which was inserted into the measurement cell filled with binding buffer. As shown in Fig. S2,† a constant flow vertical to the cantilevers at a small rate of 0.42 μL s−1 was maintained during the experiment to keep the enough time for the interaction for aptamers and FB1. The temperature in the experiment was constantly controlled in an automatic calibration system. The arrays were equilibrated in binding buffer in the measurement cell at 25.00 °C until a stable differential signal (deflection of sensing cantilevers minus deflection of reference ones) was obtained. To measure the deflection of every cantilever in situ, a laser beam (8 semiconductor class 1 M laser sources, max. 1.21 mW each, 850 nm) reflected off the tip of each cantilever (Fig. S2†), and the differential signal can be extracted simultaneously. As the differential signal was stable, 250 μL of FB1 sample was injected into the measurement cell at the desired time, and the measurement curves of deflection induced by reaction between FB1 and aptamers can be achieved. The cantilevers bending toward the gold side or bending toward silicon side is defined as bending up (positive) or bending down (negative), respectively.
3 Results and discussion
3.1 Deflection of microcantilever induced by FB1
The cantilever array functionalized with aptamer SAMs on the gold side was applied to investigate the interaction between FB1 and aptamers. Fig. 1A shows the average deflection of cantilevers as injecting FB1 sample at the concentration of 100 ng mL−1 and the corresponding differential signal is shown in Fig. 1B. After recording a baseline for 200 seconds, FB1 reacted with aptamers (the light violet region). The binding of FB1 induced all the sensing cantilevers to bend downward. The signals induced by non-specific adsorption, thermo or mechanical shifts, can be eliminated by extracting the differential signal from sensing cantilevers and reference ones. Consequently, the differential signal is only related to the combination of FB1 and aptamers.
 |
| Fig. 1 Deflections of aptamers functionalized microcantilever in a flowing cell with injection of FB1 (100 ng mL−1). (A) Average deflection of sensing cantilevers (blue) and average deflection of reference cantilevers (black). (B) Differential deflection of cantilevers. The light violet region shows the period of FB1 sample flowing through the cell. | |
The specific binding of FB1 and aptamers via surface stress changes was transduced to nanomechanical response of microcantilevers. As shown in Scheme 2, FB1 bound to the loop region of aptamers, resulting in sterically crowded, which induced steric repulsive force between the adjacent aptamers. Besides, electrostatic repulsive force between the neighboring FB1-aptamer complexes was another primary cause of the bending of cantilevers, as FB1 is negatively charged.30 The two major elements both induced compress stress of the cantilevers, which impelled them to bend downward. As an additional evidence, the morphological change of aptamer SAMs on glod resulted from the binding of FB1 has been discerned by atomic force microscope (AFM) images as shown in Fig. S3.†
3.2 Relationship between deflection amplitudes and concentrations of FB1
As shown in Fig. 2A, the differential deflection increases as a result of increasing the concentration of FB1 in the range of 0.1 μg mL−1 to 40 μg mL−1. To assess the reproducibility of the experiment measurement, at least three experiments were repeated for each concentration. Fig. 2B shows the calibration curve of average differential deflection of cantilevers versus FB1 concentration. There is a linearity in the concentration range of FB1 from 0.1 μg mL−1 to 40 μg mL−1. While a steady state was reached when the concentration of FB1 exceeded 40 μg mL−1. The linear equation is Y = 27.15 + 4.65X (R = 0.9905), with limit of detection of 33 ng mL−1 (S/N = 3), where Y is the differential deflection (nm), and X is the concentration of FB1 (μg mL−1).
 |
| Fig. 2 (A) Differential deflection curves of cantilevers as a function of time with injection of different concentration of FB1. The light violet region shows the period of FB1 sample flowing through the cell. (B) Calibration curve of cantilever sensor for FB1. The error bars represent the standard deviation of data. Inset illustrates the linear response of differential deflection versus FB1 concentration. (C) The specificity test of the assay for FB1 on the aptamer modified cantilevers. The light violet region shows the period of OTA sample or DON sample flowing through the cell. | |
3.3 Specificity evaluation of microcantilever array sensor
Control experiments were performed to verify specificity of the biosensor. Cantilevers functionalized with FB1 aptamers was exposed to ochratoxin (OTA) and deoxynivalenol (DON), other structurally similar mycotoxins found in foods, at the same concentration with FB1 of 40 μg mL−1, respectively. As shown in Fig. 2C, FB1 aptamers does not selectively bind with OTA and DON, which indicates that microcantilever array biosensor can detect FB1 with high selectivity and specificity.
4 Conclusion
In summary, a simple and label-free FB1 aptasensor based on microcantilever array sensor has been developed by functionalized aptamers on the gold side via forming Au–S bonds. The developed aptasensor exhibits high selectivity and stability for detecting FB1 with a linear working range of 0.1 μg mL−1 to 40 μg mL−1 and a limit detection of 33 ng mL−1 (S/N = 3). The promising microcantilever array sensor based on aptamers would have great potential applications in food analysis.
Acknowledgements
This work was supported by the National Natural Science Foundation of China (no. 21375122).
Notes and references
- J. C. Vidal, L. Bonel, A. Ezquerra, S. Hernandez, J. R. Bertolin, C. Cubel and J. R. Castillo, Biosens. Bioelectron., 2013, 49, 146–158 CrossRef CAS PubMed.
- G. S. Shephard, E. Berthiller, P. A. Burdaspal, C. Crews, M. A. Jonker, R. Krska, S. MacDonald, R. J. Malone, C. Maragos, M. Sabino, M. Solfrizzo, H. P. Van Egmond and T. B. Whitaker, World Mycotoxin J., 2012, 5, 3–30 CrossRef CAS.
- E. E. Creppy, Toxicol. Lett., 2002, 127, 19–28 CrossRef CAS.
- X. Li, P. Li, Q. Zhang, R. Li, W. Zhang, Z. Zhang, X. Ding and X. Tang, Biosens. Bioelectron., 2013, 49, 426–432 CrossRef CAS PubMed.
- A. C. Mak, S. J. Osterfeld, H. Yu, S. X. Wang, R. W. Davis, O. A. Jejelowo and N. Pourmand, Biosens. Bioelectron., 2010, 25, 1635–1639 CrossRef CAS PubMed.
- S. C. Bezuidenhout, W. C. A. Gelderblom, C. P. Gorstallman, R. M. Horak, W. F. O. Marasas, G. Spiteller and R. Vleggaar, Chem. Commun., 1988, 743–745 RSC.
- J. P. Rheeder, W. F. O. Marasas and H. F. Vismer, Appl. Environ. Microbiol., 2002, 68, 2101–2105 CrossRef CAS.
- R. Krska, E. Welzig and H. Boudra, Anim. Feed Sci. Technol., 2007, 137, 241–264 CrossRef CAS PubMed.
- J. L. Richard, Int. J. Food Microbiol., 2007, 119, 3–10 CrossRef CAS PubMed.
- J. P. Rheeder, W. F. O. Marasas, P. G. Thiel, E. W. Sydenham, G. S. Shephard and D. J. Vanschalkwyk, Phytopathology, 1992, 82, 353–357 CrossRef.
- International Agency for Research on Cancer (IARC), Fumonisin B1. In IARC Monographs on the EValuation of Carcinogenic Risks to Humans, Some Traditional Herbal Medicines, Some Mycotoxins, Naphthalene and Styrene, IARC: Lyon, France, 2002, vol. 82, pp. 301–366 Search PubMed.
- G. S. Shephard, N. L. Leggott, S. Stockenstrom, N. I. M. Somdyala and W. F. O. Marasas, S. Afr. J. Sci., 2002, 98, 393–396 CAS.
- R. D. Plattner, W. P. Norred, C. W. Bacon, K. A. Voss, R. Peterson, D. D. Shackelford and D. Weisleder, Mycologia, 1990, 82, 698–702 CrossRef CAS.
- M. E. Cawood, W. C. A. Gelderblom, R. Vleggaar, Y. Behrend, P. G. Thiel and W. F. O. Marasas, J. Agric. Food Chem., 1991, 39, 1958–1962 CrossRef CAS.
- R. D. Plattner, P. F. Ross, J. Reagor, J. Stedelin and L. G. Rice, J. Vet. Diagn. Invest., 1991, 3, 357–358 CrossRef CAS PubMed.
- H. M. L. Martins, I. F. M. Almeida, C. R. L. Camacho, S. M. O. Santos, J. M. G. Costa and F. M. A. Bernardo, Rev Iberoam Micol., 2012, 29, 175–177 CrossRef PubMed.
- T. Gazzotti, B. Lugoboni, E. Zironi, A. Barbarossa, A. Serraino and G. Pagliuca, Food Control, 2009, 20, 1171–1174 CrossRef CAS PubMed.
- Y.-K. Wang, Y.-C. Wang, H.-a. Wang, W.-H. Ji, J.-H. Sun and Y.-X. Yan, Food Control, 2014, 40, 41–45 CrossRef CAS PubMed.
- A. D. Ellington and J. W. Szostak, Nature, 1990, 346, 818–822 CrossRef CAS PubMed.
- C. Tuerk and L. Gold, Science, 1990, 249, 505–510 CAS.
- S. Gong, H. L. Ren, R. Y. Tian, C. Lin, P. Hu, Y. S. Li, Z. S. Liu, J. Song, F. Tang, Y. Zhou, Z. H. Li, Y. Y. Zhang and S. Y. Lu, Biosens. Bioelectron., 2013, 49, 547–554 CrossRef CAS PubMed.
- M. McKeague, C. R. Bradley, A. De Girolamo, A. Visconti, J. D. Miller and M. C. DeRosa, Int. J. Mol. Sci., 2010, 11, 4864–4881 CrossRef CAS PubMed.
- S. Wu, N. Duan, X. Ma, Y. Xia, H. Wang, Z. Wang and Q. Zhang, Anal. Chem., 2012, 84, 6263–6270 CrossRef CAS PubMed.
- M. Alvarez and L. M. Lechuga, Analyst, 2010, 135, 827–836 RSC.
- K. R. Buchapudi, X. Huang, X. Yang, H. F. Ji and T. Thundat, Analyst, 2011, 136, 1539–1556 RSC.
- H. Hou, X. Bai, C. Xing, N. Gu, B. Zhang and J. Tang, Anal. Chem., 2013, 85, 2010–2014 CrossRef CAS PubMed.
- X. Bai, H. Hou, B. Zhang and J. Tang, Biosens. Bioelectron., 2014, 56, 112–116 CrossRef CAS PubMed.
- X. Bai, B. Lu, X. Chen, B. Zhang and J. Tang, Biosens. Bioelectron., 2014, 64, 145–150 CrossRef PubMed.
- R. Raiteri, M. Grattarola and R. Berger, Mater. Today, 2002, 5, 22–29 CrossRef CAS.
- C. M. Maragos, G. A. Bennett and J. L. Richard, Analysis of fumonisin B-1 in corn by capillary electrophoresis, in Fumonisins in Food, ed.L. S. Jackson; J. W. DeVries and L. B. Bullerman, Plenum Press Div Plenum Publishing Corp, New York, 1996, vol. 392, pp. 105–112 Search PubMed.
Footnote |
† Electronic supplementary information (ESI) available. See DOI: 10.1039/c5ra04278j |
|
This journal is © The Royal Society of Chemistry 2015 |
Click here to see how this site uses Cookies. View our privacy policy here.