DOI:
10.1039/C5RA04041H
(Paper)
RSC Adv., 2015,
5, 38345-38353
Molecular dynamics investigation on the deliquescence of NH4Cl and NH4NO3 nanoparticles under atmospheric conditions
Received
6th March 2015
, Accepted 20th April 2015
First published on 21st April 2015
Abstract
In this study, the deliquescence of NH4Cl and NH4NO3 nanoparticles under atmospheric conditions was modeled by molecular dynamics simulation in order to investigate the effects of nanoparticle size and temperature. The physical significance of the method of this work is its lower computational cost of the calculations in comparison with the previous studies, without any considerable effect on the accuracy of the results. The results showed that an increase of the nanoparticle size decreases deliquescence relative humidity in such a way that this decrease can be fitted to an exponential decay for both NH4Cl and NH4NO3 nanoparticles. Also, increase of temperature decreases deliquescence relative humidity which can be described by the wettability of the nanoparticle. Moreover, NH4NO3 nanoparticles were found to have more ability to deliquescence in atmospheric conditions than NH4Cl ones and hence maybe could be considered more by environmental scientists for their possible influences on the ecosystem of the earth and future attempts to reduce their concentration in the atmosphere.
Introduction
Inorganic aerosols play an important role in atmospheric pollution and universal climate change which makes them key materials for environmental studies.1–3 These aerosols are categorized into two groups: primary aerosols and secondary ones. Primary aerosols are directly released by industrial and urban regions. However, secondary aerosols are mainly formed by reaction between ammonia [NH3], sulfuric acid [H2SO4], nitric acid [HNO3] and hydrogen chloride [HCl] in the atmosphere which leads to the formation of ammonium sulfate [(NH4)2SO4], ammonium nitrate [NH4NO3], and ammonium chloride [NH4Cl].4,5 Ammonia usually is released into air by combustion, fertilizers, and biological decay, [H2SO4] and [HNO3] are formed by chemical and photochemical reactions of water with [SO2] and [NOx] which are mainly produced by combustion of fossil fuels.4,6–8 Also, [HCl] is produced during rapid acidification of fresh deliquesced NaCl primary aerosol by [HNO3] and [H2SO4].9,10 Therefore [(NH4)2SO4], [NH4NO3], and [NH4Cl] are dominant secondary aerosols in atmosphere.4
The role of mentioned aerosols on the greenhouse effect and climate changes are directly related to their interaction with water and humidity of atmosphere. The interaction of water with these aerosols is usually described by deliquescence.6 By definition, deliquescence is a first order phase transition of a solid to solution at relative humidity.11 The hygroscopic growth of these aerosols has important influence on climate changes, which can lead to creation of haze and clouds and affects the radiation transfer to the surface of earth. Therefore, nanoscaled sizes of these aerosols play an important role in atmospheric chemistry by formation of solid–vapor and solid–liquid interfaces which act as appropriate substrates for chemical and photochemical reactions at the surface or liquid phase of the aerosols.12 However, experimental studies of the size and temperature effects on deliquescence of the aerosols are faced with many difficulties, because most of these studies are limited to equilibrium conditions, for example production of particle sizes smaller than 10 nm is not an easy way. Hence, the need for theoretical simulations is more dominant at these circumstances.13
Molecular dynamics (MD) simulation is a powerful technique in order to simulate nanoscaled particles due to the fact that when the number of atoms and electrons of the system is more than convenient small molecules and molecular associations, quantum-mechanical methods are not applicable due to their high computational cost. However, MD simulations with appropriate force fields can give very good results for thermodynamic properties of these large systems. Therefore several MD simulations have been performed to study deliquescence of atmospheric aerosols.12–22 Bahadur and Russell studied effects of nanoparticle size and surface tension on deliquescence of NaCl nanoparticles by MD simulation. Their calculations indicated that surface tension of nanoparticles decreases by their size and using size-dependent surface tension yields deliquescence relative humidity (DRH) values in good agreement with experimental data.12 In another work, Bahadur and Russell calculated planar water uptake coefficients and deliquescence of NaCl nanoparticles at atmospheric relative humidities (RHs) by MD simulation.13 RH is defined as: { } where PH2O is the vapor pressure of water and
  is its saturated vapor pressure. They defined planar water uptake coefficient γ as (γ = 4Jm/ng
![[c with combining macron]](https://www.rsc.org/images/entities/i_char_0063_0304.gif) ) where Jm is the measured flux to the surface, ng is the molar density of vapor phase, and
) where Jm is the measured flux to the surface, ng is the molar density of vapor phase, and ![[c with combining macron]](https://www.rsc.org/images/entities/i_char_0063_0304.gif) is the average thermal velocity of vapor molecules.13 Their calculations showed that DRH is increasing with decreasing particle size. Also, planar water uptake coefficients exhibit a linear decrease with increasing of logarithm of fractional water coverage. Moreover, the particle uptake coefficients obey a linear relation with the logarithm of edge fraction. Due to the fact that edge fraction is a function of size, Bahadur and Russell concluded that edge effects are larger for smaller nanoparticles.13 However, they emphasized that simulation of complete deliquescence of the nanoparticles with sizes 2–11 nm requires MD simulation time between 1 to 100 μs which is not possible for convenient computational resources.13 Holmberg et al. studied dissolution of NaCl nanocrystals using ab initio molecular dynamics (AIMD) method and observed different dissolution rates for Na+ and Cl− ions. They found that this difference is due to the faster water-mediated elongations of ionic bonds to Na+ ion in comparison with Cl− one.23 All of the mentioned studies emphasized the size-dependent nature of deliquescence for nanoparticles with diameters smaller than 100 nm. However, despite of the mentioned simulations, there are not similar studies for deliquescence of NH4Cl and NH4NO3 nanoparticles. Therefore many parameters can affect on deliquescence of these nanoparticles under atmospheric conditions, such as effects of nanoparticle size, temperature, crystal structure, intermolecular interactions, and physical and chemical properties of atmospheric environment. As mentioned above, complete simulation of deliquescence of these nanoparticles requires very high computational equipment which is not available for most of the academic institutions. Therefore, application of an appropriate approximation for this type of MD simulation is very important. In this work, we studied deliquescence of NH4Cl and NH4NO3 nanoparticles by MD simulation in order to study the effects of temperature and nanoparticle size in the presence of air and water. Then, effects of nanoparticle size and temperature on the DRH values of these nanoparticles will be discussed.
is the average thermal velocity of vapor molecules.13 Their calculations showed that DRH is increasing with decreasing particle size. Also, planar water uptake coefficients exhibit a linear decrease with increasing of logarithm of fractional water coverage. Moreover, the particle uptake coefficients obey a linear relation with the logarithm of edge fraction. Due to the fact that edge fraction is a function of size, Bahadur and Russell concluded that edge effects are larger for smaller nanoparticles.13 However, they emphasized that simulation of complete deliquescence of the nanoparticles with sizes 2–11 nm requires MD simulation time between 1 to 100 μs which is not possible for convenient computational resources.13 Holmberg et al. studied dissolution of NaCl nanocrystals using ab initio molecular dynamics (AIMD) method and observed different dissolution rates for Na+ and Cl− ions. They found that this difference is due to the faster water-mediated elongations of ionic bonds to Na+ ion in comparison with Cl− one.23 All of the mentioned studies emphasized the size-dependent nature of deliquescence for nanoparticles with diameters smaller than 100 nm. However, despite of the mentioned simulations, there are not similar studies for deliquescence of NH4Cl and NH4NO3 nanoparticles. Therefore many parameters can affect on deliquescence of these nanoparticles under atmospheric conditions, such as effects of nanoparticle size, temperature, crystal structure, intermolecular interactions, and physical and chemical properties of atmospheric environment. As mentioned above, complete simulation of deliquescence of these nanoparticles requires very high computational equipment which is not available for most of the academic institutions. Therefore, application of an appropriate approximation for this type of MD simulation is very important. In this work, we studied deliquescence of NH4Cl and NH4NO3 nanoparticles by MD simulation in order to study the effects of temperature and nanoparticle size in the presence of air and water. Then, effects of nanoparticle size and temperature on the DRH values of these nanoparticles will be discussed.
Calculation method
The main aim of the present study was to investigate the deliquescence of NH4Cl and NH4NO3 nanoparticles with different diameters via molecular dynamics simulations at different temperatures. The MD simulations were carried out in canonical ensemble (NVT) using Berendsen24 thermostat with a relaxation time of 0.1 ps. The selection of Berendsen thermostat is due to its simplicity and effectiveness in equilibration of large systems25 and can give reliable results for them.26–28 The equations of motion were integrated using the Verlet leapfrog algorithm with a time step of 1 fs. The analysis of simulated trajectories and calculation of different properties were performed using the utilities of DL_POLY 4.03 (ref. 29 and 30) program.
The simulation of deliquescence for each size of NH4NO3 and NH4Cl nanoclusters was performed in four steps which are described as follows:
(1) Water and air (N2/O2) molecules are located randomly in cubic cell with periodic boundary conditions in x, y and z directions. The number of water and air molecules included in the simulation cell is determined from measured bulk density of the appropriate phase at 1 atm. Then, NVT simulation is applied for the mentioned box containing water, N2, and O2 molecules for a time period of 2 ns in order to reach an equilibrium configuration for this mixture.
(2) Nanoparticle is placed in the center of the mentioned simulation box. After performing NVT simulation of this system for 1 ns, the number of adsorbed water molecules around the nanoparticle is calculated. In order to calculate the number of water adsorbates, a sphere with diameter equal to 1.5 times of the nanoparticle edge length is considered around the nanoparticle, in which its center is corresponding to the center of the mentioned nanoparticle. Thus, the volume contained inside this sphere is defined as the immediate vicinity of the nanoparticle.13 Any water molecule located within this volume is considered to be adsorbed.
(3) Since some of the water molecules have been adsorbed by the nanoparticle, RH has been decreased in the box. Therefore, the nanoparticle and the adsorbed water molecules around it are placed in the center of another initially equilibrated water/air mixture. Then, NVT simulation is repeated again for 1 ns. Now, the number of water adsorbates on the nanocluster is calculated. If the new number of adsorbates is the same as previous step, simulation has been finished, else step (3) should be repeated until the number of adsorbed water molecules on the nanocluster reaches to a constant value. At these circumstances, the chemical potential of water molecules on the nanocluster and its surrounding atmosphere are equal.31,32
The results obtained by this method can be considered as equivalent with those obtained with the commonly employed Grand Canonical Monte Carlo.27,28 Because in this method the main idea is to bring the material in equilibrium with a gas reservoir in such a way that the chemical potential of gas adsorbates on the nanoparticle becomes equal to that of the bulk gas.31,32 The advantage of this Grand Canonical-like method is its lower computational cost in comparison with the method of Bahadur et al.13 Because, using the method of this work, there is no need for inclusion of a liquid water reservoir at the bottom of simulation box in order to control RH of the atmosphere inside it, as used in the work of Bahadur et al.13 Another advantage of this work is that there is no need to fix the atomic coordinates of the nanocluster during the adsorption of water molecules on it. Therefore, the effect of water adsorbates on the structure of the nanoclusters can be included in the results. However, in the method of Bahadur et al. one should fix or limit the atomic coordinates of the nanocluster in order to prevent falling of nanocluster into the liquid reservoir at the bottom of simulation box. This fixing of atomic coordinates can lead to some errors in the results, because water adsorption can lead to some structural changes on the surface of the nanocluster and affect on the total number of water adsorbates on it.
In order to study the effect of nanoparticle size on its deliquescence, NH4Cl nanoparticles with diameters equal to 1.560, 3.138, 4.760, 6.340, and 9.05 nm and NH4NO3 nanoparticles with diameters of 1.71, 3.25, 4.83, 6.41, and 9.11 nm were selected and temperature of the system was fixed at 300 K. The numbers of molecules for each size of NH4Cl and NH4NO3 nanoparticles are given in Table 1a and 1b, respectively. The NH4Cl crystal has a CsCl-like cubic structure with 3.875 Å lattice constant in which NH4+ ions are in the center of the cube and Cl− ions at its corners. Also, the N–H bond length was held fixed in its bulk value (1.03 Å).33 The NH4NO3 nanocluster was constructed from its stable bulk structure at room temperature (phase IV). The phase (IV) of NH4NO3 has orthorhombic lattice with Pmmn space group and lattice parameters of 5.745, 5.438, and 4.942 Å respectively for a, b, and c.34 For each nanocluster, first its initial structure was obtained by replication of its unit cell in three directions. Then this initial structure was stabilized by annealing.35 After annealing by MD simulation, the structure of all of the mentioned nanoclusters became spherical-like which are suitable for study of deliquescence process as described in steps (1) to (3) above.
Table 1 The numbers of molecules for different sizes of NH4Cl (a) and NH4NO3 (b) nanoparticles simulated in this work
| a |
| Size (nm) |
1.560 |
3.138 |
4.76 |
6.34 |
9.05 |
| N |
27 |
216 |
729 |
1728 |
4913 |
| b |
| Size (nm) |
1.71 |
3.25 |
4.83 |
6.41 |
9.11 |
| N |
24 |
192 |
648 |
1536 |
4032 |
The size of the simulation box for all of the simulations was 100 × 100 × 100 nm and the numbers of N2 and O2 molecules are 19![[thin space (1/6-em)]](https://www.rsc.org/images/entities/char_2009.gif) 570 and 4893, respectively at 300 K. The number of water molecules included in the initial simulation box for different RH values at 300 K is given in Table 2. Also, in order to investigate temperature effect on deliquescence of mentioned nanoparticles, simulations were performed at 280, 285, 290, 295, 300, and 305 K for 4.76 and 4.83 nm diameters of NH4Cl and NH4NO3 nanoparticles, respectively. The ion–ion interactions are modeled using universal force field (UFF)36 OPLS,37 and Sorescu–Thompson38 force fields. Water molecules are described using the TIP4P potential.39 The parameters of TIP4P potential for water molecule are presented in Table 3. Also, the van der Waals interactions for NH4Cl37,40 and NH4NO3 (ref. 38 and 41) molecules were modeled by Lennard-Jones (LJ) 12-6 potential and the related parameters are given in Table 4a and 4b, respectively. Moreover, the LJ parameters between dissimilar pairs were obtained by Lorentz–Berthelot combining rule. The interactions between N2–N2, O2–O2 were also modeled by LJ 12-6 potential42,43 and their related LJ parameters are given in Table 5. The columbic long range interactions were calculated using Ewald method with a precision of 10−6 for automatic optimization of Ewald summation parameters. All interatomic interactions between the atoms in the simulation box have calculated within the cutoff distance 12 Å. Also, a snapshot for a portion of simulation box containing NH4Cl nanoparticle with 3.138 nm size at 300 K and 83% RH is represented in Fig. 1.
570 and 4893, respectively at 300 K. The number of water molecules included in the initial simulation box for different RH values at 300 K is given in Table 2. Also, in order to investigate temperature effect on deliquescence of mentioned nanoparticles, simulations were performed at 280, 285, 290, 295, 300, and 305 K for 4.76 and 4.83 nm diameters of NH4Cl and NH4NO3 nanoparticles, respectively. The ion–ion interactions are modeled using universal force field (UFF)36 OPLS,37 and Sorescu–Thompson38 force fields. Water molecules are described using the TIP4P potential.39 The parameters of TIP4P potential for water molecule are presented in Table 3. Also, the van der Waals interactions for NH4Cl37,40 and NH4NO3 (ref. 38 and 41) molecules were modeled by Lennard-Jones (LJ) 12-6 potential and the related parameters are given in Table 4a and 4b, respectively. Moreover, the LJ parameters between dissimilar pairs were obtained by Lorentz–Berthelot combining rule. The interactions between N2–N2, O2–O2 were also modeled by LJ 12-6 potential42,43 and their related LJ parameters are given in Table 5. The columbic long range interactions were calculated using Ewald method with a precision of 10−6 for automatic optimization of Ewald summation parameters. All interatomic interactions between the atoms in the simulation box have calculated within the cutoff distance 12 Å. Also, a snapshot for a portion of simulation box containing NH4Cl nanoparticle with 3.138 nm size at 300 K and 83% RH is represented in Fig. 1.
Table 2 The number of water molecules (NH2O) included in the initial simulation box for different RH values at 300 K
| RH |
100 |
95 |
90 |
85 |
80 |
75 |
70 |
| NH2O |
885 |
841 |
799 |
759 |
721 |
685 |
651 |
Table 3 TIP4P potential parameters for water molecule, please note that M is a dummy atom in this force filed.39
| Atom |
Charge (q/e) |
ε (kJ mol−1) |
σ (Å) |
| O |
0.00 |
0.648 |
3.1536 |
| H |
0.52 |
0.000 |
0.0000 |
| M |
−1.04 |
0.000 |
0.0000 |
Table 4 LJ parameters for NH4Cl37,40 (a) and NH4NO3 (ref. 38 and 41) (b) molecules used in this work
| a |
| Atom |
Charge (q/e) |
ε (kJ mol−1) |
σ (Å) |
| N |
−0.40 |
0.7116 |
3.25 |
| H |
0.35 |
0.0000 |
0.00 |
| Cl |
−1.00 |
0.4939 |
4.41 |
| b |
| Atom |
Charge (q/e) |
ε (kJ mol−1) |
σ (Å) |
| N (NH4+) |
−0.774701 |
0.2988 |
3.2874 |
| H |
0.443675 |
1.7756 |
1.6125 |
| N (NO3−) |
0.896259 |
0.2988 |
3.2874 |
| O |
−0.632086 |
0.95193 |
2.9934 |
Table 5 LJ parameters for N2 (ref. 42) and O2 (ref. 43) gases used in this work
| Molecule |
ε (kJ mol−1) |
σ (Å) |
| N2 |
0.2990 |
3.3100 |
| O2 |
0.3590 |
3.1062 |
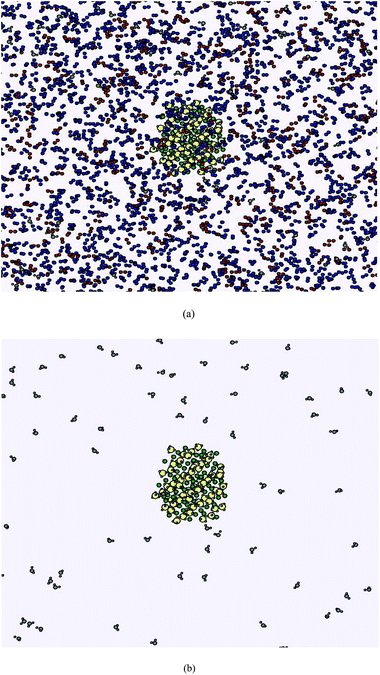 |
| | Fig. 1 A portion of simulation box containing NH4Cl nanoparticle with 3.138 nm size at 300 K and 83% RH with air molecules (a) and without air molecules (b). The blue, red, gray, white, green, and yellow colors are representing N (N2), O (O2), O (H2O), H, Cl, and N (NH4+) atoms. | |
Finally, it is noticeable that the mentioned method process is not a direct simulation of deliquescence, due to the fact that real simulation of deliquescence needs very large simulation times such as 1 to 100 μs for which the nanoparticle is completely dissolved in the liquid phase.13 It is obvious that such large simulation times are not available for common computational instruments.13 Therefore, the presented method is a molecular level modeling of deliquescence and step (3) at RH values equal or larger than DRH, is not an equilibrium process, because the number of water adsorbates is increased continuously by the simulation time. Hence, the minimum RH value for which the mentioned hygroscopic growth of a nanoparticle occurs, is considered as its DRH value.13
Results and discussion
(a) Effect of sizes of NH4Cl and NH4NO3 nanocluters
In this work the range of RH values is different for each nanocluster, however, the total range of them was selected from 60% to 100%. The number of adsorbed water molecules at 300 K on the NH4Cl nanocrystals with diameters of 1.56 and 9.05 nm versus simulation time at different relative RH values are presented in Fig. 2(a) and (b), respectively. As shown in these figures two regimes are visible in the plots for the number of water adsorbates on the nanoparticle versus simulation time: (1) RH < DRH regime, which is an equilibrium state and any increase of simulation time, does not lead to a considerable change in the system. (2) RH ≥ DRH regime in which the hygroscopic growth of the particle occurs. At these circumstances, there is not an equilibrium state and size of the nanoparticle is increased continuously by simulation time. Therefore, at RHs higher than 94% for 1.56 nm and 84% for 9.05 nm sizes of NH4Cl nanocrystals, deliquescence is taken place. This means that DRH at 300 K for sizes of 1.56 and 9.05 nm is 94% and 84% respectively. Similar to Fig. 2(a) and (b), number of adsorbed water molecules at 300 K on the NH4NO3 nanocrystals with diameters of 1.71 and 9.11 nm versus simulation time at different RHs are presented in Fig. 3(a) and (b), respectively. As it is shown in Fig. 3(a) and (b), the DRH values for 1.71 and 9.11 nm sizes of NH4NO3 nanoparticles are 87% and 73%, respectively. By comparison of these results with those of the NH4Cl nanoparticles, it can be concluded that the DRH values of NH4Cl nanoparticles are higher than NH4NO3 ones with similar diameters. This result is in good agreement with experimental data in which DRH values for large sizes of NH4Cl and NH4NO3 particles are reported 78% and 61.8%, respectively.4 This difference between DRH values for similar sizes of NH4Cl and NH4NO3 nanoparticles can be related to many physical and chemical properties of them and further theoretical and experimental studies may be performed in order to more concise description of this phenomenon. Also, the similar behavior was observed for other sizes of NH4Cl and NH4NO3 nanoparticles studied in this work.
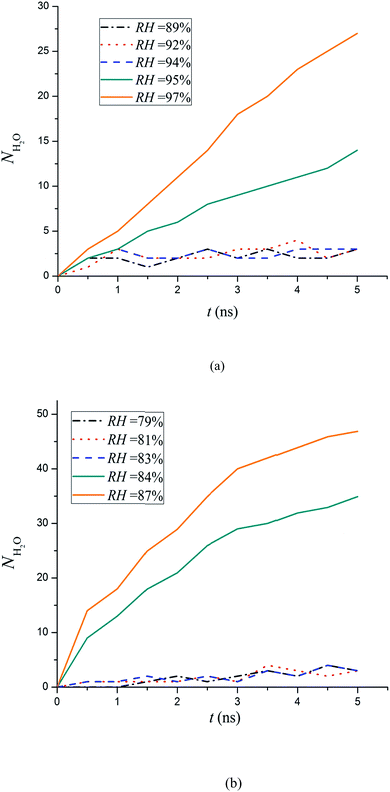 |
| | Fig. 2 The number of adsorbed water molecules at 300 K on the NH4Cl nanocrystals with diameters of 1.56 nm (a) and 9.05 nm (b) versus simulation times at different relative humidities. | |
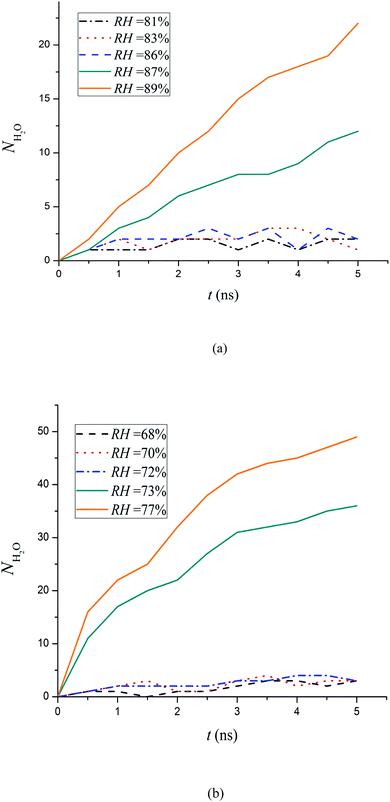 |
| | Fig. 3 The number of adsorbed water molecules at 300 K on the NH4NO3 nanocrystals with diameters of 1.71 nm (a) and 9.11 nm (b) versus simulation times at different relative humidities. | |
The DRH values as a function of nanoparticle diameter for NH4Cl and NH4NO3 nanoparticles at 300 K are presented in Fig. 4 and 5, respectively. As it is obvious from these figures, DRH is decreased by increase of diameter of the nanocrystals. This result is in agreement with experimental results of Biskos et al. for NaCl nanoparticles.44 Biskos et al. related this size dependency of deliquescence to the less surface free energy and surface area of smaller particles. They explained that deliquescence occurs when free energy of dry particle (Gc) equals to that of the aqueous one (Gaq):
| | |
Gc − Gaq = (μc − μaq)Nsalt + (γcAc − γaqAaq) = 0
| (1) |
where
Nsalt is the number of salt molecules,
μc and
μaq are chemical potentials of crystalline (dry) and aqueous nanoparticle, respectively. Also,
γc and
γaq are surface tensions of dry particle–vapor and its aqueous state (liquid)–vapor, respectively, and
Ac and
Aaq are their corresponding surface areas. Please note that
Ac and
Aaq can be expressed by:
44| |
 | (2) |
where
dp is the diameter of dry particle and GF is the hygroscopic growth factor of diameter. If [
γc/
γaq > GF
2] DRH decreases by increase of nanoparticle size. Because, at these conditions [
γcAc >
γaqAaq] and due to the equilibrium circumstances, [
μc =
μaq], then [
Gc >
Gaq], and deliquescence needs [
Gc =
Gaq]. In order to occurrence of this balance, DRH should be decreased by increase of nanoparticle size which means that less adsorbed water molecules on nanoparticle surface and more similarity of its surface area and surface tension to those of the dry state. On the basis of
Fig. 2 and
3, it seems that both of NH
4Cl and NH
4NO
3 nanoparticles with sizes between 1 to 10 nm (simulated in this work) obey [
γc/
γaq > GF
2] regime. Biskos
et al. fitted their experimental data with [DRH = 213
dm−1.6 + 76] equation for NaCl nanoparticles in which
dm is diameter of dry nanoparticle.
45 However, the simulation results of this work for NH
4Cl and NH
4NO
3 nanoparticles do not exhibit a good fitting to an equation like that of the Biskos
et al. Instead, we tried to fit the simulation results by another equation. Finally, the results showed good fitting with the following equation by a good
R2 value:
| |
 | (3) |
where
dm is diameter of dry nanoparticle and (
a,
b,
c) are adjustable parameters. The fitted parameters for DRH values of NH
4Cl and NH
4NO
3 nanoparticles
versus their diameter (
dm) are given in
Table 6. When
dm tends to infinity for large particles,
c can be equal to DRH of macroscopic particles which their experimental data are available. As it is obvious in
Table 6, the
c values are close to the experimental data of Hu
et al.4 Therefore, these small differences between experimental DRH values of macroscopic limit and those predicted in this work, can be considered as a success for this work because it can give accurate results with lower computational cost compared to the method of Bahadur
et al.13
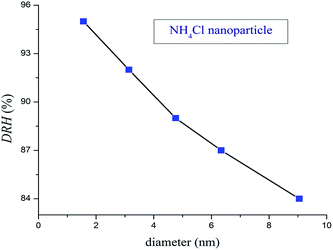 |
| | Fig. 4 Calculated DRH values as a function of nanoparticle diameter for NH4Cl nanoparticles at 300 K. | |
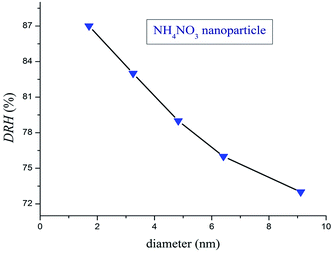 |
| | Fig. 5 Calculated DRH values as a function of nanoparticle diameter for NH4NO3 nanoparticles at 300 K. | |
Table 6 Fitting parameters of eqn (3) for DRH values of NH4Cl and NH4NO3 nanoparticles as a function of diameter of dry nanoparticle
| Nanoparticle |
a |
b |
c |
R2 |
DRH of bulk limit4 |
| NH4Cl |
22.84 |
8.66 |
75.97 |
0.9994 |
78% |
| NH4NO3 |
27.05 |
6.25 |
66.57 |
0.9981 |
61.8% |
The nanoparticle-air and nanoparticle-water surface tensions as a function of dry-nanoparticle diameter at 300 K for NH4Cl and NH4NO3 are presented in Fig. 6 and 7, respectively. In this paper, we have calculated surface tensions with test area method.12 As shown in these figures, both of NH4Cl and NH4NO3 nanoparticles have similar surface tensions and variation of them with nanoparticle size is very similar. The first point, is that nanoparticle-air surface tension (γsv) is more than nanoparticle-water (γsl) one. This is a reasonable result due to the fact that the relation between γsv and γsl can be described by Young equation:45
| | |
γwv cos θ = γsv − γsl
| (4) |
where
γwv is water–air surface tension and
θ is the contact angle between nanoparticle-water and water–air interfaces. This equation is as a result of Young–Laplace equation:
46| |
 | (5) |
where Δ
P is difference between the pressures inside of a droplet and its outside atmosphere,
γ is the surface tension between the droplet and its surrounding fluid and
r is its radius. On the basis of MD simulations, Matsumoto and Tanaka concluded that Young–Laplace equation is valid for nanoscale bubbles.
46 Moreover, on the basis of MD simulation results, Ingebrigtsen and Toxvaerd proposed that Young equation can be valid for nanoscale if the range of solid attraction does not exceed the thickness of interfaces.
46 The contact angle is a measure of wettability,
i.e. when [
θ < 90°] the solid has high wettability and [
θ > 90°] corresponds to low wettability. However, when the nanoparticles are completely wettable by water, it is more convenient that the spreading coefficient
S to be used for description of their deliquescence behavior:
47where [
S > 0] corresponds to complete wettability and [
S < 0] exhibits partial wettability. Since, both of NH
4Cl and NH
4NO
3 are soluble in water, for both of them we have [
S > 0]. Moreover,
γwv is always a positive value, this means that [(
γsv −
γsl) > 0] or [
γsv >
γsl] which is in agreement with the results of MD simulations of this work, see
Fig. 6 and
7. By comparison between these figures [
γsv −
γsl] value for NH
4Cl is less than NH
4NO
3 if the similar diameters of these nanoparticles are considered. This means that
S value and wettability of NH
4NO
3 nanoparticles are more than NH
4Cl ones. This result resembles that NH
4NO
3 nanoparticles should have lower DRH values compared to NH
4Cl ones which is in good agreement with results of MD simulations in this work. However, MD simulation has some limitations and cannot be applied to investigate all of phenomena involved in deliquescence process. As mentioned before, MD calculations with very large simulation times are not applicable and in many cases are impossible for common computer equipment of many academic institutes. Therefore, more concise study of deliquescence is a challenging area of computational chemistry and atmospheric research.
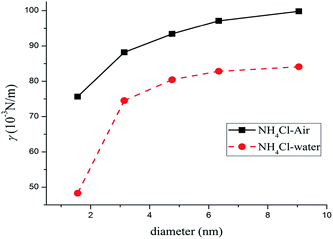 |
| | Fig. 6 The nanoparticle-air and nanoparticle-water surface tensions as a function of dry-nanoparticle diameter at 300 K for NH4Cl, calculated by MD simulation. | |
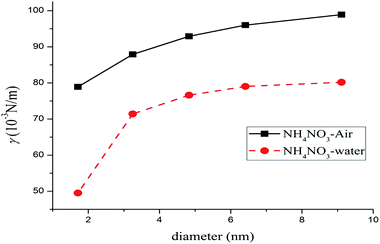 |
| | Fig. 7 The nanoparticle-air and nanoparticle-water surface tensions as a function of dry-nanoparticle diameter at 300 K for NH4NO3, calculated by MD simulation. | |
(b) Effect of temperature
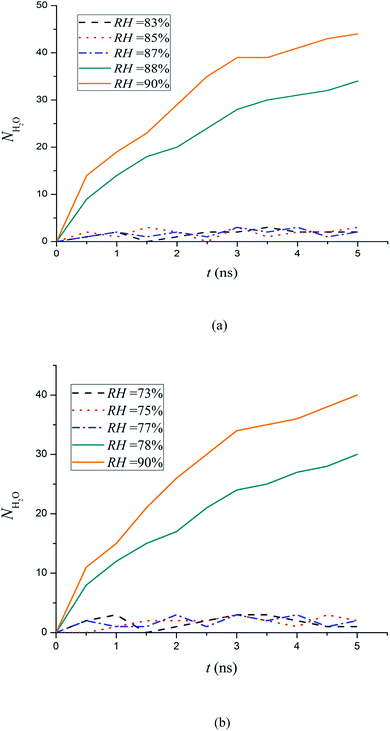
The number of adsorbed water molecules on the NH4Cl nanocrystal with diameter of 4.76 nm versus simulation time for different RHs at 280 and 300 K are presented in Fig. 8(a) and (b), respectively. Also, the same data for NH4NO3 nanocrystal with diameter of 4.83 nm versus simulation time for different RHs at 280 and 305 K are shown in Fig. 9(a) and (b), respectively. As it is obvious from Fig. 8(a) and (b), DRH values of NH4Cl nanoparticle with 4.76 nm diameter at 280 and 305 K are obtained 92% and 89%, respectively. Also Fig. 9(a) and (b) give DRH values of NH4NO3 nanoparticle with 4.83 nm diameter at mentioned temperatures are obtained 88% and 78%, respectively. In both of NH4Cl and NH4NO3 nanocrystals, DRH is decreased by increase of temperature. The mentioned result is also obtained for all other sizes of the nanocrystals studied in this work. Finally, DRH as a function of temperature for NH4Cl and NH4NO3 nanoparticles with the same diameters mentioned in Fig. 8 and 9, is shown in Fig. 10. This decrease of DRH at higher temperatures can be described by spreading coefficients, too. It is well-known that increase of temperature, decreases surface tension. As temperature increases, [γsv − γsl] is not changed considerably, because as shown in Fig. 8 and 9, the number of water adsorbates is too smaller than total number of nanoparticle molecules and effect of temperature on γsv and γsl is approximately the same. Also, increase of temperature, decreases γwv which means that S is increased by temperature. Therefore, increase of temperature leads to more wettability of nanoparticle and decreases its DRH value. This result again emphasizes on the importance of wettability as a measure of deliquescence. Another result of Fig. 10 is lower DRH value for NH4NO3 nanoparticles in comparison with NH4Cl at the same temperature which implies more ability of NH4NO3 aerosols to deliquescence at atmospheric environment. Hence, in the environmental point of view, attempts to decrease of NH4NO3 content in air, are more important than NH4Cl, when reducing the risk of acidic rains is important. This is in agreement with previous warning of scientists for dangerous effects of NOx particles in the atmosphere on the ecosystem of our earth.
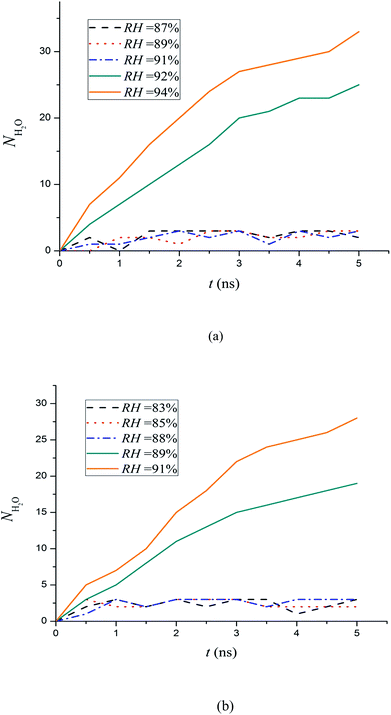 |
| | Fig. 8 The number of adsorbed water molecules on the NH4Cl nanocrystals with diameter of 4.76 nm versus simulation time at different relative humidities, for 280 K (a) and 305 K (b). | |
 |
| | Fig. 9 The number of adsorbed water molecules on the NH4NO3nanocrystals with diameter of 4.83 nm versus simulation time at different relative humidities, for 280 K (a) and 305 K (b). | |
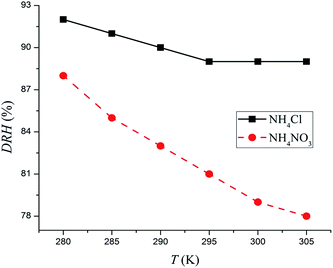 |
| | Fig. 10 Calculated DRH as a function of temperature for NH4Cl and NH4NO3nanoparticles with diameters the same as Fig. 8 and 9. | |
Conclusion
In this work, MD simulations were used to investigate the effects of size of the NH4Cl and NH4NO3 nanoparticles and temperature on their deliquescence in the atmosphere. The MD approach, used in this investigation, is based on a Grand Canonical treatment of water adsorption on the nanocrystal surface with considerably lower number of water molecules in simulation box. Extrapolation of the results to the bulk limit gives DRH values of NH4Cl and NH4NO3 crystals in good agreement with experimental data which shows that this MD approach is accurate enough with lower computational cost in comparison with previous MD simulations for deliquescence. Also, the results indicated that increase of both of nanoparticle size and temperature decreases DRH value. Moreover, at the same conditions, DRH values for NH4NO3 nanoparticles are smaller than NH4Cl ones. This means that NH4NO3 aerosols have more ability for deliquescence and its environmental consequences. Moreover, it was concluded that wettability of nanoparticle can be viewed as a measure of its deliquescence.
References
- X. Huang, R. Qiu, C. K. Chan and P. R. Kant, Atmos. Res., 2011, 99, 488–495 CrossRef CAS PubMed.
- O. S. Ryder, A. P. Ault, J. F. Cahill, T. L. Guasco, T. P. Riedel, L. A. Quadra-Rodriguez, C. J. Gaston, E. Fitzgerald, C. Lee, K. A. Prather and T. H. Bertram, Environ. Sci. Technol., 2014, 48, 1618–1627 CrossRef CAS PubMed.
- S. Philip, R. V. Martin, A. van Donkelaar, J. W. Lo, Y. Wang, D. Chen, L. Zhang, P. S. Kasibhatla, S. Wang, Q. Zhang, Z. Lu, D. G. Streets, S. Bittman and D. J. Macdonald, Environ. Sci. Technol., 2014, 48, 13060–13068 CrossRef CAS PubMed.
- D. Hu, J. Chen, X. Ye, L. Li and X. Yang, Atmos. Environ., 2011, 45, 2349–2355 CrossRef CAS PubMed.
- X. Wang, W. Wang, L. Yang, X. Gao, W. Nie, Y. Yu, P. Xu, Y. Zhou and Z. Wang, Atmos. Environ., 2012, 63, 68–76 CrossRef CAS PubMed.
- S. T. Martin, Chem. Rev., 2000, 100, 3403–3453 CrossRef CAS PubMed.
- X. Ge, A. S. Wexler and S. L. Clegg, Atmos. Environ., 2011, 45, 561–577 CrossRef CAS PubMed.
- C. Qiu and R. Zhang, Phys. Chem. Chem. Phys., 2013, 15, 5738–5752 RSC.
- W. C. Keene, J. Stutz, A. A. P. Pszenny, J. R. Maben, E. V. Fischer, A. M. Smith, R. von Glasow, S. Pechtl, B. C. Sive and A. K. Vaner, J. Geophys. Res., 2007, 112, D10S12 CrossRef.
- A. Saiz-Lopez and R. von Glasow, Chem. Soc. Rev., 2012, 41, 6448–6472 RSC.
- L. J. Mauer and L. S. Taylor, Annu. Rev. Food Sci. Technol., 2010, 1, 41–63 CrossRef CAS PubMed.
- R. Bahadur and L. M. Russell, Aerosol Sci. Technol., 2008, 42, 369–376 CrossRef CAS.
- R. Bahadur and L. M. Russell, J. Chem. Phys., 2008, 129, 094508 CrossRef PubMed.
- P. Jungwirth and D. J. Tobias, J. Phys. Chem. B, 2000, 104, 7702–7706 CrossRef CAS.
- X. Li, T. Hede, Y. Tu, C. Leck and H. Ågren, J. Phys. Chem. Lett., 2010, 1, 769–773 CrossRef CAS.
- C. W. Harmon, R. L. Grimm, T. M. McIntire, M. D. Peterson, B. Njegic, V. M. Angel, A. Alshawa, J. S. Underwood, D. J. Tobias, R. B. Gerber, M. S. Gordon, J. C. Hemminger and S. A. Nizkorodov, J. Phys. Chem. B, 2010, 114, 2435–2449 CrossRef CAS PubMed.
- M. Darvas, S. Picaud and P. Jedlovszky, Phys. Chem. Chem. Phys., 2011, 13, 19830–19839 RSC.
- L. Sun, T. Hede, Y. Tu, C. Leck and H. Ågren, J. Phys. Chem. A, 2013, 117, 10746–10752 CrossRef CAS PubMed.
- Y. Zhao, H. Li and C. X. Zeng, J. Am. Chem. Soc., 2013, 135, 15549–15558 CrossRef CAS PubMed.
- D. Vardanega and S. Picaud, J. Chem. Phys., 2014, 141, 104701 CrossRef PubMed.
- H. Henschel, J. C. A. Navarro, T. Yli-Juuti, O. Kupiainen-Määttä, T. Olenius, I. K. Ortega, S. L. Clegg, T. Kurtén, I. Riipinen and H. Vehkamäki, J. Phys. Chem. A, 2014, 118, 2599–2611 CrossRef CAS PubMed.
- A. Hudait and V. Molinero, J. Am. Chem. Soc., 2014, 136, 8081–8093 CrossRef CAS PubMed.
- N. Holmberg, J.-C. Chen, A. S. Foster and K. Laasonen, Phys. Chem. Chem. Phys., 2014, 16, 17437–17446 RSC.
- H. J. C. Berendsen, J. P. M. Postma, W. F. Gunsteren, A. Dinola and J. R. Haak, J. Chem. Phys., 1984, 81, 3684 CrossRef CAS PubMed.
- G. Bussi, D. Donadio and M. Parrinello, J. Chem. Phys., 2007, 126, 014101 CrossRef PubMed.
- S. Agrawalla and A. C. T. van Duin, J. Phys. Chem. A, 2011, 115, 960–972 CrossRef CAS PubMed.
- L. Zhao, L. Tao and S. Lin, Ind. Eng. Chem. Res., 2015, 54, 2489–2496 CrossRef CAS.
- N. Goga, M. N. Melo, A. J. Arzepiela, A. H. de Vries, A. Hadar, S. J. Marrink and H. J. C. Berendsen, J. Chem. Theory Comput., 2015, 11, 1389–1398 CrossRef CAS.
- W. Smith and I. T. Todorov, Mol. Simul., 2006, 32, 935–943 CrossRef CAS.
- W. Smith and T. R. Forester, J. Mol. Graphics, 1996, 14, 136–141 CrossRef CAS.
- I. Skarmoutsos, G. Tamiolakis and G. E. Froudakis, Phys. Chem. Chem. Phys., 2014, 16, 876–879 RSC.
- I. Skarmoutsos, G. Tamiolakis and G. E. Froudakis, J. Phys. Chem. C, 2013, 117, 19373–19381 CAS.
- H. A. Levy and S. W. Peterson, Phys. Rev., 1952, 86, 766–770 CrossRef CAS.
- C. S. Choi, J. E. Mapes and E. Prince, Acta Crystallogr., Sect. B: Struct. Crystallogr. Cryst. Chem., 1972, 28, 1357–1361 CrossRef CAS.
- V. Chaban, Chem. Phys. Lett., 2015, 618, 46–50 CrossRef CAS PubMed.
- A. K. Rappe, C. J. Casewit, K. S. Colwell, W. A. Goddard III and W. M. Skiff, J. Am. Chem. Soc., 1992, 114, 10024–10035 CrossRef CAS.
- R. C. Rizzo and W. L. Jorgensen, J. Am. Chem. Soc., 1999, 121, 4827–4836 CrossRef CAS.
- D. C. Sorescu and D. L. Thompson, J. Phys. Chem. A, 2001, 105, 720–733 CrossRef CAS.
- W. L. Jorgensen, J. Chandrasekhar, J. D. Madura, R. W. Impey and M. L. Klein, J. Chem. Phys., 1983, 79, 926–935 CrossRef CAS PubMed.
- E. M. Duffy, P. J. Kowalczyk and W. L. Jorgensen, J. Am. Chem. Soc., 1993, 115, 9271–9275 CrossRef CAS.
- G. F. Velardez, S. Alavi and D. L. Thompson, J. Chem. Phys., 2004, 120, 9151–9159 CrossRef CAS PubMed.
- J. J. Potoff and J. I. Siepmann, AIChE J., 2001, 47, 1676–1682 CrossRef CAS PubMed.
- J. Vrabec, J. Stoll and H. Hasse, J. Phys. Chem. B, 2001, 105, 12126–12133 CrossRef CAS.
- G. Biskos, A. Malinowski, L. M. Russell, P. R. Buseck and S. T. Martin, Aerosol Sci. Technol., 2006, 40, 97–106 CrossRef CAS.
- T. Ingebrigtsen and S. Toxvaerd, J. Phys. Chem. C, 2007, 111, 8518–8523 CAS.
- M. Matsumoto and K. Tanaka, Fluid Dynamics Res., 2008, 40, 546–553 CrossRef PubMed.
- S. Anand, K. Rykaczewski, S. B. Subramanyam, D. Beysens and K. K. Varanasi, Soft Matter, 2015, 11, 69–80 RSC.
|
| This journal is © The Royal Society of Chemistry 2015 |
Click here to see how this site uses Cookies. View our privacy policy here.  } where PH2O is the vapor pressure of water and
  is its saturated vapor pressure. They defined planar water uptake coefficient γ as (γ = 4Jm/ng
![[c with combining macron]](https://www.rsc.org/images/entities/i_char_0063_0304.gif) ) where Jm is the measured flux to the surface, ng is the molar density of vapor phase, and
) where Jm is the measured flux to the surface, ng is the molar density of vapor phase, and ![[c with combining macron]](https://www.rsc.org/images/entities/i_char_0063_0304.gif) is the average thermal velocity of vapor molecules.13 Their calculations showed that DRH is increasing with decreasing particle size. Also, planar water uptake coefficients exhibit a linear decrease with increasing of logarithm of fractional water coverage. Moreover, the particle uptake coefficients obey a linear relation with the logarithm of edge fraction. Due to the fact that edge fraction is a function of size, Bahadur and Russell concluded that edge effects are larger for smaller nanoparticles.13 However, they emphasized that simulation of complete deliquescence of the nanoparticles with sizes 2–11 nm requires MD simulation time between 1 to 100 μs which is not possible for convenient computational resources.13 Holmberg et al. studied dissolution of NaCl nanocrystals using ab initio molecular dynamics (AIMD) method and observed different dissolution rates for Na+ and Cl− ions. They found that this difference is due to the faster water-mediated elongations of ionic bonds to Na+ ion in comparison with Cl− one.23 All of the mentioned studies emphasized the size-dependent nature of deliquescence for nanoparticles with diameters smaller than 100 nm. However, despite of the mentioned simulations, there are not similar studies for deliquescence of NH4Cl and NH4NO3 nanoparticles. Therefore many parameters can affect on deliquescence of these nanoparticles under atmospheric conditions, such as effects of nanoparticle size, temperature, crystal structure, intermolecular interactions, and physical and chemical properties of atmospheric environment. As mentioned above, complete simulation of deliquescence of these nanoparticles requires very high computational equipment which is not available for most of the academic institutions. Therefore, application of an appropriate approximation for this type of MD simulation is very important. In this work, we studied deliquescence of NH4Cl and NH4NO3 nanoparticles by MD simulation in order to study the effects of temperature and nanoparticle size in the presence of air and water. Then, effects of nanoparticle size and temperature on the DRH values of these nanoparticles will be discussed.
is the average thermal velocity of vapor molecules.13 Their calculations showed that DRH is increasing with decreasing particle size. Also, planar water uptake coefficients exhibit a linear decrease with increasing of logarithm of fractional water coverage. Moreover, the particle uptake coefficients obey a linear relation with the logarithm of edge fraction. Due to the fact that edge fraction is a function of size, Bahadur and Russell concluded that edge effects are larger for smaller nanoparticles.13 However, they emphasized that simulation of complete deliquescence of the nanoparticles with sizes 2–11 nm requires MD simulation time between 1 to 100 μs which is not possible for convenient computational resources.13 Holmberg et al. studied dissolution of NaCl nanocrystals using ab initio molecular dynamics (AIMD) method and observed different dissolution rates for Na+ and Cl− ions. They found that this difference is due to the faster water-mediated elongations of ionic bonds to Na+ ion in comparison with Cl− one.23 All of the mentioned studies emphasized the size-dependent nature of deliquescence for nanoparticles with diameters smaller than 100 nm. However, despite of the mentioned simulations, there are not similar studies for deliquescence of NH4Cl and NH4NO3 nanoparticles. Therefore many parameters can affect on deliquescence of these nanoparticles under atmospheric conditions, such as effects of nanoparticle size, temperature, crystal structure, intermolecular interactions, and physical and chemical properties of atmospheric environment. As mentioned above, complete simulation of deliquescence of these nanoparticles requires very high computational equipment which is not available for most of the academic institutions. Therefore, application of an appropriate approximation for this type of MD simulation is very important. In this work, we studied deliquescence of NH4Cl and NH4NO3 nanoparticles by MD simulation in order to study the effects of temperature and nanoparticle size in the presence of air and water. Then, effects of nanoparticle size and temperature on the DRH values of these nanoparticles will be discussed.![[thin space (1/6-em)]](https://www.rsc.org/images/entities/char_2009.gif) 570 and 4893, respectively at 300 K. The number of water molecules included in the initial simulation box for different RH values at 300 K is given in Table 2. Also, in order to investigate temperature effect on deliquescence of mentioned nanoparticles, simulations were performed at 280, 285, 290, 295, 300, and 305 K for 4.76 and 4.83 nm diameters of NH4Cl and NH4NO3 nanoparticles, respectively. The ion–ion interactions are modeled using universal force field (UFF)36 OPLS,37 and Sorescu–Thompson38 force fields. Water molecules are described using the TIP4P potential.39 The parameters of TIP4P potential for water molecule are presented in Table 3. Also, the van der Waals interactions for NH4Cl37,40 and NH4NO3 (ref. 38 and 41) molecules were modeled by Lennard-Jones (LJ) 12-6 potential and the related parameters are given in Table 4a and 4b, respectively. Moreover, the LJ parameters between dissimilar pairs were obtained by Lorentz–Berthelot combining rule. The interactions between N2–N2, O2–O2 were also modeled by LJ 12-6 potential42,43 and their related LJ parameters are given in Table 5. The columbic long range interactions were calculated using Ewald method with a precision of 10−6 for automatic optimization of Ewald summation parameters. All interatomic interactions between the atoms in the simulation box have calculated within the cutoff distance 12 Å. Also, a snapshot for a portion of simulation box containing NH4Cl nanoparticle with 3.138 nm size at 300 K and 83% RH is represented in Fig. 1.
570 and 4893, respectively at 300 K. The number of water molecules included in the initial simulation box for different RH values at 300 K is given in Table 2. Also, in order to investigate temperature effect on deliquescence of mentioned nanoparticles, simulations were performed at 280, 285, 290, 295, 300, and 305 K for 4.76 and 4.83 nm diameters of NH4Cl and NH4NO3 nanoparticles, respectively. The ion–ion interactions are modeled using universal force field (UFF)36 OPLS,37 and Sorescu–Thompson38 force fields. Water molecules are described using the TIP4P potential.39 The parameters of TIP4P potential for water molecule are presented in Table 3. Also, the van der Waals interactions for NH4Cl37,40 and NH4NO3 (ref. 38 and 41) molecules were modeled by Lennard-Jones (LJ) 12-6 potential and the related parameters are given in Table 4a and 4b, respectively. Moreover, the LJ parameters between dissimilar pairs were obtained by Lorentz–Berthelot combining rule. The interactions between N2–N2, O2–O2 were also modeled by LJ 12-6 potential42,43 and their related LJ parameters are given in Table 5. The columbic long range interactions were calculated using Ewald method with a precision of 10−6 for automatic optimization of Ewald summation parameters. All interatomic interactions between the atoms in the simulation box have calculated within the cutoff distance 12 Å. Also, a snapshot for a portion of simulation box containing NH4Cl nanoparticle with 3.138 nm size at 300 K and 83% RH is represented in Fig. 1.


