Experimental and theoretical study on dissolution of a single mixed gas bubble in a microalgae suspension

Sha Zhaoab, Yu-Dong Ding*ab, Qiang Liaoab, Xun Zhuab and Yun Huangab
aKey Laboratory of Low-grade Energy Utilization Technologies and Systems (Chongqing University), Ministry of Education, Chongqing 400030, China. E-mail: dingyudong@cqu.edu.cn; Fax: +86-23-65102474; Tel: +86-23-65102474
bInstitute of Engineering Thermophysics, Chongqing University, Chongqing 400030, China

Received 5th March 2015 , Accepted 31st March 2015

First published on 31st March 2015


Abstract

Aiming at technology for biofixation of carbon dioxide by microalgae in photobioreactors, a basic phenomenon, that is, the dissolution and consumption of a mixed gas bubble consisting of CO2 and air in a microalgae suspension, was investigated by visualization experiments using the promoted bubble grafting method. Furthermore, a theoretical model based on non-equilibrium theory at the gas–liquid interface was also proposed to predict the CO2 dissolution and fixation characteristics of bubbles in a microalgae suspension. The effects of the initial CO2 volume fraction, initial bubble size and microalgae concentration were discussed respectively. It was found that the bubble radius gradually decreased with time and trended towards a constant thereafter. The dimensionless Biot number in the promoted dissolution model was determined as 0.65 for the microalgae suspension. The bubble with a larger initial CO2 volume fraction experienced faster shrinkage and had a higher dissolution rate and CO2 fixation efficiency, while slight photosynthesis inhibition emerged at the beginning of dissolution when the initial CO2 volume fraction in the bubble was larger than 15%. A smaller initial bubble size resulted in a lower dissolution rate but greater CO2 fixation efficiency by photosynthesis. Higher microalgae concentration facilitated bubble dissolution and CO2 fixation especially when OD680 nm of the microalgae suspension was less than 1.0. These findings can be a guide to the design of a photobioreactor and aerator.

1. Introduction

With the rapid economic growth in the last few decades, over-exploitation and overuse of fossil energy has brought about serious global warming. Carbon dioxide is the main contribution to global warming due to its greenhouse effect. Carbon capture and storage (CCS) is gaining more and more attention around the world in recent years.1 CCS technology can be classified into physical,2 chemical3–5 and biological6 techniques. As one of the biological techniques, microalgae carbon capture, which converts CO2 into organics with the help of light, has spectacular advantages such as environment-friendly, low cost and safety, and thus is considered as the most promising technique for CO2 capture.7,8 For a typical microalgae carbon capture process, CO2 is blasted into a reactor by a bubble distributer to form a bubble flow rising up through the reactor. Then CO2 molecules in the bubble diffuse across the gas–liquid interface and dissolve into the surrounding microalgae suspension. Afterwards, the dissolved CO2 is consumed by microalgae cells to produce organics through photosynthesis. Thus, CO2 transportation will significantly affect microalgae growth, bio-oil accumulation and CO2 fixation in bubble flow photobioreactors. Some researches were carried out on two-phase flow and mass transfer characteristics in photobioreactors.9–12 Up to now, however, most of the researches concentrated on the flow and transportation in the scale of whole photobioreactor. The CO2 transportation and fixation near the gas–liquid interface in microalgae suspension, as one of the key processes, has not been thoroughly investigated due to complex behaviors of bubbles in two-phase flow. Therefore, as the most basic problem extracted from the bubble flow in photobioreactor, it is essential to study the coupled process of the mixed gas bubble dissolution and CO2 diffusion along with its biochemical consumption in microalgae suspension. The output of this work can be a guide to the design of gas distribution system in photobioreactor.

Over the past decades, numerous experimental studies on the dissolution and diffusion of a stationary bubble in liquid have been carried out in many industrial fields. Kentish et al.13 observed the dissolution process of air bubbles in water with different dissolved air concentrations by holding the bubble under a horizontal glass plate. The variations of bubble radius with time were achieved by processing the captured images. However, the initial stage of bubble dissolution was not captured in most cases. Duncan et al.14 observed the dissolution process of a single air microparticle in water using micromanipulation technique where the microparticle was held by a micropipette. The effect of undersaturation and surface tension were analyzed. George et al.15 used acoustic scattering to investigate the dissolution process of a single air bubble placed on a fine nylon thread in undersaturated fresh water, and the dissolution rate of small gas bubble was obtained by acoustic data. Although existing works have revealed the dissolution process of single stationary pure gas bubble in water, the dissolution process of single mixed gas bubble consisting of CO2 and air in microalgae suspension have not been well understood. It is believed that different dissolution and mass transfer characteristics of a mixed gas bubble in microalgae suspension will exist considering microalgae behaviors and time-dependent properties in gas bubble. Furthermore, it is also noted that the mass transfer characteristics under dynamic process of dissolution are hard to obtain through experiments due to the measurement limitation. Thus, theoretical researches become increasingly important to predict the dissolution processes of bubbles.

As for theoretical investigations, many papers on the dissolution and diffusion of a stationary bubble in liquid have been published.16–24 Most of them were based on the equilibrium theory at the interface, in which the dissolved gas concentration at the gas–liquid interface was assumed to be in equilibrium with the gas in the bubble. The dissolved gas concentration at the interface was proportional to the gas partial pressure in the bubble and can be calculated by Henry's law. As a result, the classic Epstein and Plesset equation16 proposed in 1950 are still widely used to describe the growth and dissolution process of a single air bubble in recent years.17–19 In their study the bubble was simplified as a sphere during the dissolution, and the dissolution of bubbles was driven only by the concentration gradient of air. Duncan et al.14 revised this theory by complementing the pressure-driven, and their new theory was verified by a visualization experiment. They also proposed that the bubble size was approximately proportional to 1/2 power of the time. Some researches applied the revised Epstein and Plesset's model to predict the dissolution process of bubbles with different sizes in sea water or other substances.20,21 However, the equilibrium theory is failed to exactly predict the dissolution process of bubble with a high mass transfer rate. Thus, a non-equilibrium theory at the interface was put forward by Ma et al.22,23 in 2005 and was verified by a holographic interferometry experiment. Tian et al.24 simulated the dissolving and rising process of bubble in liquid by building a model based on the boundary layer mass transfer model and non-equilibrium mass transfer theory, and their results were in good agreement with the experimental data. Unfortunately, less theoretical studies have been reported on the dissolution process of mixed gas bubbles in liquid involving biochemical reactions synchronously.

In the present study, the dissolution process of a single mixed gas bubble consisting of CO2 and air in microalgae suspension was investigated experimentally and theoretically. The effects of initial CO2 volume fraction in bubble, initial bubble size and microalgae concentration were analyzed on the CO2 dissolution rate and fixation efficiency.

2. Experimental system and method

2.1 Experimental system

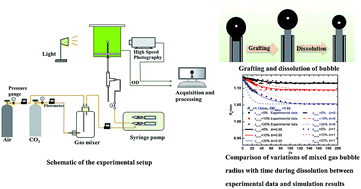
The experimental system of dissolution of a single mixed gas bubble in microalgae suspension is shown in Fig. 1a. It consisted of a test section, a gas supply system and a data acquisition system. The test section was a transparent test vessel (PMMA) with a cross section of 100 mm × 100 mm and it was filled with microalgae suspension to a height of 200 mm prior to experiments. The gas supply system consisted of gas tanks, a gas mixer, a syringe pump (LongerPump LSP02-1B), a bubble generator, pressure gauges and mass flow controllers. The bubble generator was set at the vessel bottom and was vertically fixed by a partition with a hole (Φ 1.1 mm in diameter) at the center. Pure CO2 (99.99%) and air (N2 and O2) from the tanks were completely mixed in the gas mixer and then, the mixed gas was injected into the bubble generator by the syringe pump to form a bubble in the microalgae suspension. The concentration of CO2 in the bubble and flow rate of the mixed gas were adjusted by the mass flow controllers. Thereafter, the dissolution process of the bubble was recorded by the data acquisition system which consisted of a cool light, a high speed photography (Phantom V5.1 at the shooting speed of 1000 fps) and data storage system. The recorded bubble images were processed and analyzed by the self-developed software using Matlab software.25
image file: c5ra03905c-f1.tif
Fig. 1 The experimental systems for dissolution of a single mixed gas bubble in microalgae suspension: (a) schematic of the experimental setup; (b) grafting and dissolution of bubble.

To obtain a bubble with desired diameter, the bubble generator was specially designed to eliminate the effect of gas compressibility in connection tube and injection process. As shown in Fig. 1b, the bubble generator was composed of a glass capillary (0.9 mm in inner diameter) and a capillary plastic rod (0.5 mm in diameter). When the mixed gas was pumped through the glass capillary to form a bubble on the tip with a desired size, the capillary plastic rod was quickly pushed to graft the bubble on the tip of the rod and then the bubble was isolated from the gas source. As thus, the dissolution of a bubble with the desired diameter can be investigated.

2.2 Microalgae and culture medium

The cells of Chlorella pyrenoidosa (purchased from Institute of Hydrobiology, Chinese Academy of Sciences, China) was cultivated in the SE (Brostol's solution) medium at 25 °C. The medium contained the following elements per liter: 0.25 g NaNO3, 0.075 g K2HPO4, 0.098 g MgSO4·7H2O, 0.025 g CaCl2·2H2O, 0.175 g KH2PO4, 0.025 g NaCl, 0.05 g FeCl3·6H2O, 1 mL EDTA-Fe, 1 mL trace mental solution and 40 mL soil extraction solution. 1 L EDTA-Fe solution was composed of 41 mL HCL, 9.306 g EDTA-Na2 and 45.05 g FeCl3·6H2O. 1 L trace mental solution contained 2.86 g H3BO3, 1.86 g MnCL2·4H2O, 0.22 g ZnSO4·7H2O, 0.39 g Na2MO4·2H2O, 0.08 g CuSO4·5H2O and 0.05 g Co(NO3)2·6H2O.26 The concentration of the microalgae suspension was characterized by optical density at a wavelength of 680 nm (OD680 nm) measured by UV-VIS spectrophotometer (TU-1901, China). Prior to the experiments, the microalgae suspensions were air saturated.

3. Model and calculation

3.1 Physical descriptions and assumptions

A bubble containing CO2 in the microalgae suspension will gradually shrink due to the diffusion of CO2 through the gas–liquid interface into the microalgae suspension as shown in Fig. 2. The diffused CO2 dissolves in the suspension and then is consumed by the microalgae through photosynthesis. The bubble stops shrinking once CO2 in the bubble is completely consumed. To theoretically simulate the dissolution process of a single bubble with mixed gas of CO2, O2 and N2 in the microalgae solution, the equilibrium theory and non-equilibrium theory for mass transfer at the gas–liquid interface are adopted. Considering the practical physical features, some assumptions are made as follows:
image file: c5ra03905c-f2.tif
Fig. 2 The physical model to describe the dissolution of a single mixed gas bubble in quiescent microalgae suspension.

(1) The bubble is treated as a spherical bubble and maintains spherical shape during dissolution due to small diameter.

(2) The CO2 volume fraction inside the bubble is assumed as an uniform distribution considering the diffusion coefficient of CO2 in air is about two orders greater than that in microalgae suspension.

(3) The liquid flow caused by bubble shrinking is neglected, and only diffusion happens in the microalgae suspension which is dominated by Fickian diffusion.

(4) The dissolved CO2 maintains at molecular state and the reaction between CO2 and water is neglected due to smaller reaction constant and lower carbonic anhydrase activity30–32 when the CO2 volume fraction supplied is between 5% and 20%. The distribution of CO2 concentration in microalgae suspension only changes along the radial direction due to even distribution of microalgae in the solution.

(5) Since the microalgae suspension is saturated with N2 and O2 in advance, the dissolution of N2 and O2 are neglected and the oxygen produced by photosynthesis of microalgae is consumed by its own respiration.

(6) The diffusivity, temperature and pressure of the microalgae suspension are constant, and the effect of light is neglected. All the gas are treated as ideal gas.

3.2 Diffusion process from bubble

As CO2 in the bubble diffuses into the microalgae suspension, the bubble radius decreases owing to the imbalance pressure at the gas–liquid interface. The change rate of gas mass in the bubble can be calculated as:
 
image file: c5ra03905c-t1.tif(1)
where m and ρ is mass and density of the mixed gas in bubble, respectively, Rb is the bubble radius. jRb is the CO2 diffusion flux through the gas–liquid interface, which can be obtained by applying Fick's first law in the microalgae suspension as
 
image file: c5ra03905c-t2.tif(2)
where MCO2 is the CO2 molecular weight, DCO2 is the diffusion coefficient of CO2 gas in the microalgae suspension, C is the CO2 concentration in microalgae suspension.

During the diffusion process, the gas pressure and the composition proportion in the bubble changed with the CO2 diffusion, resulting in the change of the mixed gas density. Applying the Laplace equation and the ideal gas equation, the decreasing rate of the bubble radius can be obtained by

 
image file: c5ra03905c-t3.tif(3)
where σ is the surface tension coefficient of microalgae suspension, Pl is the liquid pressure at the height of bubble center, R is the gas constant, T is the temperature of mixed gas, M is the molecular weight of mixed gas (M = xCO2MCO2 + xAirMAir).

3.3 Dissolution process in microalgae suspension

After CO2 gas transfers from the bubble into the microalgae suspension, it will firstly dissolve in the microalgae suspension and then be consumed by the microalgae. Therefore, the CO2 concentration distribution in the microalgae suspension can be described by Fick's second law of diffusion as:
 
image file: c5ra03905c-t4.tif(4)
where ΦCO2 is the CO2 volumetric consumption rate in microalgae suspension by biochemical reaction. This consumption rate can be calculated based on the biochemical reaction kinetics of Chlorella pyrenoidosa as26
 
ΦCO2 = (3.94 × 10⁶C4 − 8.43 × 10⁴C3 + 6.30 × 10²C2 − 1.84C) × (0.54OD680 nm − 0.05), (0 ≤ C ≤ 8.5 mmol L−1) (5)

The initial and boundary conditions can be described as

 
t = 0, C = C0 (6)
 
image file: c5ra03905c-t5.tif(7)
where C0 is the initial CO2 concentration in microalgae suspension, CRb(t) is the gas concentration at the gas–liquid interface which changes with time. The CO2 diffusion flux in the microalgae suspension can be calculated as
 
image file: c5ra03905c-t6.tif(8)

Considering the existence of biochemical reaction by the microalgae and the variation of bubble shape during dissolution, CRb(t) can be calculated by non-equilibrium theory at the interface22 as

 
image file: c5ra03905c-t7.tif(9)
where Bi is dimensionless Biot number, C* is the equilibrium concentration of CO2 at gas–liquid interface and can be calculated according to Henry's law:
 
C* = HPCO2 (10)
where H is Henry's constant of CO2 dissolved in microalgae suspension, PCO2 is CO2 partial pressure in the bubble.

It should be pointed out that the dimensionless Biot number is defined as the ratio of practical mass transfer coefficient to that in the film model, image file: c5ra03905c-t8.tif, where kl is the practical mass transfer coefficient in microalgae suspension, δ is the thickness of concentration boundary layer in microalgae suspension. Bi reflects the differences between the practical operating conditions and the film model. When Bi is equal to 0, the non-equilibrium theory can be simplified as the equilibrium theory (CRb = C*). When Bi is equal to 1, the model of mass transfer at the gas–liquid interface can be simplified as the film model.22 For the case studied here, Bi should be between 0 and 1, and is determined by physical properties of microalgae suspension and CO2 biochemical absorption.

3.4 Performance assessment

For the whole dissolution process of a single mixed gas bubble in microalgae suspension, including diffusion, dissolution and consumption, the CO2 dissolution rate (ψ), CO2 utilization rate (ζ) and CO2 fixation efficiency by photosynthesis (η) are chosen to assess the performance. These criteria are defined as:
 
image file: c5ra03905c-t9.tif(11)
 
image file: c5ra03905c-t10.tif(12)
 
image file: c5ra03905c-t11.tif(13)
where ng,0 is the initial amount of CO2 in bubble, ng,t is the amount of CO2 in bubble at a certain residence time, nl,t is the amount of CO2 dissolved in microalgae suspension at a certain residence time. The parameters used in the model are shown in Table 1.
Table 1 Parameters used in the model
Parameter Symbol Value Unit Source
CO2 diffusivity in microalgae suspension DCO2 1.88 × 10⁻⁹ m2 s−1 27 and 28
Surface tension coefficient of CO2 in microalgae suspension σ 6.78 × 10⁻² N m−1 29
Henry's constant of CO2 in microalgae suspension H 3.36 × 10⁻⁷ mol (L−1 Pa−1)  
Molecular weight of CO2 MCO2 44 g mol−1  
Molecular weight of air MAir 29 g mol−1  
Temperature T 298 K  
Gas constant R 8.314 J mol−1 K−1  
Atmospheric pressure P 101[thin space (1/6-em)]000 Pa  
Gravitational acceleration g 9.8 m s−2  


4. Results and discussions

Prior to the experiments on CO2 dissolution, the microalgae Chlorella pyrenoidosa were cultivated at a light intensity of 66 μmol m−2 s−1 and temperature of 25 °C. The initial CO2 volume fraction in the mixed gas supplied to Chlorella pyrenoidosa was 5% and the gas flow rate was controlled at 30 mL min−1. The growth process was recorded and the results are shown in Fig. 3. As time progressed, OD680 nm gradually increased to reach a constant value of about 2.57 after 7 days, implying a steady state of microalgae growth. The maximum dry weight of the microalgae achieved 1.34 g L−1. To facilitate clear observation, the microalgae suspensions in the first three days during the logarithmic phase were chosen to be the experimental media.
image file: c5ra03905c-f3.tif
Fig. 3 Growth curve of Chlorella pyrenoidosa.

For the parametric study, the dissolution characteristics of bubbles with various initial CO2 volume fractions (5%, 10% and 20%) as well as various initial sizes (0.98 mm, 1.13 mm and 1.20 mm) were investigated in the microalgae suspension with different OD680 nm (0.51, 1.02 and 1.51). Furthermore, to expand the parametric study, the simulation works were also carried out after the determination of Bi based on experimental data. Finally, the CO2 dissolution rate and CO2 fixation efficiency of microalgae were obtained.

4.1 Dissolution evolution of a mixed gas bubble in microalgae suspension

The radius evolutions of mixed gas bubbles dissolving in microalgae suspension (OD680 nm = 1.02) are shown in Fig. 4, where the bubbles had the same initial radius of 1.13 mm and the initial CO2 volume fraction in bubble was 5%, 10% and 20%, respectively. The experimental results showed that, for a certain initial CO2 volume fraction, the bubble radius gradually decreased with time and trended towards a constant thereafter, implying an end to the dissolution. Furthermore, for bubble with higher initial CO2 volume fraction, the decrease in the radius was fastened and the dissolution time was extended. The final bubble radius decreased with increasing initial CO2 volume fraction. This can be understood that higher initial CO2 volume fraction in bubble results in improved concentration gradient between the bubble and the microalgae suspension, which promotes the gas diffusion and dissolution process. Considering the same initial bubble radius, the smaller equilibrium radius at the case with higher initial CO2 volume fraction is due to more CO2 dissolving in the suspension.
image file: c5ra03905c-f4.tif
Fig. 4 Comparison of variations of mixed gas bubble radius with time during dissolution between experimental data and simulation results for different initial volume fraction of CO2 in quiescent microalgae suspension (Rb,0 = 1.13 mm, OD680 nm = 1.02).

Moreover, the promoted theoretical model was applied to simulate the above radius evolutions during dissolution process using different dimensionless Biot numbers, Bi. It can be seen from Fig. 4 that the simulation results with Bi = 0 deviated from the experimental data at early stage of dissolution for any cases, while the simulation results with Bi = 1 only approached the experimental data for the case with smaller initial CO2 volume fraction. The good agreement between the simulation results and experimental data was reached when Bi = 0.65, and the maximum relative error ranged from ±0.64% to ±1.29%, cf. Table 2. Therefore, for the dissolution of mixed gas bubble in the microalgae suspension, the dimensionless Biot number was determined as 0.65, and this value was used in all of the following simulations.

Table 2 The maximum relative error between the experimental and simulated results in different value of Bi
CO2% Maximum relative error
Bi = 0 Bi = 0.65 Bi = 1
5% ±1.36% ±0.64% ±0.70%
10% ±2.12% ±0.91% ±1.54%
20% ±3.37% ±1.29% ±2.80%


To further understand the details in the dissolution, the CO2 concentration distributions and the CO2 volumetric consumption rate in the microalgae suspension during the dissolution process were calculated for the case with initial CO2 volume fraction of 20%, as shown in Fig. 5. One can see from Fig. 5a that, at the first 0.1 s, a significant high CO2 concentration was reached at the gas–liquid interface, and the greatest CO2 concentration gradient was built within an influence distance by the dissolution of about 2.7% initial bubble radius. This can be expected that the mixed gas bubble acts as the source of CO2 and thus it has the largest CO2 concentration at the gas–liquid interface for the CO2 transmission. However, it was noted that the CO2 volumetric consumption rate at this moment experienced an increase at first and then a decrease along the radial direction after reaching a peak value. The lower CO2 consumption rate near the gas–liquid interface should be attributed to too high CO2 concentration, which causes excess cell fluids acidification and microalgae narcotization33 and the decrease of the enzyme activity for CO2 fixation.34,35 As a result, the photosynthesis was inhibited. The inhibition gradually weakens with the increase of the distance from the interface. The significantly decreased CO2 concentration in the microalgae suspension gradually turns to facilitate the microalgae photosynthesis, thus pushing up the CO2 consumption rate. The maximum CO2 consumption rate of 0.94 × 10⁻³ mol L−1 s−1 was reached at the CO2 concentration in the microalgae suspension of 2.57 × 10⁻³ mol L−1. Nevertheless, the further decreasing CO2 concentration along the radial direction comes to the difficulty in satisfying the microalgae, hence resulting in the decrease in CO2 consumption rate.


image file: c5ra03905c-f5.tif
Fig. 5 Distributions of the CO2 concentration and ΦCO2 in radial direction in microalgae suspension when initial volume fraction of CO2 in bubble is 20% (Rb,0 = 1.13 mm, OD680 nm = 1.02): (a) t ≤ 5 s; (b) t ≥ 5 s.

With CO2 diffusion outwards and consumption by microalgae, the CO2 concentration near the gas–liquid interface dramatically dropped by more than half at 0.2 s, while, the influence distance by dissolution was almost doubled. This not only increased the CO2 consumption rate near the gas–liquid interface but also increased the CO2 consumption rate in the area far from the interface. After the dissolution time exceeded 0.4 s, the CO2 concentration and concentration gradient in the microalgae suspension gradually decreased as time progressed due to the CO2 diffusion and consumption by microalgae, cf. Fig. 5a and b. The CO2 consumption rate obtained the maximum value near the gas–liquid interface and then monotonously decreased along the radial direction. The dissolution continued extending further from the bubble. However, as seen in Fig. 5b, the influence distance by dissolution gradually shrinked since 10 s accompanying with significant decrease in the bubble radius due to a progressive reduction in the CO2 amount inside the bubble. It had to point out that the whole dissolution process lasted a long time in the later stage owing to weaken diffusion driven by slight CO2 concentration gradient.

4.2 Effect of initial CO2 volume fraction in bubble

As mentioned above, the initial CO2 volume fraction in bubble plays an important role in the CO2 dissolution in microalgae suspension. Therefore, the effect of initial CO2 volume fraction was further investigated. Fig. 6 plots the simulation results of CO2 concentration distribution and CO2 diffusion flux in the microalgae suspension (OD680 nm = 1.02) at t = 20 s under different initial CO2 volume fractions. Considering the variation of the bubble radius during dissolution process, the origin of horizontal ordinate here was set at the gas–liquid interface of the bubble for more clear comparison. It can be seen that larger initial CO2 volume fraction led to higher CO2 concentration and diffusion flux due to greater CO2 partial pressure inside the bubble and improved concentration gradient between the bubble and microalgae suspension. The CO2 transmission range also enlarged with increasing initial CO2 volume fraction due to higher CO2 dissolution rate. However, the increase in the CO2 diffusion flux evidently slowed down at high initial CO2 volume fractions, especially at the gas–liquid interface.
image file: c5ra03905c-f6.tif
Fig. 6 Effect of initial CO2 volume fraction on the CO2 concentration distribution and CO2 diffusion flux in microalgae suspension along radial direction at t = 20 s (Rb,0 = 1.13 mm, OD680 nm = 1.02): (a) CO2 concentration distribution; (b) CO2 diffusion flux.

Fig. 7 shows the effect of initial CO2 volume fraction on CO2 dissolution and fixation characteristics during the mixed gas bubble dissolving in the microalgae suspension. The CO2 dissolution rate gradually decreased with time due to progressively decreased CO2 concentration gradient between the bubble and the microalgae suspension, cf. Fig. 7a. The dissolution rate reached zero indicating the end of dissolution and exhaustion of CO2 in bubble. Furthermore, the CO2 dissolution rate increased with increasing initial CO2 volume fraction. This is because high initial CO2 volume fraction enlarges CO2 concentration gradient between the bubble and the microalgae suspension, resulting in enhancement of CO2 transfer in microalgae suspension. However, the CO2 dissolution rate decreased faster in the case with higher initial CO2 volume fraction. This is resulted from the larger CO2 diffusion amount at early stage of dissolution and the decreased specific area for diffusion due to the quick shrinking of the bubble.


image file: c5ra03905c-f7.tif
Fig. 7 Effect of initial CO2 volume fraction on the CO2 dissolution and fixation characteristics of a mixed gas bubble in microalgae suspension (Rb,0 = 1.13 mm, OD680 nm = 1.02): (a) variations of CO2 dissolution rate with time; (b) variations of CO2 utilization rate with time; (c) variations of CO2 fixation efficiency by photosynthesis with time.

For the CO2 utilization rate in microalgae suspension, as shown in Fig. 7b, it also increased with increasing initial CO2 volume fraction due to the more amount of CO2 dissolving into microalgae suspension. Particularly worth mentioning is that the CO2 utilization rate had slight increase during the first few seconds of bubble dissolution when the initial CO2 volume fraction in bubble was 15% and 20%, as seen in the insert of Fig. 7b. This is attributed to the recovery from the photosynthesis inhibition at the beginning of dissolution due to over-high CO2 concentration near the gas–liquid interface, as analyzed above. Subsequently, the decreasing CO2 dissolved load was responsible for the decline in CO2 utilization rate. This result evidently confirms that the photosynthesis by microalgae under the present conditions is a diffusion controlled process except the short moment of photosynthesis inhibition.

Fig. 7c exhibits the effect of initial CO2 volume fraction on variations of CO2 fixation efficiency by photosynthesis. One can see that the CO2 fixation efficiency quickly increased at first and then gradually slowed down with increasing residence time due to the decreased CO2 utilization rate. When the initial CO2 volume fraction was increased from 5% to 10%, the CO2 fixation efficiency was improved due to enhanced CO2 dissolution and CO2 utilization rate. However, no more improvement was found in the CO2 fixation efficiency when the initial CO2 volume fraction was more than 10%. This can be understood that the increment in the initial CO2 load overtakes the increment in the consumption by microalgae. All of the CO2 fixation efficiency reached 100% when the bubble residence time was extended to about 200 s.

4.3 Effect of initial bubble size

The effect of initial bubble size on the CO2 dissolution and fixation characteristics of a mixed gas bubble in microalgae suspension (OD680 nm = 1.02) was experimentally and theoretically investigated with 20% of initial CO2 volume fraction in bubble, as shown in Fig. 8 and 9. Three initial bubble radii (0.98 mm, 1.13 mm and 1.20 mm) were set in the experiments and two more initial bubble radii (2 mm and 3 mm) were adopted in the simulations. As shown in Fig. 8a, both the experimental data and the simulation results on the bubble radius evolution clearly depicted that the smaller bubble experienced a faster shrink. For the dissolution of mixed gas bubbles with different sizes in microalgae suspension, two aspects should be taken into consideration. One is the diffusion area of the bubble, another is the gas pressure. Obviously, small gas bubble has small diffusion area which is unconducive to CO2 diffusion from bubble to suspension. However, small gas bubble bears high surface tension, leading to high gas pressure in the bubble according to the Young–Laplace equation. Considering the same initial CO2 volume fraction in bubble, CO2 gas obtains high partial pressure in the small bubble. This results in high equilibrium concentration of CO2 at the gas–liquid interface, hence facilitating CO2 transportation. As shown in Fig. 8b, the small bubble obtained high CO2 diffusion flux through the gas–liquid interface at the early stage of the dissolution. This contributes to the fast shrink of the small bubble. Moreover, it has to be pointed out that small bubble possesses less CO2 amount for diffusion and dissolution, leading to quick drop in the diffusion flux.
image file: c5ra03905c-f8.tif
Fig. 8 Effect of initial bubble size on the bubble dissolution process of a mixed gas bubble in microalgae suspension (OD680 nm = 1.02, initial CO2 volume fraction is 20%): (a) variations of mixed gas bubble radius with time; (b) variations of CO2 diffusion flux through the gas–liquid interface with time.

image file: c5ra03905c-f9.tif
Fig. 9 Effect of initial bubble size on the CO2 dissolution and fixation characteristics of a mixed gas bubble in microalgae suspension (OD680 nm = 1.02, initial CO2 volume fraction is 20%): (a) variations of CO2 dissolution rate with time; (b) variations of CO2 utilization rate with time; (c) variations of CO2 fixation efficiency by photosynthesis with time.

Fig. 9a and b show the variations of CO2 dissolution rate and CO2 utilization rate with time. For the bubbles, the dissolution rate and CO2 utilization rate decreased with time progressing to reach zero, implying the end of dissolution and the exhaust of CO2. Furthermore, both the dissolution rate and CO2 utilization rate significantly increased with increasing initial bubble size. This is resulted from more CO2 amount and large diffusion area for a large bubble, for example, the CO2 amount and diffusion area of the bubble with initial radius of 3 mm is 27.7 times and 8.4 times higher than that of the bubble with initial radius of 0.98 mm. Nevertheless, the dissolution time also increased significantly with increasing initial bubble size. For instance, the dissolution rate reduces to 0 at 93.4 s for the bubble with initial radius of 0.98 mm, while the dissolution stopped at 258.9 s for the bubble with initial radius of 2 mm. Fig. 9c plots the effect of initial bubble size on variations of CO2 fixation efficiency by photosynthesis. It was found that the CO2 fixation efficiency got higher rise speed and reached 95% at 68 s for the smaller bubble although it was of smaller CO2 utilization rate. The larger bubble, however, the lower CO2 fixation efficiency during a long period, and the fixation efficiency reached 95% at 251 s for the bubble with initial radius of 3 mm. This result suggests that small bubble should be supplied in photobioreactors for the purpose of effective CO2 fixation and volume reduction in reactor. Furthermore, this also can be a guide to the design of photobioreactor and the aerator.

4.4 Effect of microalgae concentration

Fig. 10 depicts the effect of microalgae concentration on the CO2 dissolution and fixation characteristics of a mixed gas bubble (1.13 mm in initial radius and 20% in initial CO2 volume fraction) in microalgae suspension. Five microalgae concentrations including OD680 nm of 0.51, 1.02, 1.51, 0.25 and 2 were used in the experiments and simulations, respectively. One can find from Fig. 10a that the bubble shrink was quickened in microalgae suspension with higher OD680 nm. High microalgae concentration creates more CO2 gas consumed by biochemical reaction, giving rise to lower CO2 concentration in microalgae suspension. This enlarges the concentration gradient of CO2 between the bubble and microalgae suspension and thus, promotes CO2 transportation and accelerates bubble shrink. It should be pointed out that the acceleration of bubble shrink was impeded when OD680 nm went beyond 1.51. The dissolution process was slowed down in the later period due to less amount of CO2 remained in the bubble as well as shrunken bubble surface for diffusion.
image file: c5ra03905c-f10.tif
Fig. 10 Effect of microalgae concentration on the CO2 dissolution and fixation characteristics of a mixed gas bubble in microalgae suspension (Rb,0 = 1.13 mm, initial CO2 volume fraction is 20%): (a) variations of mixed gas bubble radius with time; (b) variations of CO2 dissolution rate with time; (c) variations of CO2 utilization rate with time; (d) variations of CO2 fixation efficiency by photosynthesis with time.

Fig. 10b and c exhibit the variations of CO2 dissolution rate and CO2 utilization rate with time. One can see that the dissolution rate and CO2 utilization rate dramatically increased with increasing OD680 nm of microalgae suspension during early stage of dissolution, however, they dropped quickly as time progressed in the cases with higher OD680 nm of microalgae suspension. As analyzed above, high microalgae concentration not only increases consumption of CO2 in microalgae suspension but also contributes to CO2 transportation. Therefore, quick feeding of CO2 from bubble to microalgae suspension significantly improves both of the dissolution rate and CO2 utilization rate. For the meantime, the quick drop of these two rates can be expected considering the same initial amount of CO2 in the bubble. This also announces the shorter dissolution process for higher microalgae concentration. Fig. 10a–c also indicated that the CO2 utilization rate was controlled by the amount of microalgae cells when OD680 nm of microalgae suspension was less than 1.0. Thus, increasing microalgae concentration can dramatically improve the CO2 utilization rate in microalgae suspension, and then facilitate the dissolution of CO2 in bubble. However, when OD680 nm of microalgae suspension exceeded 1.0, the CO2 utilization rate was dominated by CO2 transportation. Thus, increasing microalgae concentration has little influence on the improvement of CO2 utilization rate and CO2 dissolution rate in microalgae suspension.

Fig. 10d plots the effect of OD680 nm of microalgae suspension on variations of CO2 fixation efficiency by photosynthesis with different bubble residence time. It can be learn that higher CO2 fixation efficiency was achieved in the microalgae suspension with larger OD680 nm due to greater CO2 consumption rate. For the bubble in the microalgae suspension with lower OD680 nm (say, 0.25), the CO2 fixation efficiency gradually increased to reach 100% at about 300 s. For the bubble in the microalgae suspension with lower OD680 nm (say, 1.51), the CO2 fixation efficiency rapidly rose to reach 100% at about 100 s.

5. Conclusion

In the present study, the dissolution process accompanying with bioreaction of a mixed gas bubble in microalgae suspension was investigated experimentally and theoretically. Visualization experiments using promoted bubble grafting method were carried out and the non-equilibrium theory at the gas–liquid interface was adopted to predict the dissolution and transmission process of CO2 gas. The results showed that:

(1) The bubble radius gradually decreased with time and trended towards a constant thereafter. The CO2 concentration near the gas–liquid interface dropped with CO2 diffusion outwards and consumption by microalgae.

(2) The bubble with larger initial CO2 volume fraction had faster decreased radius, higher dissolution rate and CO2 fixation efficiency. Larger initial CO2 volume fraction in bubble was conducive to CO2 dissolution and fixation when initial CO2 volume fraction was less than 10%. While when the initial CO2 volume fraction in bubble was 15% and 20%, slightly photosynthesis inhibition emerged at the beginning of dissolution.

(3) Smaller bubble experienced a faster shrink and had higher CO2 diffusion flux through the gas–liquid interface at the early stage of the dissolution. And smaller bubble had lower dissolution rate but greater CO2 fixation efficiency by photosynthesis.

(4) Higher microalgae concentration accelerated bubble shrink, and the acceleration was impeded when OD680 nm went beyond 1.51. Moreover, increasing OD680 nm of microalgae suspension facilitated bubble dissolution and CO2 fixation especially when OD680 nm of microalgae suspension was less than 1.0.

Nomenclature

CConcentration of CO2 in microalgae suspension, mol L−1
tTime, s
rRadial coordinate, m
RbRadius of mixed gas bubble, m
DDiffusion coefficient, m2 s−1
ρDensity of the mixed gas in the bubble, kg m−3
gGravitational acceleration, m s−2
σSurface tension coefficient, N m−1
RGas constant, J (mol−1 K−1)
TTemperature, K
MMolecular weight of mixed gas, g mol−1
xGas volume fraction (%)
nAmount of CO2, mol
ψCO2 dissolution rate, mol s−1
ζCO2 utilization rate, mol s−1
ηCO2 fixation efficiency by photosynthesis (%)
HHenry's constant of CO2 in microalgae suspension, mol (L−1 Pa−1)
PPressure/partial pressure, Pa
jCO2 diffusion flux, kg (m−2 s−1)
mMass of mixed gas in bubble, kg
BiBiot number
kMass transfer coefficient, m s−1
δThickness of concentration boundary layer in microalgae suspension, m
ΦCO2Volumetric consumption rate in microalgae suspension by biochemical reaction, mol (L−1 s−1)

Subscripts

RbAt the bubble surface
gGas phase
lLiquid phase
0Initial value
tResidence time of bubble is t s
CO2Carbon dioxide
AirAir

Superscripts

*Equilibrium value

Acknowledgements

The authors are grateful for the support by the State Key Program of National Natural Science of China (Grant no. 51136007), National Natural Science Foundation of China (no. 51276205), the Natural Science Foundation of Chongqing, China (Grant no. cstc2013jjB9004) and the Research Project of Chinese Ministry of Education (no. 113053A).

References

  1. F. G. A. Fernández, C. V. González-López, J. M. F. Sevilla and E. M. Grima, Appl. Microbiol. Biotechnol., 2012, 96, 577–586 CrossRef PubMed.
  2. M. C. Grimston, V. Karakoussis, R. Fouquet, R. van der Vorst, P. Pearson and M. Leach, Clim. Pol., 2001, 1, 155–171 CrossRef.
  3. F. Su, C. Lu, W. Cnen, H. Bai and J. F. Hwang, Sci. Total Environ., 2009, 407, 3017–3023 CrossRef CAS PubMed.
  4. Y. F. Diao, X. Y. Zheng, B. S. He, C. H. Chen and X. C. Xu, Energy Convers. Manage., 2004, 45, 2283–2296 CrossRef CAS PubMed.
  5. M. G. Plaza, C. Pevida, A. Arenillas, F. Rubiera and J. J. Pis, Fuel, 2007, 86, 2204–2212 CrossRef CAS PubMed.
  6. K. Skjånes, P. Lindblad and J. Muller, Biomol. Eng., 2007, 24, 405–413 CrossRef PubMed.
  7. C. U. Ugwu, H. Aoyagi and H. Uchiyama, Bioresour. Technol., 2008, 99, 4021–4028 CrossRef CAS PubMed.
  8. Z. Yang, M. Chen, R. Zeng, X. Li and G. Liu, Mod. Chem. Ind., 2008, 28, 15–19 CAS.
  9. A. Prouzi, M. Nosrati, S. A. Shojaosadati and S. Shakhesi, Biochem. Eng. J., 2014, 87, 25–32 CrossRef PubMed.
  10. J. P. P. Bitog, I. B. Lee, H. M. Oh, S. W. Hong, I. H. Seo and K. S. Kwon, Biosystems Eng., 2014, 122, 42–61 CrossRef PubMed.
  11. R. Bannari, A. Bannari, B. Selma and P. Proulx, Chem. Eng. Sci., 2011, 66, 2057–2067 CrossRef CAS PubMed.
  12. R. Bannari, F. Kerdouss, B. Selma, A. Bannari and P. Proulx, Comput. Chem. Eng., 2008, 32, 3224–3237 CrossRef CAS PubMed.
  13. S. Kentish, J. Lee, M. Davidson and M. Ashokkumar, Chem. Eng. Sci., 2006, 61, 7697–7705 CrossRef CAS PubMed.
  14. P. B. Duncan and D. Needham, Langmuir, 2004, 20, 2567–2578 CrossRef CAS.
  15. K. George and P. H. Dahl, J. Acoust. Soc. Am., 2012, 131, 4243–4251 CrossRef PubMed.
  16. P. S. Epstein and M. S. Plesset, J. Chem. Phys., 1950, 18, 1505–1509 CrossRef CAS PubMed.
  17. D. J. Cox and J. L. Thomas, Ultrasound Med. Biol., 2013, 39, 466–474 CrossRef PubMed.
  18. X. Zhang, D. Y. C. Chan, D. Wang and N. Maeda, Langmuir, 2013, 29, 1017–1023 CrossRef CAS PubMed.
  19. A. Katiyar and K. Sarkar, J. Colloid Interface Sci., 2010, 343, 42–47 CrossRef CAS PubMed.
  20. M. M. Lozano, E. Talu and M. L. Longo, J. Geophys. Res.: Oceans, 2007, 112, 12001 CrossRef.
  21. J. J. Kwan and M. A. Borden, Langmuir, 2010, 26, 6542–6548 CrossRef CAS PubMed.
  22. Y. Ma, G. Yu and H. Z. Li, Int. J. Heat Mass Transfer, 2005, 48, 3454–3460 CrossRef CAS PubMed.
  23. X. Gao, C. Zhu, Y. Ma and G. Yu, Chem. Ind. Eng., 2007, 24, 0203–0206 CAS.
  24. H. Tian, L. Jin, Z. Ding and T. Xie, J. Chem. Ind. Eng., 2010, 61, 16–21 Search PubMed.
  25. X. Zhu, J. Xie, Q. Liao, R. Chen and H. Wang, Int. J. Heat Mass Transfer, 2014, 68, 324–331 CrossRef PubMed.
  26. Q. Liao, L. Liu, Y. Wang, R. Chen, X. Zhu, X. Zhao and D. J. Lee, presented in part at the 11th International Conference on Clean Energy, Taiwan, November, 2011 Search PubMed.
  27. L. E. Fridlyand, BioSystems, 1997, 44, 41–57 CrossRef CAS.
  28. A. F. Mazarei and D. C. Sandall, AIChE J., 1980, 26, 154–157 CrossRef CAS.
  29. S. Zhao, Y. Ding, Q. Liao, H. Wang and X. Zhu, J. Eng. Thermophys., 2013, 34, 526–529 CAS.
  30. G. D. Price, Photosynth. Res., 2011, 109, 47–57 CrossRef CAS PubMed.
  31. G. G. Bozzo and B. Colman, Plant, Cell Environ., 2000, 23, 1137–1144 CrossRef CAS.
  32. J. Fan, H. Xu, Y. Luo, M. Wan, J. Huang, W. Wang and Y. Li, Appl. Microbiol. Biotechnol., 2015, 99, 2451–2462 CrossRef CAS PubMed.
  33. E. I. Rabinowitch, Soil Sci., 1951, 72, 482 CrossRef PubMed.
  34. R. F. Sage, Photosynth. Res., 1994, 39, 351–368 CrossRef CAS PubMed.
  35. B. G. Drake, M. A. GonzàlezMeler and S. P. Long, Annu. Rev. Plant Physiol. Plant Mol. Biol., 1997, 48, 609–639 CrossRef CAS PubMed.

Footnote

Electronic supplementary information (ESI) available. See DOI: 10.1039/c5ra03905c

This journal is © The Royal Society of Chemistry 2015
Click here to see how this site uses Cookies. View our privacy policy here.