
Acoustic and elastic properties of silicone oil under high pressure
Xiaoxia Wang,
Chen Chen,
Xiaoli Huang,
Jiayu Wang,
Mingguang Yao,
Kai Wang,
Fengxian Huang,
Bo Han,
Qiang Zhou and
Fangfei Li*
State Key Lab of Superhard Materials, College of Physics, Jilin University, Changchun 130012, China. E-mail: lifangfei@jlu.edu.cn
First published on 20th April 2015
Abstract
Brillouin scattering spectra of three silicone oils with different viscosity, including two polydimethylsiloxanes (PDMS) and one polyphenylmethylsiloxane (PPMS), have been studied under high pressure. The acoustic velocity changes of the three silicone oils were measured under pressure and the velocity of all the samples increases with increasing pressure in a similar way. The morphology of the PDMS changed upon compression, possibly accompanied with structural rearrangement or relaxation, but no morphology variation was observed in the PPMS. Based on velocity measurements, the refractive index, density and bulk modulus of the three silicone oils were obtained and the corresponding pressure dependences were compared with some other micro molecule liquids. Obvious differences were observed and discussed. The results indicate that more complicated interactions between the long-chain molecules in silicone oils might result in the larger bulk modulus when compared with the micro molecular liquids.
I. Introduction
The molecular structure of silicone oil is determined by various organic side chains that connect to polymerized siloxane. Polydimethylsiloxane (PDMS) is a type of silicone oil with a molecular formula of (CH3)3SiO[Si(CH3)2O]n-Si(CH3)3, where n indicates the number of periodic monomer [Si(CH3)2O] units, and its viscosity changes due to the periodic number n variation. In particular PDMS is known for its unusual rheological properties and is widely used in many medical and chemical experiments and industrial applications.1–3 On the other hand, since PDMS has the advantages such as optical transparency, chemical inertia, non-toxicity, nonflammability and low volatility, it has been used as a pressure transmitting medium (PTM) in diamond anvil cell (DAC) for high pressure research.4,5Previously, PDMS has been used as a PTM to minimize the pressure gradient across the sample chamber in X-ray diffraction (XRD), Raman scattering, Brillouin scattering, X-ray absorption and Photoluminescence studies.9–18 Because nonhydrostatic conditions have impact on structural or electronic transitions of matter under high pressure, various PTMs have been investigated and their hydrostaticity is focused on, such as silicone oil.6–8 For example, Piermarini et al. studied the hydrostatic limits in silicone oil as well as other liquid and solid PTMs.19 Ragan et al. reported a preliminary investigation on the hydrostaticity for the Dow Corning 200 silicone fluid.4 In 2004, Shen et al. studied the hydrostaticity and quasi-hydrostaticity of silicone fluid with the viscosity of 1 cst up to 64 GPa.5 They pointed out that this silicone fluid as a pressure medium is as good as the 4![[thin space (1/6-em)]](https://www.rsc.org/images/entities/char_2009.gif) :1 methanol:ethanol mixture below 20 GPa, while it becomes better than the mixture at higher pressure.
:1 methanol:ethanol mixture below 20 GPa, while it becomes better than the mixture at higher pressure.
Though silicone oils are widely used and investigated as PTMs, the intrinsic physical properties and their dependences of pressure have been rarely studied. The density evolution of silicone oil from fluid to solid state under high pressure is unclear, due to the amorphous structure which consists of long chain micro molecules. By conventional X-ray diffraction (XRD) method, it is difficult to determine the density of non-crystal materials. In this work we measured the high pressure acoustic velocities of three silicone oils using Brillouin scattering technique. The refractive index and bulk moduli of these silicone oils are obtained and compared with each other.
II. Experimental methods
The samples used in this study are Baysilone oil M1000 and Baysilone oil M30000 (from Sigma-Aldrich Co.), both of which are PDMS but with different viscosities, when the number of periodic unit [Si(CH3)2O] is different. Silicon oil AP 150 wacker (from Sigma-Aldrich Co.), which is known as a kind of polyphenyl-methylsiloxane (PPMS), has also been investigated.Compared with PDMS, there is one phenyl in the periodic monomer units of PPMS whose chemical formula is (CH3)3SiO-[Si(CH3)(C6H5)O]x-[Si(CH3)2O]ySi(CH3)3. The three silicone oil samples have different viscosities: Silicone oil AP 150 wacker has the lowest viscosity of 150 mPa s, while Baysilone oil M30000 possesses the highest viscosity of 30000 mPa s, which is about 200 times larger than that of the AP 150 wacker. The general physical properties of the three silicone oils at ambient conditions are given in Table 1.
| Chemical formula | Viscosity (mPa s) | Density (g cm−3) | n0 | |
|---|---|---|---|---|
| Silicon oil AP 150 wacker | (CH3)3SiO[Si(CH3)(C6H5)O]x[Si(CH3)2O]ySi(CH3)3 | ∼150 | 1.070 | 1.51 |
| Baysilone oil M1000 | (CH3)3SiO[Si(CH3)2O]n Si(CH3)3 | ∼1000 | 0.970 | 1.405–1.407 |
| Baysilone oil M30000 | (CH3)3SiO[Si(CH3)2O]n Si(CH3)3 | ∼30000 | 0.980 | ∼1.41 |
A modified Merrill–Bassett type four-screw DAC with a large conical opening aperture for Brillouin scattering measurements was used. The culet size of diamond anvils is 400 μm in diameter. A pre-indented T301 stainless steel gasket with a hole drilled in the center of the indentation was used as a sample chamber. For pressure calibration,20 several small ruby chips (annealed) were loaded into the chamber together with silicone oil.
Brillouin scattering experiments are performed both in back (180°) and symmetric platelet (60°) scattering geometries.21 Single-frequency 532 nm laser is used as Brillouin excitation source. The laser comes out of a solid-state diode-pumped, frequency-doubled Nd: Vanadate source (Coherent Company). The Brillouin spectra are collected by 3 + 3 pass tandem Fabry Perot interferometer, which was designed by Sandercock. Ruby fluorescence are recorded through Raman spectroscopy system by using Acton SpectraPro 500i spectrometer with a liquid-nitrogen-cooled CCD detector (Princeton Instruments, 1340*100) and the excitation laser was the same as that used for Brillouin measurements. All the measurements were carried out at room temperature.
III. Results and discussion
1. Brillouin scattering spectra and morphology
When the pressure increases gradually, the morphology changes of Baysilone oil M1000 and Baysilone oil M30000 in DAC were observed and can be monitored by the microscope. The morphology changes start at very low pressure. In contrast, no morphology change was observed in Silicon oil AP 150 wacker, which has been confirmed in our several runs of experiments. Fig. 1 shows the images of Baysilone oil M1000 and Baysilone oil M30000 in DAC at different pressures. Initially the Baysilone oil in the chamber looks homogeneous and transparent in liquid state, and then an arched boundary appears at around 0.27 GPa in Baysilone oil M1000. This arched boundary moves slowly from one side to another side and disappears eventually, leaving the sample chamber homogeneous again. For Baysilone oil M30000, similar morphology change is observed (Fig. 1(e)), i.e., there are two arched boundaries appear at 0.1 GPa, which is lower than the pressure for Baysilone oil M1000. And thereafter, both arcs move towards each other and finally merged in the chamber center, leaving a line mark. This mark sustains up to the highest pressure as shown in Fig. 1(f), while other space keeps homogeneous and transparent. The morphology changes may be related to the structural rearrangement or relaxation, as the Raman spectra of Baysilone oil at similar high pressure show obvious vibrational transitions.22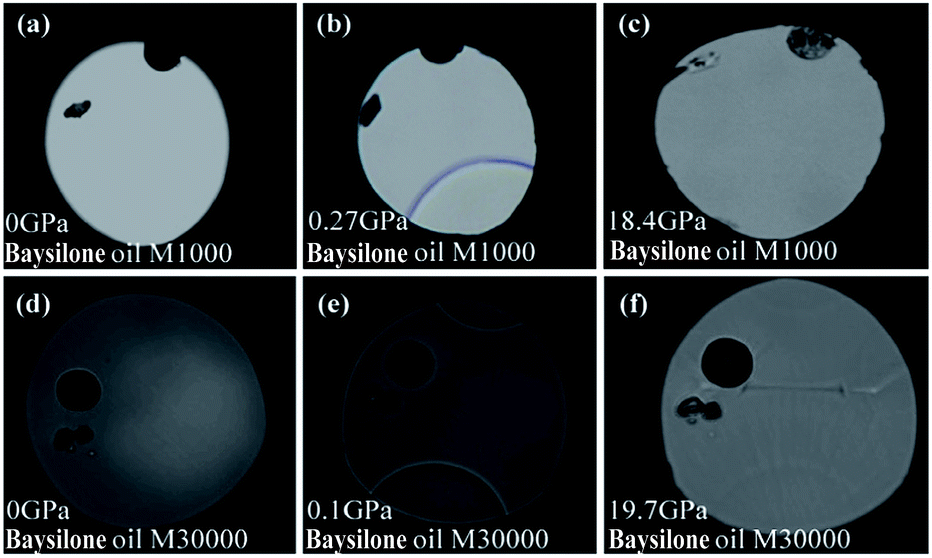 | ||
| Fig. 1 Images of sample chamber for Baysilone oil M1000 and Baysilone oil M30000 at different pressures. The arched boundary appears at 0.27 GPa for Baysilone oil M1000 and at 0.1 GPa for Baysilone oil M30000, respectively. And the texture moves when DAC is tightened by tuning the screw. | ||
Brillouin scattering spectra of three silicone oils were measured up to 20 GPa both in back and platelet scattering geometries. During the morphology changes in Baysilone oil M1000 and Baysilone oil M30000, the pressure change is subtle and no change in Brillouin scattering spectra is detected. Fig. 2 shows typical Brillouin scattering spectra of Silicon oil AP 150 wacker (a) and the Baysilone oil M1000 (b) measured in a symmetric platelet scattering geometry at various pressures. As shown in Fig. 2, in the center is the elastic scattering signal (Rayleigh scattering), and the forward scattering longitudinal signal (VL) and a pair of weak back scattering signals (VB) of sample were detected. Because a small amount of incident light is reflected from the other side of diamond anvil, it looks like an incident light in back scattering geometry measurements. This VB peak position is in accordance with that measured in the back scattering geometry.
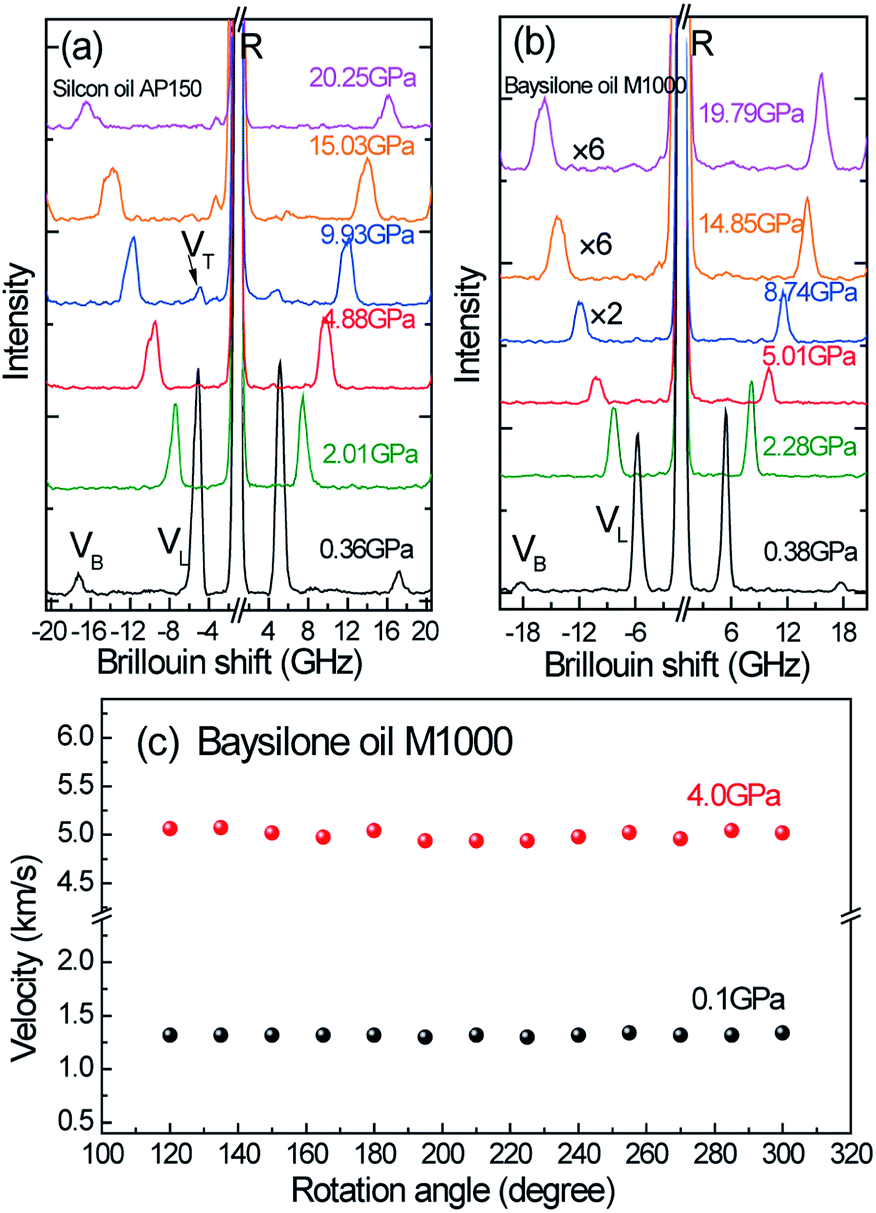 | ||
| Fig. 2 Brillouin spectra of Silicon oil AP 150 wacker (a) and the Baysilone oil M1000 (b) at various pressures measured in a symmetric platelet scattering geometry. R is the Rayleigh peak; VL indicates the longitudinal signal of the sample; VB indicates the weak backscattering signal of the sample. VT is the transverse mode of the sample. More accumulated time is used when pressure higher than 8.74 GPa for Baysilone oil M1000, indicated by ×2 and ×6. (c) The longitudinal velocity variation as a function of rotation angles in Baysilone oil M1000 at different pressures. | ||
As pressure increases, the peak position shifts remarkably. This is a common feature for liquid and soft materials, while the signal of Diamond is hardly moved because of its high hardness. On the other hand, the peak intensity of both VL and VB decreases dramatically, and VB becomes too weak to be detected at high pressure, especially for the Baysilone oil M1000 which possess a larger viscosity so that its scattering intensity decays faster when compared with AP 150 wacker at similar pressure. Thus more accumulation time is required to collect good signal in Fig. 2(b).
In order to explore the possible isotropy of the velocity in silicone oil under high pressure, we measured the Brillouin spectra in different directions. Fig. 2(c) shows the velocity variation as a function of rotation angles in Baysilone oil M1000 before (at 0.1 GPa) and after (at 4.0 GPa) the morphology change. We also checked the isotropy of Baysilone oil M30000 as well as silicon oil AP150 which gives the same result and confirms the isotropic velocity distributions in all the three samples under pressure.
2. Sound velocity and refractive index
The Brillouin frequency shift (in gigahertz) is related to the acoustic velocity V as follows:|
Δω = 2nVsinθ/λ0
| (1) |
In this expression, λ0 is the wavelength of the exciting radiation; n is the refractive index of sample; and 2θ is the scattering angle between incident light and scattered light (here 2θ = 60°). In experiments with DAC, it can be described as
| Δω180 = 2nV180/λ0 | (2) |
| Δω60 = V60/λ0 | (3) |
The pressure dependence of acoustic velocity and refractive index for the three silicone oils were presented in Fig. 3. Based on the analysis of collected experimental data, the acoustic velocity increases with increasing pressure for all the three samples below 17 GPa. The velocity of AP 150 wacker is lower than the other two samples. At around 17 GPa, a sudden increase of the velocity of AP 150 wacker was observed, probably indicating an onset of the internal structural transformation. This is similar to the high pressure behavior of SiO2 glass, in which the anomalous increase of the acoustic velocity is related to the structural densification due to the increase in coordination number.23
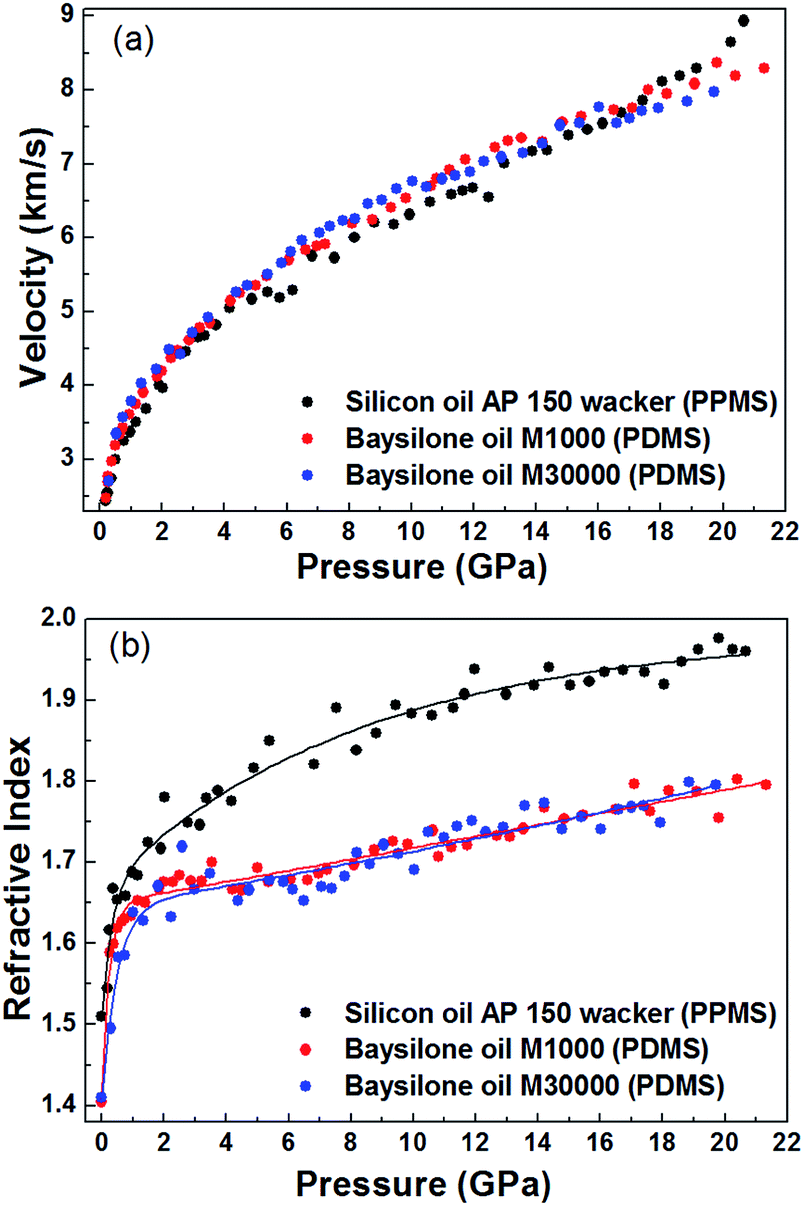 | ||
| Fig. 3 Pressure dependence of acoustic velocities (a) and refractive index (b) for the three silicone oil samples. The solid line among the refractive index is guided for eyes. | ||
The pressure dependence of refractive index of PDMS exhibits distinct behaviors compared with that of PPMS. Nonlinear exponential equation was performed to fit the data and provide a guide line for the increasing tendency. Noticeably, there is a slight sinking at about 4 GPa for both Baysilone oil M1000 and Baysilone oil M30000, and after 8 GPa it increases linearly. The ambient pressure refractive index is around 1.51 for AP 150 wacker and 1.41 for Baysilone oil, respectively. The refractive index of Baysilone oil (PDMS) increases quickly to about 1.65 below 2 GPa. After that it changes slowly to 1.75 with pressure increasing up to 20 GPa, while for the AP 150 wacker (PPMS), it increases from 1.51 to ∼2.0 at 20 GPa, much higher than that of Baysilone oil. The reason why silicon oil AP 150 wacker and Baysilone show different response upon compression is complicated. One main reason might be the replacement of one tetrahedral methyl by planar phenyl in AP 150 wacker silicon oil, leading to the changes in the molecule stacking and tangling state.
3. Density and bulk modulus
As the refractive index and density are related by the Clausius–Mossotti equation,| (n2 − 1)/(n2 + 2) = (4π/3)(ρ/M)/α | (4) |
| (ρ/ρ0)*(α/α0) = [(n2 − 1)(n02 + 2)/[(n2 + 2)(n02 − 1)] | (5) |
If the electronic polarizability under high pressure is known, the density can be calculated. As there are no reports on the electronic polarizability data of these silicone oils, a plot of pressure dependence of ρ(α/α0) is presented in Fig. 4, with the density and refractive index values at referenced room conditions as shown in Table 1. Considering previous high temperature Brillouin scattering studies on other similar amorphous material such as glass materials,24,25 the electronic polarizability is supposed to be almost constant within a wide temperature and pressure region, which means the α/α0 approximately equals to 1, and therefore the density of silicone oil can be deduced. Different behavior of density evolution between PPMS and PDMS under pressure mainly comes from their distinct molecular structures.
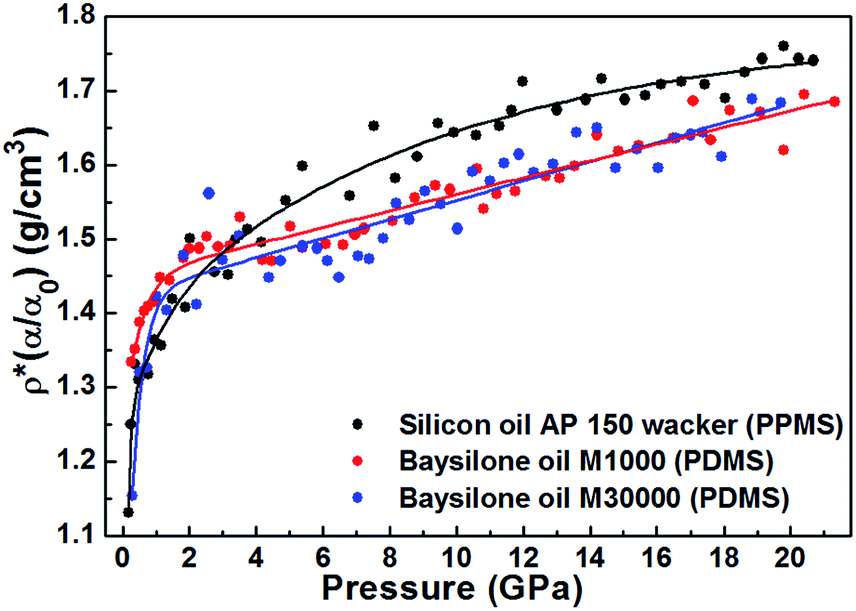 | ||
| Fig. 4 Pressure dependence of density for three silicone oil samples. The solid line among the experimental points is guided for eyes. | ||
As we know, the bulk modulus B derives from the density and velocity by B = ρV2, which gives bulk moduli for the three silicone oils (Fig. 5). Obviously, under pressure the bulk moduli basically incenses linearly above 2 GPa. Because most liquid will transform into solid state at above 4 GPa, we select a few typical micro molecular liquid, such as water (H2O), ammonia (NH3), methane (CH4) and a mixture of water and ammonia with molar ratio 2:1 (H2O–NH3),21,26–28 and compare their high pressure behaviors with the silicone oils at low pressure range. As seen from the insert (a) of Fig. 5, the bulk moduli of methane is lower than those of other liquids and has minimum dB/dP coefficient, suggesting a relatively large volume compressibility. This can be understood by the fact that methane molecule possesses a filled shell structure, the main interaction force in liquid methane is van der Waals force which is much weaker than others such as covalent, ionic or metallic interactions. While for water, ammonia and their mixture, hydrogen bonds in the samples may decrease their compressibility under pressure and thus their bulk moduli is larger than that of methane. The bulk moduli of silicon oils in this study increase quickly within 1 GPa and the slope slows down afterwards. Such behavior is related to the vitrification process of silicon oils, that is, the fluid mobility becomes weak and the vitreous state becomes dominant after 2 GPa. On the other hand, the larger bulk modulus of silicon oil than those of micro molecular liquids reflects more complicated interactions between the long chain molecules in PDMS and PPMS.
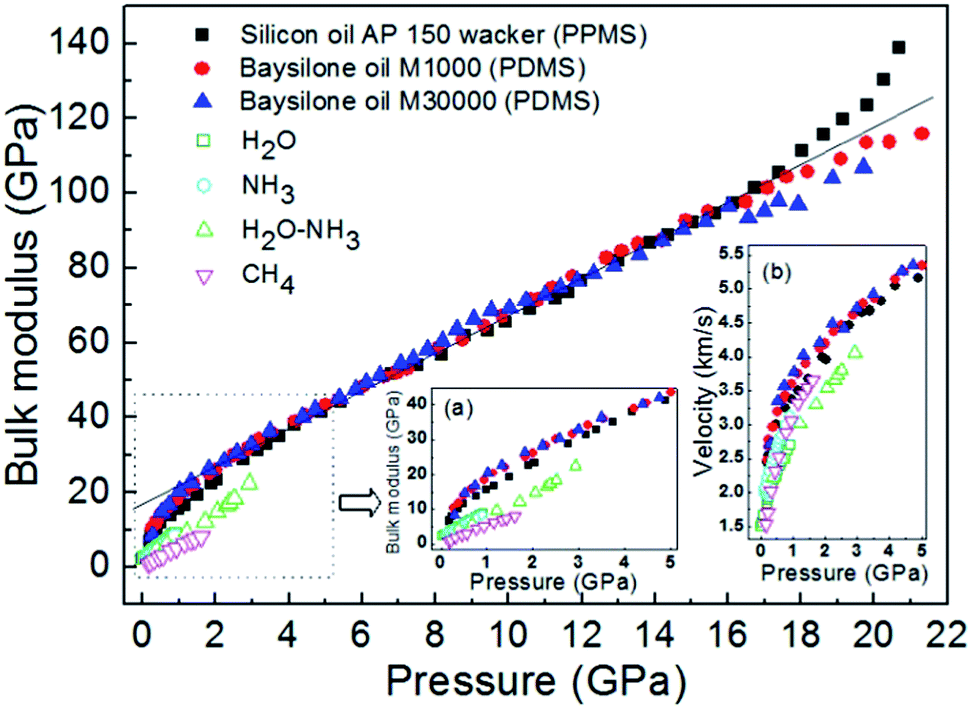 | ||
| Fig. 5 Pressure dependence of bulk moduli for the three silicone oil samples (solid symbols), comparison between these silicone oil and micro molecular liquid is presented (empty symbols). The solid line among the experimental points is guide for eyes. Insert (a) zoom-up presentations corresponding to the dotted rectangle; insert (b) comparison of the velocities between these silicone oils and micro molecular liquids. | ||
IV. Conclusion
In this work, Brillouin scattering spectra of three types of silicone oils have been studied both in platelet and back geometries under high pressure and room temperature. The pressure dependence of acoustic velocity, refractive index and density are obtained. We found distinct behaviors for PDMS and PPMS due to their different molecular configurations. The bulk modulus of the three silicone oils are further calculated and compared with other liquid micro molecule systems. The results show that the interactions between the long-chain molecules of silicone oil are more complicated compared with the other micro molecular liquids, which might be responsible for the larger bulk modulus of silicone oils.Acknowledgements
This work was supported partially by the National Natural Science Foundation of China (Grant nos 11474127, 11004074, 10574054 and 10976011), the specialized Research Fund for the Doctoral Program of Higher Education (SRFDP; Grant no. 20100061120093), and the National Basic Research Program of China (Grant no. 2011CB808200).References
- S. Grilli, V. Vespini and P. Ferraro, Langmuir, 2008, 24, 13262–13265 CrossRef CAS PubMed.
- J. Martín-Gil, F. J. Martín-Gil, A. I. De Andrés Santos, M. C. Ramos-Sánchez, M. T. Barrio-Arredondo and N. Chebib-Abuchala, J. Anal. Appl. Pyrolysis, 1997, 42, 151–158 CrossRef.
- R. H. Doremus, J. Appl. Phys., 2002, 92, 7619–7629 CrossRef CAS PubMed.
- D. D. Ragan, D. R. Clarke and D. Schiferl, Rev. Sci. Instrum., 1996, 67, 494–496 CrossRef CAS PubMed.
- Y. Shen, R. S. Kumar, M. Pravica and M. F. Nicol, Rev. Sci. Instrum., 2004, 75, 4450–4454 CrossRef CAS PubMed.
- Z. W. Wang, J. Phys. Chem. B, 2004, 108, 18192–18194 CrossRef CAS.
- Y. Lin, Y. Yang, H. W. Ma, Y. Cui and W. L. Mao, J. Phys. Chem. C, 2011, 115, 9844–9849 CAS.
- D. Liu, W. W. Lei, Z. X. Liu and Y. Lee, J. Phys. Chem. C, 2010, 114, 18819–18824 CAS.
- S. Heathman, R. G. Haire, T. L. Bihan, A. Lindbaum, K. Litfin, Y. Meresse and H. Libotte, Phys. Rev. Lett., 2000, 85, 2961–2964 CrossRef CAS.
- T. L. Bihan, A. Bombardi, M. Idiri, S. Heathman and A. Lindbaum, J. Phys.: Condens. Matter, 2000, 14, 10595–10600 CrossRef.
- S. Desgreniers, L. Beaulieu and I. Lepage, Phys. Rev. B: Condens. Matter Mater. Phys., 2000, 61, 8726–8733 CrossRef CAS.
- J. Haines, J. M. Leger, A. S. Pereira, D. Hausermann and M. Hanfland, Phys. Rev. B: Condens. Matter Mater. Phys., 1999, 59, 13650–13656 CrossRef CAS.
- L. Havela, M. Divis, V. Sechovsky, A. V. Andreev, F. Honda, G. Oomi, Y. Meresse and S. Heathman, J. Alloys Compd., 2001, 322, 7–13 CrossRef CAS.
- R. Moret, P. Launois, T. Wagberg and B. Sundqvist, Eur. Phys. J. B, 2000, 15, 253–263 CAS.
- T. Hatano, R. Akimoto, M. Kobayashi, T. Suzuki and S. Endo, J. Phys. Chem. Solids, 1995, 56, 531–534 CrossRef CAS.
- S. Speziale and T. S. Duffy, Phys. Chem. Miner., 2004, 109, B12202 Search PubMed.
- J. Badro, P. Gillet, P. F. McMillan, A. Polian and J. P. Itie, Europhys. Lett., 1997, 40, 533–538 CrossRef CAS.
- D. Patel, J. Chen, I. L. Spain, J. H. Quigley, M. J. Hafich and G. Y. Robinson, Phys. Rev. B: Condens. Matter Mater. Phys., 1988, 38, 13206–13209 CrossRef CAS.
- G. J. Piermarini, S. Block and J. D. Barnett, J. Appl. Phys., 1973, 44, 5377–5382 CrossRef CAS PubMed.
- H. K. Mao, J. Xu and P. M. Bell, J. Geophys. Res., 1986, 91, 4673–4676 CrossRef CAS.
- F. F. Li, Q. L. Cui, Z. He, T. Cui, J. Zhang, Q. Zhou and G. T. Zou, J. Chem. Phys., 2005, 123, 174511 CrossRef PubMed.
- X. X. Wang, Z. H. Li, C. Chen, K. Wang, B. Han, Q. Zhou and F. F. Li, Chem. J. Chin. Univ., 2014, 35, 2384–2389 CAS.
- M. Murakami and J. Bass, Phys. Rev. Lett., 2010, 104, 025504 CrossRef.
- J. Xu and M. H. Manghnani, Phys. Rev. B: Condens. Matter Mater. Phys., 1992, 45, 640–645 CrossRef CAS.
- J. Xu, M. H. Manghnani and P. Richet, Phys. Rev. B: Condens. Matter Mater. Phys., 1992, 46, 9213–9215 CrossRef CAS.
- F. F. Li, M. Li, Q. L. Cui, T. Cui, Z. He, Q. Zhou and G. T. Zou, J. Chem. Phys., 2009, 131, 134502 CrossRef PubMed.
- M. Li, F. F. Li, W. Gao, C. L. Ma, L. Y. Huang, Q. Zhou and Q. L. Cui, J. Chem. Phys., 2010, 133, 044503 CrossRef PubMed.
- C. L. Ma, X. X. Wu, F. X. Huang, Q. Zhou, F. F. Li and Q. L. Cui, J. Chem. Phys., 2012, 137, 104504 CrossRef PubMed.
| This journal is © The Royal Society of Chemistry 2015 |