Effect of azo dye on ammonium oxidation process and ammonia-oxidizing bacteria (AOB) in soil

Samavia Batoola, Azeem Khalidb, Khan Chowdhury Ahmed Jalalc, Maliha Sarfrazd, Khaled S. Balkhairef and Muhammad Aqeel Ashraf*a
aDepartment of Geology, Faculty of Science, University of Malaya, 50603 Kuala Lumpur, Malaysia. E-mail: aqeelashraf@um.edu.my
bDepartment of Environmental Sciences, Faculty of Forestry, Range Management & Wild Life, PMAS-Arid Agriculture University, Rawalpindi, Pakistan
cKulliyyah of Science, International Islamic University Malaysia 25200 Kuantan, Pahang, Malaysia
dInstitute of Pharmacy, Physiology and Pharmacology, Faculty of Veterinary Sciences, University of Agriculture, 38040 Faisalabad, Pakistan
eCenter of Excellence in Desalination Technology, King Abdulaziz University, P.O. Box 80200, Jeddah 21589, Saudi Arabia
fDepartment of Hydrology and Water Resources Management, Faculty of Meteorology, Environment and Arid Land Agriculture, King Abdulaziz University, PO Box 80208, Jeddah 21589, Saudi Arabia

Received 3rd March 2015 , Accepted 8th April 2015

First published on 9th April 2015


Abstract

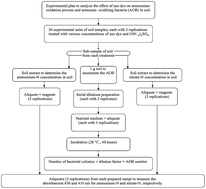
Ammonia-oxidizing bacteria (AOB) play a key role in the production of nitrate-N (NO3-N) in terrestrial ecosystems. A study was planned with the aim of assessing the effect of azo dyes released by textile and dyestuff industries on the NH4+-N oxidation process in soil. The data was analyzed statistically using a two factorial completely randomized design (CRD). The results of the study demonstrated that higher doses of reactive black 5 (RB5) significantly suppressed the NH4+-N oxidation process throughout incubation. Average percent inhibition rates (%) were in the following order: coarse > fine > medium soil. Overall average percent inhibition rates (%) of nitrification in soils exposed to 30 mg-N kg−1 soil ammonium sulfate [(NH4)2SO4] were 46–53% higher than those from 90 mg-N kg−1 soil. This may be attributed to (NH4)2SO4 that acts as a substrate for the proliferation of AOB. NO3-N concentration was strongly negatively correlated (r = −0.86) with various amounts of RB5, whereas a strong positive response was observed for the inhibition rate (r = 0.92). A considerable decrease in AOB population (up to 92.58%) was detected for >200 mg kg−1 soil plus N fertilizer, which differed with soil type. This study could be helpful to investigate the effect of contaminants on biochemical processes occurring in soil. Furthermore, the inhibitory effect of azo dye on the NH4+-N oxidation process suggests that critical concentrations of organic dyes may be used as an inhibitor to release NO3-N in soil at a slow rate in order to further reduce NO3-N contamination in terrestrial and aquatic ecosystems and to allow less frequent application of ammonium fertilizer in soil as well.


Introduction

Azo dyes are widely used to dye various materials such as leather, plastics, textiles, food, paper and cosmetics. Overall, production of azo dyes in the world is estimated to be one million tons annually. The use of azo dyes in the modern world represents a serious problem worldwide.1,2 Azo dyes are synthetic compounds.1 These compounds are characterized by aromatic moieties linked together with azo groups (–N[double bond, length as m-dash]N–).3 These azo dyes are water-soluble dyes generally enter the environment through wastewater discharges4 and negatively affect biochemical processes in soil.5 Affected biochemical processes in soil can be used as bioindicators of anthropogenic stress caused by organic dyes.6 A highly ecologically important function negatively affected by these pollutants is autotrophic NH4+-N oxidati.7 Toxicity of dyes to microorganisms is also an important consideration in determining their environmental impacts.8

NH4+-N oxidation is the first and rate-limiting step in nitrification process, in which both ammonia-oxidizing bacteria (AOB) and ammonia-oxidizing archaea (AOA) oxidize NH4+-N to NO2-N.9 NH4+-N oxidation rate is inhibited by toxicants because they inactivate the ammonia monooxygenase enzyme or hydroxylamine oxidoreductase which mediates the oxidation of NH4+-N to NO3-N by competitive inhibition.5 Nitrification, the biological oxidation of NH4+-N to NO3-N, is an increasingly important removal mechanism used in a number of treatment processes to control NH4+-N pollution. This process occurs in terrestrial, aquatic and sedimentary soils across the globe.10

Soil is a biologically balanced system, and any drastic change in its environment can change microbial populations and soil enzymatic activities involved in various nutrient cycles, which have an adverse effect on soil nutrients.6 There are various forms of N in the soil, including inorganic and organic nitrogen, which are available as a N source for plant growth.11–14 Rate of formation of NH4+-N and NO3-N by the process of nitrogen mineralization and nitrification in the soil determines the availability of nitrogen to plants.15 Nitrogen-use efficiency of plants may be restricted by organic dye pollutants.6 However, in a study conducted by ref. 6 it was reported that organic compounds had negative effect on nitrification process in soil. It was investigated by ref. 16 that 3,3-diaminobenzidine negatively affected the nitrifying bacterial population.

Recently, several studies have indicated that addition of organic pollutants inhibited the oxidation of NH4+-N by modifying the microbial activity and reduced nitrification rate in soil.17–19 However, very little is known about the effect of azo dyes on NH4+-N oxidation process. So, there is a dire need to carry out research in this field. Keeping in view the above discussion, present study was conducted with the following objectives: to assess the effect of azo dyes on NH4+-N oxidation process in soil and to determine the effect of azo dyes on NH4+-N oxidizing soil bacteria.

Materials and method

Reagents

The experiment was performed with Reactive Black 5 (RB 5) azo dye, which is commonly used in textile industry. (NH4)2SO4 was used as a N source. NH4+-N and NO3-N were extracted from soil by mixing with 2 M KCl solution and 0.5 M K2SO4 solution, respectively. Serial dilutions were prepared by using distilled water.

Collection of soil samples

Three types of soils (medium, fine and coarse) were used. Medium soil was taken from the top soil layer (0–15 cm depth) using corer from agricultural field of Department of Environmental Sciences, PMAS Arid Agriculture University Rawalpindi, coarse soil from agricultural field of Attok and fine soil from agricultural field of Chakwal. A portion of soil was air-dried and analyzed for physical and chemical characteristics which are presented in Table 1.
Table 1 General properties of medium, fine, coarse soil
Properties Medium soil Fine soil Coarse soil
pH 7.42 ± 0.37 7.42 ± 0.13 7.45 ± 0.13
Electrical conductivity (EC) (μs cm−1) 720 ± 2.12 630 ± 7.07 520 ± 3.54
Soil moisture (%) 35 ± 2.83 40 ± 1.41 33 ± 2.83
Texture Silt loam Clay loam Sandy loam
Organic C (%) 0.31 ± 0.06 1.39 ± 0.03 0.33 ± 0.01
NH4+-N mg kg−1 soil 3.38 ± 0.01 6.02 ± 0.02 4.57 ± 0.02
NO3-N mg kg−1 soil 13 ± 0.07 11 ± 0.02 8 ± 0.06
Total N mg kg−1 soil 0.265 ± 0.006 0.335 ± 0.006 0.285 ± 0.008
Sand 28% 5% 78%
Silt 53% 19% 6%
Clay 19% 76% 16%


Incubation of soil samples

Different azo dye concentrations (0, 100, 200, 400, 800 and 1600 mg kg−1 soil) were added using 150 g soil per plastic beaker. (NH4)2SO4 of various concentrations (30 and 90 mg-N kg−1 soil) were supplied as a N source. Azo dye and (NH4)2SO4 were mixed well in the soil. Distilled water was used to maintain the soil moisture content near field capacity (60%) up to 28 days. Plastic beakers were covered with aluminum foil but remained open at top. The beakers were placed at 28 ± 2 °C in dark for 0, 7, 14, 21 and 28 days. Control treatment without azo dye (receiving only N fertilizer) were incubated under similar conditions to account for base-level NH4+-N and NO3-N concentrations soil. The experiment was performed with completely randomized design having 36 experimental units from the initiation of experiment. Each treatment was performed in triplicate. Sub-samples of soil were taken at different intervals for NH4+-N, NO3-N (day 0, 7, 14, 21, 28) and AOB number (day 0, 14 and 28) determination. A flow chart is drawn to represent the experimental plan (Fig. 1).
image file: c5ra03768a-f1.tif
Fig. 1 Flow chart representing the experimental plan to analyze the effect of azo dye on ammonium oxidation process and ammonia-oxidizing bacteria (AOB) in soil.

Laboratory analysis of soil samples

Determination of NH4+-N and NO3-N concentration. Soil was mixed well. Soil samples (equivalent to 3 and 12 gram dry weight) were taken and 2 M KCl solution and 0.5 M K2SO4 solution were added, respectively. Mixtures were shaked on mechanical shaker for 1 hour at 250 rpm to obtain soil extract for NH4+-N and NO3-N analysis. The soil suspensions were filtered through Whatman (no. 42) filter papers, and analyzed for NH4+-N by the indo phenol blue method20 and NO3-N by the salicylic acid method21 using Shimadzu UV 1800 UV-Vis spectrophotometer at wavelength 636 nm and 410 nm, respectively.22
Determination of inhibition rate of nitrification. Inhibition rate of soil nitrification was determined by (CT)/C × 100 where T is NO3-N concentration in soil sample polluted with azo dye along with N fertilizer and C is NO3-N concentration in controlled sample (only N fertilizer).23
Enumeration of nitrifying soil bacteria. Ammonia-oxidizing soil bacteria were enumerated using the dilution plate count technique where distilled water for serial dilutions was used. Ammonium sulfate medium comprised of the following (g l−1): (NH4)2SO4 (2.5), Na2HPO4 (13.5), KH2PO4 (0.7), MgSO4·7H2O (0.1), NaHCO3 (0.5), FeCl3·6H2O (0.0014), CaCl2·6H2O (0.018), yeast (0.1) and agar (1.5) was used as a nutrient medium for AOB growth.16 The pH was adjusted to 8.0. The test tubes (10-fold dilutions and each dilution was performed in triplicate) were placed in incubator at 28 °C for at least 48 hours. The number of bacterial colonies that grew on each plate was counted. Using multiplication of number of bacterial colonies with dilution factor, number of soil bacteria in original soil samples was determined.24
Statistical analysis. Results were analyzed statistically using two factorial randomized design. Anova was applied in order to check whether the data was normally distributed or not at P < 0.05. Means were compared applying least significant difference (LSD) test using Statistix 8.1 software. Standard deviation was calculated using Microsoft Excel.

Results and discussion

NO3-N concentration in medium, fine and coarse soil was found in range of 12.92–69.96, 11.01–47.30 and 8.04–31.52 mg kg−1 soil, respectively. NH4+-N concentration ranging from 17.79–92.17, 22.66–94.41 and 24.98–93.53 mg kg−1 soil was observed in medium, fine and coarse soil, respectively. Detected range of inhibition rate of nitrification % in medium, fine and coarse soil was 0.07–35.83, 0.16–40.01 and 0.45–54.10%, respectively.25

Ammonium oxidation in soil

The effects of various concentration of azo dye on NH4+-N oxidation process are presented in Fig. 2–7. Generally, there was decrease in NH4+-N oxidation rate with increasing concentration of pollutants. Fig. 2 reveals that in medium soil treated with 30 mg-N kg−1 soil (NH4)2SO4, NH4+-N oxidation rate decreased with the increasing azo dye concentration. Oxidized NH4+-N was 17.7 mg kg−1 soil in control (soil receiving only 30 mg-N kg−1 soil (NH4)2SO4) causing NO3-N increase by 10.0 mg kg−1 soil after 28 days. Almost similar trend was observed with low level of RB5 (100 and 200 mg kg−1 soil) and did not differ significantly from control values during the overall incubation period. On the other hand, in the case of higher RB5 doses (800 and 1600 mg kg−1 soil) only 3.05 and 2.02 mg kg−1 soil NH4+-N oxidized, respectively and it was significantly higher (63.01 and 68.41%, respectively) than control values, resulting in 22.44 and 22.48% less NO3-N, respectively at the end of incubation period. With 400 mg kg−1 soil RB5 along with 30 mg-N kg−1 soil, NO3-N concentration increased significantly by 29.48% after a lag of 21 days and thereafter increased abruptly by 11.90% up to 28 days.25 NO3-N concentration raised by 5.82 mg kg−1 soil after 28 days of incubation and it was 18.69% lower than NO3-N in control. Conversely, NH4+-N concentration was 36.03% higher than control values and overall its concentration decreased by 24.30% in this treatment after 28 days.26
image file: c5ra03768a-f2.tif
Fig. 2 Variation in NH4+-N and NO3-N concentration in medium soil containing various concentration of Reactive Black 5 (0–1600 mg kg−1 soil) and 30 mg-N kg−1 soil (NH4)2SO4.

image file: c5ra03768a-f3.tif
Fig. 3 Variations of NH4+-N and NO3-N concentration in fine soil containing various concentration of Reactive Black 5 (0–1600 mg kg−1 soil) and 30 mg-N kg−1 soil (NH4)2SO4.

image file: c5ra03768a-f4.tif
Fig. 4 Variations of NH4+-N and NO3-N concentration in coarse soil containing various concentration of Reactive Black 5 (0–1600 mg kg−1 soil) and 30 mg-N kg−1 soil (NH4)2SO4.

image file: c5ra03768a-f5.tif
Fig. 5 Variations of NH4+-N and NO3-N concentration in medium soil containing various concentration of Reactive Black 5 (0–1600 mg kg−1 soil) and 90 mg-N kg−1 soil (NH4)2SO4.

image file: c5ra03768a-f6.tif
Fig. 6 Variations of NH4+-N and NO3-N concentration in fine soil containing various concentration of Reactive Black 5 (0–1600 mg kg−1 soil) and 90 mg-N kg−1 soil (NH4)2SO4.

image file: c5ra03768a-f7.tif
Fig. 7 Variations of NH4+-N and NO3-N concentration in coarse soil containing various concentration of Reactive Black 5 (0–1600 mg kg−1 soil) and 90 mg-N kg−1 soil (NH4)2SO4.

Nearly similar trend for NH4+-N oxidation was observed in fine soil as in medium soil (Fig. 3). However, rate of NH4+-N oxidation was found lower than that in medium soil. In the soil containing 400, 800 and 1600 mg kg−1 soil RB5 plus 30 mg-N kg−1 soil (NH4)2SO4, NH4+-N concentration decreased by 5.87, 2.42 and 1.87 mg kg−1 soil, respectively till the end of incubation period however, it was significantly higher (24.71, 39.63 and 42.50%, respectively) than control values (11.47 mg kg−1 soil) after whole incubation period. Similarly, increase in NO3-N concentration was 2.33 and 1.76 mg kg−1 soil, respectively (>400 mg kg−1 soil) at the end of incubation period. On the other hand, 5.73 mg kg−1 soil increase was observed over 400 mg kg−1 soil RB5. Maximum increase was reported at 100 and 200 mg kg−1 soil RB5 (30 mg-N kg−1 soil) which was not significantly lower (1.74 and 3.52%) than control values (increased by 10.22 mg kg−1 soil).

It is evident from Fig. 4 that in control (only 30 mg-N kg−1 soil (NH4)2SO4) the consumed amount of NH4+-N was 8.16 mg kg−1 soil after the whole incubation period. Minimum NH4+-N oxidation rate was observed in the case of coarse soil containing 800 and 1600 mg kg−1 soil RB5 plus 30 mg-N kg−1 soil (NH4)2SO4 (1.83 and 1.17 mg-N kg−1 soil, respectively) whereas, at 400 mg kg−1 soil RB5 over 30 mg-N kg−1 soil (NH4)2SO4, observed decrease was 3.64 mg-N kg−1 soil after whole incubation time. Hence, in aforementioned treatments NO3-N concentrations differed by 5.49, 9.25 and 10.32 mg kg−1 soil than that in control on 28th day.

The maximum ammonium oxidation rate (58.04 mg kg−1 soil) was recorded in medium soil receiving 90 mg-N kg−1 soil N fertilizer where NO3-N level increased by 56.92 mg kg−1 soil (Fig. 5). In medium soil treated with RB5 (800, 1600 mg kg−1 soil and 90 mg-N kg−1 soil N fertilizer), NH4+-N concentration decreased sharply by 41.06 and 39.07 mg kg−1 soil, respectively however, it was markedly higher (49.87 and 55.70%, respectively) than that in control (only N fertilizer) after the whole incubation period. On the contrary, rise in NO3-N level was 40.89 and 38.96 mg kg−1 soil respectively, till the end of incubation period. While, decreased NH4+-N concentration over 400 mg kg−1 soil RB5 plus 90 mg kg−1 soil N fertilizer was 51.56 mg kg−1 soil on 28th day which was 18.66% lower than that in control. In contrast, there was increase in NO3-N level up to 51.43 mg kg−1 soil.

It is reflected by Fig. 6 that in fine soil, contaminated with higher doses of RB5 (400, 800, 1600 mg kg−1 soil) plus 90 mg-N kg−1 soil N fertilizer, overall NH4+-N consumption was 31.06, 23.88 and 21.87 mg kg−1 soil, respectively and significantly higher (8.95, 21.41 and 24.80%) than that in control (only 90 mg-N kg−1 soil N fertilizer) where oxidized NH4+-N concentration was 36.27 mg kg−1 soil on 28th day of incubation period. On the contrary, in control (90 mg-N kg−1 soil, alone) and less polluted fine soil, NO3-N concentrations were closely matched throughout the incubation time and level of NO3-N increased by 36.17 mg kg−1 soil after the whole incubation time. While, in highly polluted fine soil (>200 mg kg−1 soil RB5 and 90 mg−1 N kg−1 soil), NO3-N production raised by 30.97, 27.75 and 21.78 mg kg−1 soil, respectively.

In coarse soil, at higher RB5 doses (800, 1600 mg kg−1 soil) the concentration of oxidized NH4+-N was almost two times lower than that of control (90 mg-N kg−1 soil alone) and lower RB5 dose treatments (100, 200 mg kg−1 soil) (Fig. 7). Similar results were obtained for NO3-N. Next to it, NH4+-N and NO3-N concentration differed by 15.72 and 35% from control values where coarse soil was medium polluted (400 mg kg−1 soil RB5).

In the present study, very higher RB5 doses significantly suppressed the NH4+-N oxidation process throughout the incubation period in all types of soil. This premise is supported by ref. 23 who demonstrated that in soil amended with 30 mg-N kg−1 soil and CaC2, NH4+-N concentration was 12.84 mg kg−1 soil higher than that of nonamended soil.27 Moreover, the observed suppressive effect of azo dye acid black 1 on NH4+-N oxidation is also supported by ref. 24. On the contrary, in case of 400 mg kg−1 soil RB5, NH4+-N oxidation process went down till 21st day of incubation and thereafter a sharp increase was observed up to the end of incubation. It may be attributed to increase in population size of nitrifying soil bacteria acclimatizing to that polluted environment along with changes occurring in their genetic make up and enzymatic activity as well.28 Similarly, a researcher has illustrated that in soil treated with 16 and 32 mg kg−1 soil SA, inhibitory effect was completely diminished at the 50th day of incubation.6 Inhibition rate of NH4+-N oxidation decreased with increasing concentration of (NH4)2SO4. It may be due to increased growth rate of AOB in surplus amount of fertilizer. On the other hand, it was reported by ref. 29 that NH4+-N concentration of 0.05 to 0.5 g N-NH4+ L−1 exhibited suppressing effects on NH4+-N oxidizing bacterial organisms and conversion of NH4+-N to NO3-N reduced by 15–37%.

Nearly similar trend was observed in all types of soil. However, rate of NH4+-N oxidation was found in the following order; medium > fine > coarse soil. It is attributed to differences in soil texture of medium (silt loam), fine (clay soil) and coarse soil (sandy loam soil), air spaces which are very less in fine soil than that of coarse soil and organic C (%) found higher in fine soil than that of coarse soil.30

Furthermore, effectiveness of RB5 on AOB and nitrification process decreased with increasing concentration of (NH4)2SO4. It may be due to stimulated growth of nitrifying soil bacteria in the presence of (NH4)2SO4 that acts as a substrate for them resulting in higher production of NO2-N and then to NO3-N. In another study it was investigated by ref. 26 that nitrification process was increased and AOB population was shifted by long term (16 years) of nitrogenous application.31

As the concentration of NO3-N in soil is directly interrelated with NH4+-N oxidation process in soil therefore, in the present study, NO3-N concentration was used to analyse the NH4+-N oxidation process in soil as well. Higher and medium concentrations of RB5 showed higher degree of reduction of NO3-N production during whole incubation days because NH4+-N oxidation process decreased. A supporting effect of nitro group attached with aromatic ring of aminoaromatic compounds has also been reported by ref. 22. Nitro group on aromatic ring of Reactive Black 5 is responsible to increase the inhibitory effect on nitrification process in soil.6 Also demonstrated that nitrification process was strongly negatively correlated (r = −0.71) to SA doses in soil.

In all treatments (medium, fine, coarse), a positive correlation (R2 = 0.84, R2 = 0.86, R2 = 0.73, respectively) was found between various concentration of RB5 doses and NH4+-N concentration (Fig. 8). On the contrary, a strong negative response (R2 = −0.85, R2 = −0.96, R2 = −0.78, respectively) was observed between various levels of RB5 doses and NO3-N concentration (Fig. 9).


image file: c5ra03768a-f8.tif
Fig. 8 Correlation (R) between NH4+-N concentration and RB5 concentration in fine, coarse and medium soil.

image file: c5ra03768a-f9.tif
Fig. 9 Correlation (R) between NO3-N concentration and RB5 concentration in fine, coarse and medium soil.

Inhibition rate of nitrification (%)

Higher concentration of RB5 (>200 mg kg−1 soil) significantly accelerated the inhibition rate of nitrification (%) in all types of soil (Table 2). These were highly significantly different from each other. It was found to be maximum in coarse soil contaminated with 1600 mg kg−1 soil RB5 coupled with 30 mg-N kg−1 soil (NH4)2SO4 where it was double to that of medium soil treated with 1600 mg kg−1 soil RB5 and 90 mg-N kg−1 soil (NH4)2SO4. No apparent inhibition of nitrification was observed in all less contaminated treatments (<400 mg kg−1 soil).
Table 2 Inhibition rate of nitrification (%) in medium, fine, coarse soil after 28 days of RB5 azo dye and (NH4)2SO4 application (average of three repeats)a
RB5 azo dye-(NH4)2SO4 (mg-N kg−1 soil) Inhibition rate of nitrification (%) in medium Inhibition rate of nitrification (%) in fine soil Inhibition rate of nitrification (%) in coarse soil
a Values sharing same letter do not differ significantly at p = 0.05 according to least significant difference test.
100–30 1.82t 1.74t 2.14t
100–90 0.95u 0.96u 3.65s
200–30 3.12s 3.53s 3.16s
200–90 1.76t 1.88t 4.46r
400–30 18.80n 21.15l 26.68i
400–90 7.79q 11.21p 20.13m
800–30 32.05g 37.13d 44.95b
800–90 22.86k 17.89o 32.98f
1600–30 35.82e 39.99c 50.15a
1600–90 25.68j 30.51h 35.73e


Countable ammonia oxidizing soil bacteria

A similar trend was observed in Fig. 10–15 where AOB population decreased with increasing concentration of azo dye. Fig. 10 depicts that in all treatments of medium soil, AOB number initially ranged from 5.94 to 5.98 log cfu g−1 soil. At very higher RB5 doses (800, 1600 mg kg−1 soil) plus 30 mg-N kg−1 soil N fertilizer, average inhibition of AOB number was 74.49, 82.55% respectively which was almost double (38.39%) to that of 400 mg kg−1 soil. However at lower RB5 doses (<400 mg kg−1 soil) did not differ significantly than control (30 mg-N kg−1 soil alone) values throughout the whole incubation period. Initially, AOB number ranging from 6.09 to 6.14 log cfu g−1 soil was found in medium soil treated with 90 mg-N kg−1 soil N fertilizer. There was 15.81, 65.57, 78.51% decrease in AOB number at higher doses (>200 mg kg−1 soil RB5), respectively and average percent inhibition of AOB number was remarkable i.e. 42.44, 73.27 and 80.31%, respectively (Fig. 11).
image file: c5ra03768a-f10.tif
Fig. 10 Variations of ammonia oxidizing bacterial number in medium soil containing various concentration of Reactive Black 5 (0–1600 mg kg−1 soil) and 30 mg-N kg−1 soil (NH4)2SO4.

image file: c5ra03768a-f11.tif
Fig. 11 Variations of ammonia oxidizing bacterial number in medium soil containing various concentration of Reactive Black 5 (0–1600 mg kg−1 soil) and 90 mg-N kg−1 soil (NH4)2SO4.

image file: c5ra03768a-f12.tif
Fig. 12 Variations of ammonia oxidizing bacterial number in fine soil containing various concentration of Reactive Black 5 (0–1600 mg kg−1 soil) and 30 mg-N kg−1 soil (NH4)2SO4.

image file: c5ra03768a-f13.tif
Fig. 13 Variations of ammonia oxidizing bacterial number in fine soil containing various concentration of Reactive Black 5 (0–1600 mg kg−1 soil) and 90 mg-N kg−1 soil (NH4)2SO4.

image file: c5ra03768a-f14.tif
Fig. 14 Variations of ammonia oxidizing bacterial number in coarse soil containing various concentration of Reactive Black 5 (0–1600 mg kg−1 soil) and 30 mg-N kg−1 soil (NH4)2SO4.

image file: c5ra03768a-f15.tif
Fig. 15 Variations of ammonia oxidizing bacterial number in coarse soil containing various concentration of Reactive Black 5 (0–1600 mg kg−1 soil) and 90 mg-N kg−1 soil (NH4)2SO4.

In fine soil treated with various levels of RB5 combined with 30 mg−1 N kg−1 soil (NH4)2SO4, AOB number was found in range of 5.27–5.40 log cfu g−1 soil at zero day of incubation. In control (30 mg-N kg−1 soil (NH4)2SO4), AOB population increased by 1.68 log cfu g−1 soil up to 28th day. In contrast, at higher concentrations of RB5 (>200 mg kg−1 soil) it was markedly decreased by 3.27, 5.79 and 6.49 log cfu g−1 soil, respectively (Fig. 12). In the case of fine soil amended with 90 mg-N kg−1 soil (NH4)2SO4 plus various concentration of RB5 (>400 mg kg−1 soil), AOB number declined significantly during whole incubation period and it was 69.64 and 82.65%, respectively on 28th day. On the other hand, AOB number suppressed abruptly (17.19%) up to 14 days and then no significant decrease was observed after entire incubation time. However, at 0, 100, 200 mg kg−1 soil RB5 with 90 mg-N kg−1 soil (NH4)2SO4, AOB number increased by 59.67, 65.30 and 61.74%, respectively (Fig. 13).

Maximum reduction of AOB population (92.58%) was recorded in case of coarse soil exposed to 1600 mg kg−1 soil RB5 and 30 mg-N kg−1 soil (NH4)2SO4. Similarly, marked decrease was observed at 400 and 800 mg kg−1 soil RB5 i.e. 34.60 and 81.28%, respectively. On the contrary, in control (only 30 mg-N kg−1 soil (NH4)2SO4) AOB number proliferated by 31.60% after the whole incubation period (Fig. 14). Coarse soil containing only 90 mg-N kg−1 soil (NH4)2SO4 revealed that AOB population manipulated by 49.43% after 28 days of incubation. When higher doses of RB5 (>200 mg kg−1 soil) mixed with 90 mg-N kg−1 soil (NH4)2SO4 were applied, AOB number decreased significantly especially at 800 and 1600 mg kg−1 soil RB5 i.e. 73 and 85.81%, respectively. Conversely, no inhibitory effect was observed when lower doses applied (Fig. 15).

In medium soil treated with very lower RB5 doses and in control, the number of AOB was found highest on 14th day of incubation because there is general view that on 14th day of incubation, growth of AOB is at its peak under favourable conditions and after this it tends to decrease. It was investigated by ref. 32 that at lower doses of 3.3′-diaminobenzidine, growth curve of nitrifying bacteria started to decline sharply after 14 days of incubation. In case of medium soil treated with medium level of RB5, rate of reduction of AOB was moderate and then it decreased further after 14 days of incubation because at this concentration and incubation time, AOB adapted that environment and started to multiply. In contrast, at very higher RB5 concentrations, AOB number decreased very rapidly up to 14th day of incubation and then it continued at relatively slow rate because AOB showed highly negative response growth to azo dye till 14th day and afterwards started to tolerate that contaminated environment.33 Have also demonstrated that effect of these synthetic compounds was dependent on levels and bioavailability of these compounds. Next to it, nearly similar pattern exhibited by all treatments of fine and coarse soil. However, in fine soil inhibitory effect on AOB population was found greater than that of medium and lesser than that of coarse soil. It is attributed to the difference between texture and chemical composition of soil. It was also investigated by ref. 34 who reported that AOB are sensitive to soil texture.6 Reported that in contaminated soil, AOB population decreased by average value of 3.40 log cfu g dry soil though in that study only sandy clay loam soil was used and not amended by (NH4)2SO4. Pharmaceutically active compounds (PhACs) also suppressed the activity of AOB and nitrification process in waste water.29

Conclusion

The results from this study demonstrate that higher RB5 doses (400, 800, 1600 mg kg−1 soil) has significantly inhibited the NH4+-N oxidation process in all types of soil. The maximum average percent inhibition rate (%) of nitrification was detected in coarse soil and lowest in medium soil. However, higher (NH4)2SO4 concentration (i.e. 90 mg kg−1 soil) contributed to suppress the inhibition rate of nitrification at all aforesaid RB5 concentrations. It may ascribed to the high manipulation rate of AOB at this (NH4)2SO4 concentration in comparison to 30 mg kg−1 soil (NH4)2SO4. Likewise, the highest percent decrease (%) in AOB number were 82.55, 88.80 and 92.50% in medium, fine and coarse soil, respectively at the end of incubation period. Thus, RB5 has been proved to be used as an excellent nitrification inhibitor and it could be very effective to release NO3-N at a slow rate in medium fine and coarse soil in case of application of nitrogenous fertilizers along with RB5. In turn, it will cause the less frequent use of nitrogenous fertilizers, increase the crop yield and reduce the NO3-N ground water contamination. In addition, health issues and environmental disturbances must be considered before their extensive application. Therefore, further research must be conducted regarding this field.

Acknowledgements

The work reported in this paper was carried out in Lab, Department of Environmental sciences, PMAS, Arid Agriculture University, Rawalpindi, Pakistan with HEC research grant. This research is also supported by MoE Grant UM.C/625/1/HIR/MoE/SC/04, UMRG (RG257-13AFR) and FRGS (FP038-2013B). The authors gratefully acknowledge Dr Azeem Khalid and Dr Muhammad Aqeel Ashraf for their generous support during research work and manuscript review.

References

  1. A. Stolz, Basic and applied aspects in the microbial degradation of azo dyes, Appl. Microbiol. Biotechnol., 2001, 56, 69–80 CrossRef CAS.
  2. A. Pandey, P. Singh and L. Iyengar, Bacterial decolorization and degradation of azo dyes, Int. Biodeterior. Biodegrad., 2007, 59, 73–84 CrossRef CAS PubMed.
  3. M. A. Ashraf, S. Ullah, I. Ahmad, A. K. Qureshi, K. S. Balkhair and M. A. Rehman, Green biocides, a promising technology: current and future applications, J. Sci. Food Agric., 2014, 94(3), 388–403 CrossRef CAS PubMed.
  4. H. Leub, Textile Dyeing, in Industrial Dyes, Chemistry, Properties and Applications, ed. K. Hunger, Wiley VCH, Weinheim, 2003, pp. 339–425 Search PubMed.
  5. Q. Zhou, Chemical pollution and transport of organic dyes in water-soil-crop systems of the Chinese Coast, Bull. Environ. Contam. Toxicol., 2001, 66, 784–793 CAS.
  6. C. J. Ogugbue and N. A. Oranusi, Inhibitory effects of azodyes on ammonia-N oxidation by Nitrosomonas, Afr. J. Appl. Zool. Environ. Boil., 2005, 7, 61–67 Search PubMed.
  7. M. A. Ashraf, M. J. Maah, I. Yusoff and M. Gharibreza, Proposed design of anaerobic wetland system for treatment of mining waste water at former tin mining catchment, Sci. Res. Essays, 2011, 6(28), 6001–6022 Search PubMed.
  8. F. O. Topac, E. Dindar, S. Ucaroglu and H. S. Baskaya, Effect of a sulfonatedazo dye and sulfanilic acid on nitrogen transformation processes in soil, J. Hazard. Mater., 2009, 170, 1006–1013 CrossRef CAS PubMed.
  9. J. I. Prosser, Autotrophic nitrification in bacteria, Adv. Microb. Physiol., 1989, 30, 125–181 CrossRef CAS.
  10. D. T. Sponza, Necessity of toxicity assessment in Turkish industrial discharges, Environ. Monit. Assess., 2002, 73(1), 41–66 CrossRef CAS.
  11. D. T. Verhamme, J. I. Prosser and G. W. Nicol, Ammonia concentration determines differential growth of ammonia-oxidising archaea and bacteria in soil microcosms, ISME J., 2011, 5, 1067–1071 CrossRef CAS PubMed.
  12. E. L. Schmidt and L. W. Belser, Nitrifying bacteria, in Methods of soil analysis, ed. A. L. Page, R. H. Miller and D. R. Keeney, American Society for Agronomy, Madison, Wisconsin, 2nd edn, 1982, pp. 1027–1042 Search PubMed.
  13. T. Nasholm, K. Huss-Danell and P. Hogberg, Uptake of organic nitrogen in the field by four agriculturally important plant species, Ecology, 2000, 81, 1155–1161 CrossRef.
  14. R. D. Bardgett, T. C. Streeter and R. Bol, Soil microbes compete effectively with plants for organic-nitrogen inputs to temperate grasslands, Ecology, 2003, 84, 1277–1287 CrossRef.
  15. H. A. L. Henry and R. L. Jefferies, Plant amino acids uptake, soluble N turnover and microbial N capture in soils of a grazed Arctic salt marsh, J. Ecol., 2003, 91, 627–636 CrossRef CAS.
  16. A. C. Finzi and S. T. Berthrong, The uptake of amino acids by microbes and trees in three cold-temperate forests, Ecology, 2005, 86, 3345–3353 CrossRef PubMed.
  17. J. Bai, H. Gao, W. Deng, Z. Yang, B. Cui and R. Xiao, Nitrification potential of marsh soils from two natural saline-alkaline wetlands, Biol. Fertil. Soils, 2010, 46, 525–529 CrossRef CAS.
  18. N. Tabassum, U. Rafique, K. S. Balkhair and M. A. Ashraf, Chemodynamics of methyl parathion and ethyl parathion: adsorption models for sustainable agriculture, BioMed Res. Int., 2014, 14, 1–8 CrossRef PubMed.
  19. C. Pozo, M. V. Martinez-Toledo, B. Rodelas and J. Gonzalez-Lopez, Response of soil microbiota to the addition of 3,3-diaminobenzidine, Appl. Soil Ecol., 2003, 23, 119–126 CrossRef.
  20. M. Lang and Z. Cai, Effects of chlorothalonil and carbendazim on nitrification and denitrification in soils, J. Environ. Sci., 2009, 21, 458–467 CrossRef CAS.
  21. J. Hu, D. Li, Q. Liu, Y. Tao, X. He, X. Wang, X. Li and P. Gao, Effect of organic carbon on nitrification efficiency and community composition of nitrifying biofilms, J. Environ. Sci., 2009, 21, 387–394 CrossRef CAS.
  22. M. A. Surhio, F. N. Talpur, S. M. Nizamani, F. Amin, C. W. Bong, C. W. Lee, M. A. Ashraf and M. R. Shahd, Complete degradation of dimethyl phthalate by biochemical cooperation of the Bacillus thuringiensis strain isolated from cotton field soil, RSC Adv., 2014, 4(99), 55960–55966 RSC.
  23. G. Sujectoviene, Nitrification potential of soil under pollution of a fertilizer plant, Environ. Res. Eng. Manag., 2010, 53(3), 13–16 Search PubMed.
  24. D. R. Keeney and D. W. Nelson, Nitrogen inorganic forms, in Methods of Soil Analysis Part 2: Chemical and Microbiological Properties, ed. A. C. Page, R. H. Miller and D. R. Keeney, American Society of Agronomy, Madison, 1982, pp. 643–698 Search PubMed.
  25. P. F. Vendrell and J. Zupancic, Determination of soil nitrate by transnitration of salicylic acid, Commun. Soil Sci. Plant Anal., 1990, 21, 1705–1713 CrossRef CAS.
  26. L. Zhang, Z. Wu, Y. Shi, L. Chen, Y. Song and Y. Juan, Inhibitory effect of aromatic compounds on soil nitrification, Pedosphere, 2010, 20(3), 326–333 CrossRef CAS.
  27. M. Yaseen, M. Arshad and A. Khalid, Effect of acetylene and ethylene gases released from encapsulated calcium carbide on growth and yield of wheat and cotton, Pediobiologia, 2006, 50, 405–411 CrossRef CAS PubMed.
  28. M. Veillette, P. Viensb, A. A. Ramireza, R. Brzezinskib and M. Heitza, Effect of ammonium concentration on microbial population and performance of a biofilter treating air polluted with methane, Chem. Eng. J., 2011, 171(3), 114–1123 CrossRef PubMed.
  29. H. Chu, T. Fujii, S. Moromoto, X. Lin, K. Yagi, J. Hu and J. Zhang, Community structure of ammonia oxidizing bacteria under long-term application of mineral fertilizers and organic manure in a sandy loam soil, Appl. Environ. Microbiol., 2007, 73(2), 485–491 CrossRef CAS PubMed.
  30. A. A. Khaskheli, F. N. Talpur, M. A. Ashraf, A. Cebeci, S. Jawaid and H. I. Afridi, Monitoring the Rhizopus oryzae lipase catalyzed hydrolysis of castor oil by ATR-FTIR spectroscopy, J. Mol. Catal. B: Enzym., 2015, 113, 56–61 CrossRef CAS PubMed.
  31. L. Qian, C. Gui-Xin, L. Tao, W. Jian, Y. Jum, W. Fie and L. Yong-Chao, Nitrification inhibition and dose-dependent effect of dicyandiamide on sandy, loamy and clay soils, Chin. J. Eco-Agric., 2012, 19(4), 765–770 Search PubMed.
  32. M. C. P. Silva, F. Poly, N. Guillaumaud, J. D. Elsas and J. F. Salles, Fluctuations in ammonia oxidizing communities across agriculture soil are driven by soil structure pH, Front. Microbiol., 2012, 3, 77 Search PubMed.
  33. M. T. M. Zulkifley, N. T. Fatt, J. K. Raj, R. Hashim and M. A. Ashraf, The effects of lateral variation in vegetation and basin dome shape on a tropical lowland stabilization in the Kota Samarahan-Asajaya area, West Sarawak, Malaysia, Acta Geol. Sin., 2014, 88(3), 894–914 CrossRef.
  34. S. Wang and C. K. Gunsch, Effect of selected pharmaceutically active compounds on the ammonia oxidizing bacterium Nitrosomonas europae, Chemosphere, 2011, 82(4), 565–572 CrossRef CAS PubMed.

This journal is © The Royal Society of Chemistry 2015
Click here to see how this site uses Cookies. View our privacy policy here.