Mario Berrettoni*ab,
Michela Ciaboccoa,
Marzia Fantauzzide,
Marco Giorgettibc,
Antonella Rosside and
Eugenio Caponettif
aDipartimento di Chimica Industriale “Toso Montanari”, UOS, Campus di Rimini, Università di Bologna, Via dei Mille 39, 47921 Rimini, Italy. E-mail: mario.berrettoni@unibo.it
bINSTM, UdR, Bologna, Italy
cDipartimento di Chimica Industriale “Toso Montanari”, Università di Bologna, Italy
dDipartimento di Scienze Chimiche e Geologiche, Università degli Studi di Cagliari, Campus di Monserrato S.S. 554 – Italy and INSTM, UdR, Cagliari, Italy
eCentro Grandi Strumenti Università degli Studi di Cagliari, Campus di Monserrato S.S. 554, Italy
fDipartimento STEBICEF Università degli studi di Palermo, Italy
First published on 13th April 2015
The paper describes the synthesis and characterization of novel TiO2–metal hexacyanometallates (MHCMs) composite materials. The starting material, TiO2, was modified by addition of cobalt-hexacyanoferrate (CoHCF) or iron-hexacyanocobaltate (FeHCC) at various concentrations. The resulting composites were characterized as follows: cyclic voltammetry (CV) followed the formation of TiO2–MHCM clusters, TEM micrographs studied their morphology, XAS and XPS data indicated that MHCM bonds to TiO2 through the nitrogen atom of its –CN group and modifies the environment of Ti compared to that of pure anatase. As expected, and confirmed by UV-Vis and XP-valence band data, the electronic properties of TiO2 were substantially modified: the edge in the composite materials shifted by about −2.0 eV relative to TiO2.
The photo-catalytic properties of TiO2 are strongly affected by its structure, interface, grain size and crystallographic orientation of the exposed faces in contact with solution.9 The photo-electrochemical characteristics are dependent upon porosity, morphology and the method of synthesis.10,11 Surface functionalization of TiO2 has been achieved with many methods including doping with metal ions or nonmetallic elements, sensitization with organic dyes or semiconductors with a small band-gap.
The aim of this paper is the design, synthesis and characterization of new composite materials of TiO2 and metal hexacyanometallates.
Metal-hexacyanometallates (MHCMs) are solid compounds of mixed valence with general formula: AxMy[B(CN)6]·nH2O where M and B are transition metals, A an alkaline metal, x and y stoichiometric coefficients, n the hydration-intercalation molecules per unit formula (≤14). Metal hexacyanoferrates (MHCFs) are a class of mixed-valence compounds of major technological interest for their electrocatalytic,12 electrochromic,13,14 ion-sensing,15 ion-exchanging16 and photomagnetic17 properties and also for their possible applications in batteries and charge-storage devices.18 These salts present a face centered cubic (fcc) unit cell and depending upon the degree of peptization, can be described in the “soluble” and the “insoluble” form. Basically, the insoluble form lacks one-fourth of the B(CN)63− units, which are replaced by coordinated and non-coordinated water molecules.19
Among the hexacyanoferrates, cobalt hexacyanoferrate (CoHCF) has been extensively studied in literature due to its interesting chemical and electrochemical properties20 and its ease of synthesis by chemical and electrochemical deposition.
Iron hexacyanocobaltate, FeHCC presents a cubic structure similar to that of CoHCF, but with metal centers differently coordinated to either carbon or nitrogen and with significantly different properties. The electrochemistry of FeHCC has not been as extensively investigated as that of CoHCF. However, in FeHCC only iron centers are electroactive while Co atoms in aqueous electrolytes display no activity.21
Widmann et al. studied the solid mixtures KM[hcf]1−x[hcc]x where M = Ni, Fe, Cu, and demonstrated the redox activity of high spin iron centre Fe2+/Fe3+. This activity is observed by cyclic voltammetry only in freshly synthesized FeHCC; after 2 days the features of low-spin iron appear, obviously due to a partial decomposition to Prussian green revealed by a change in color to light green.22
TiO2 nanoparticles functionalized with FeII(CN)64− have been investigated by electro-absorption spectroscopy. The iron complex is believed to bind at a surface TiIV-site via a mono-dentate cyanide ligand, (CN)5FeII–CN–TiIV(particle),23 as suggested by IR and resonance Raman evidence. Other studies dealt with thin films prepared by mixing TiO2 with metal-hexacyanometallates.24–27 To the best of our knowledge, no investigation of the CoHCF–TiO2 composites has been reported while a detailed study of their FeHCC–TiO2 counterparts has appeared.27
An aim of this paper is to compare the photo-electrochromic and photo-electrochemical behavior of CoHCF–TiO2 composites with that of their FeHCC–TiO2 counterparts. Here, we will also detail the procedure of synthesis, and their influence upon optical properties, and the structural-electronic characterization performed with a wide range of experimental techniques.
An aqueous suspension of the sample was dropped on the glassy carbon electrode; after drying, an adherent deposit was covering the electrode surface. Before deposition, the glassy carbon surface was polished with a 0.05 μm alumina slurry on a microcloth polishing pad and rinsed with deionized water.
All precipitates were allowed to stand for a night and air-dried at ambient conditions to improve the formation of the TiO2–MHCM bond. Subsequently, they were carefully washed with deionized water to remove the unreacted salts and centrifuged to separate the solid product. Finally, the precipitate was dried at 80 °C.
TiO2–FeHCC and TiO2–CoHCF were obtained in a similar way starting with a TiO2 suspension to which a water solution of FeCl2 or CoCl2 and an equivalent amount of K3[Co(CN)6] or K3[Fe(CN)6] were added drop wise and stirred at room temperature.27 These TiO2–MHCM compounds were synthetized in three different molar ratios: 1:
1
:
1, 10
:
1
:
1 and 100
:
1
:
1 (where the notation indicates the TiO2
:
K3Fe(CN)6
:
CoCl2 in the case of TiO2–CoHCF composite). The selected ratios were chosen in order to avoid the formation of a solid solution between TiO2 and MHCMs. Hereafter, the composites will be identified by the notation 1
:
1, 10
:
1, 100
:
1.
Binding energy values were corrected by referencing the aliphatic carbon to 285 eV. Data were acquired under computer control (Avantage v 3.45). The spectra were processed using CASAXPS software.30 An iterated Shirley-Sherwood31 background subtraction routine was performed before applying a fitting procedure using a combination of Gaussian and Lorentzian shapes. Composition was calculated using the first-principle method32 and assuming a homogeneous sample. Peak areas were corrected for the sensitivity factors calculated using the Scofield's photoionization cross-sections,33 the asymmetry parameters,34 the inelastic mean free paths (IMFP) and the intensity/energy response of the analyzer as detailed in the literature.35 IMFP were calculated according to Seah et al.36 The accuracy of the resulting atomic concentrations is estimated to be within ±10%.
Sample | CV | IR | UV-Vis | TGAa (nH2O) | XAS | XRDa a/Å | XPS | TEM | |
---|---|---|---|---|---|---|---|---|---|
a The last digit is only partially significant due to the statistical error. | |||||||||
TiO2–CoHCF | 1![]() ![]() |
X | X | X | 3.0 | X | 10.07 | x | X |
10![]() ![]() |
X | X | X | 6.5 | 10.30 | x | X | ||
100![]() ![]() |
X | X | X | 7.8 | 10.26 | x | X | ||
TiO2–FeHCC | 1![]() ![]() |
X | X | X | 5.2 | X | 10.30 | x | X |
10![]() ![]() |
X | X | X | 6.3 | 10.13 | x | X | ||
100![]() ![]() |
X | X | X | 7.4 | — | x | X |
The diffractogram of the 100:
1 TiO2
:
FeHCC sample is not available being the concentration of FeHCC too low in this composite. The cell parameters, a, assume a value very close to 10 Å, typical of the hexacyanometallates.
Table 2 provides the stoichiometry of the compounds as measured by X-ray fluorescence (XRF) and X-ray photoelectron spectroscopy (XPS). K+ is missing in the XRF data due to limitations of the experimental set up.
Sample | TiO2![]() ![]() |
XPS | XRFa | |||
---|---|---|---|---|---|---|
Formula | Co/Fe | N/Fe | Co/Fe | |||
a K+ is not detected. | ||||||
TiO2 + CoHCF | 1![]() ![]() |
K1.2Co1.3[Fe(CN)6] | 1.3 | 6.5 | Co1.1[Fe(CN)6] | 1.1 |
10![]() ![]() |
K1Co1.5[Fe(CN)6] | 1.5 | 6.3 | Co1.2[Fe(CN)6] | 1.2 | |
100![]() ![]() |
K0.7Co1.5[Fe(CN)6] | 1.5 | 5.9 | Co1.4[Fe(CN)6] | 1.4 | |
Fe/Co | N/Co | Fe/Co | ||||
TiO2 + FeHCC | 1![]() ![]() |
K0.7Fe0.7[Co(CN)6] | 0.7 | 6.2 | Fe0.8[Co(CN)6] | 0.8 |
10![]() ![]() |
K0.3Fe0.8[Co(CN)6] | 0.8 | 5.8 | Fe1.6[Co(CN)6] | 1.6 | |
100![]() ![]() |
— | — | — | Fe1.32[Co(CN)6] | 1.3 |
The low intensity of the cobalt signal, Co2p, did not allow calculation of the surface composition of the TiO2–FeHCC sample in 100:
1 ratio. The elemental ratios calculated with XPS and XRF are in reasonable agreement.
All the compounds prepared, TiO2–FeHCC and TiO2–CoHCF in different ratios, were fully characterized by CV, TEM, IR, UV-Vis, XAS and XPS in order to provide evidence of their formation, to determine the morphology of the aggregates, to verify the formation of the compounds and to shed a light on the effect of the FeHCC and CoHCF doping agents.
![]() | ||
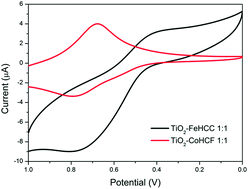
Fig. 1 CVs at 0.1 V s−1 of TiO2–FeHCC 1![]() ![]() ![]() ![]() |
Fig. 2 and 3 provide CVs of TiO2–FeHCC and TiO2–CoHCF in 1:
1, 1
:
10, 1
:
100 molar ratios respectively, in 1.0 M KCl solution. In all cases, only a single reversible redox system is observed.
![]() | ||
Fig. 2 CVs at 0.1 V s−1 of TiO2–FeHCC 1![]() ![]() ![]() ![]() ![]() ![]() |
![]() | ||
Fig. 3 CVs at 0.1 V s−1 of TiO2–CoHCF 1![]() ![]() ![]() ![]() ![]() ![]() |
Tables 3 and 4 report the Epc and Epa (in Volts) values for the 1:
1, 10
:
1 and 100
:
1 TiO2–FeHCC and TiO2–CoHCF compounds respectively and the relative E0 values calculated as (Epa + Epc)/2.
TiO2–FeHCC | Epc | Epa | E0 |
---|---|---|---|
1![]() ![]() |
0.364 | 0.787 | 0.575 |
10![]() ![]() |
0.261 | 0.708 | 0.484 |
100![]() ![]() |
0.207 | 0.735 | 0.471 |
TiO2–CoHCF | Epc | Epa | E0 |
---|---|---|---|
1![]() ![]() |
0.679 | 0.784 | 0.732 |
10![]() ![]() |
0.655 | 0.835 | 0.745 |
100![]() ![]() |
0.529 | — | — |
CVs were also performed in solution with different KCl concentrations (1.0, 1.0 × 10⁻¹, 1.0 × 10⁻² M) to verify the role of K+. For both compounds, the peak potentials shifted in the negative direction with decreasing the electrolyte concentration, thus confirming that the redox process is associated with the intercalation of electrolyte K+ cations (see Fig. S1 and S2 in the ESI†). Within the experimental error, the slopes of 56 mV and 52 mV are consistent with a single electron redox process assisted by K+. Similar results were obtained for TiO2–FeHCC and TiO2–CoHCF in 10:
1 molar ratio (not shown).
Aggregates of TiO2–CoHCF (1:
1 ratio) and TiO2–FeHCC (1
:
1 ratio) consist of typical spherical TiO2 particles covered with grains of cubic CoHCF and FeHCC (see Fig. S3a and b†);
In 1:
1 samples, many isolated clusters of CoHCF or FeHCC with cubic structure and 100 ÷ 200 nm in size are observed; however, FeHCC has less isolated clusters than CoHCF.
In 10:
1 samples; TiO2 aggregates are larger, ranging from 100 to 600 nm, and consist of 5 ÷ 20 TiO2 spherical particles; Fig. 4 is a micrograph of TiO2 and CoHCF in 10
:
1 ratio showing an aggregate of spherical TiO2 particles covered with cubic nanocrystals of CoHCF.
![]() | ||
Fig. 4 Typical aggregate of TiO2 spherical particles covered with cubic nanocrystals of CoHCF (10![]() ![]() |
In 100:
1 samples, rare CoHCF or FeHCC grains and TiO2–CoHCF or TiO2–FeHCC aggregates are present, as shown in Fig. 5. These CoHCF or FeHCC grains are larger than in the 1
:
1 and 10
:
1 samples.
![]() | ||
Fig. 5 Magnification at 30.000× of the sample referring to a cubic particle of CoHCF bonded to a TiO2 spherical particle. TiO2–CoHCF are in 100![]() ![]() |
Fig. 7 and 8 show the normalized IR transmission spectra in the region of the CN stretching frequencies for TiO2–CoHCF and TiO2–FeHCC, respectively, in different molar ratios (1:
1, 10
:
1 and 100
:
1).
![]() | ||
Fig. 7 TiO2–CoHCF FT/IR spectra at different molar ratios in the region of CN stretching frequencies. |
![]() | ||
Fig. 8 TiO2–FeHCC FT/IR spectra in different molar ratios in the in the region of CN stretching frequencies. |
In the bulk CoHCF compound, we detected and assigned all the bands due to the possible combinations FeII/III–CN–CoII/III (see Table 5). In the 1:
1 and 10
:
1, the bands at 2157 cm−1 disappear, the bands at 2081, 2102 and 2119 cm−1 remain nearly the same, a new band at 2133 cm−1 appears, probably due a FeII/III–CN–Ti bond. In the 100
:
1 compound the band distribution density is similar to the bulk one. These findings fully agree with the XPS results (see the XPS section) and are consistent with the pictures emerging from the TEM analyses. In fact, in the 100
:
1 compound, the CoHCF particles bonded to TiO2 are very few while clusters of isolated CoHCF are mostly detected. Table 6 reports the same data for the observed CN stretching bands in FeHCC, without any assignment to a definite chemical structure, the bands are indicated only as
1,
2 and
3 because no reference data have been found in literature. Anyway, the whole IR band is in agreement with Berrettoni et al.27 The difference in the relative intensity of the bands, especially relevant in the case of FeHCC, can be due to different particle size (i.e. the bulk surface features) and it will not be discussed here.
Stretching | FeII–CN–CoII ![]() |
FeII–CN–CoIII ![]() |
FeII/III–CN–Ti ![]() |
FeIII–CN–CoII ![]() |
---|---|---|---|---|---|
Bulk | 2081/11 | 2102/36 | 2119/33 | 2133/0 | 2157/20 |
1![]() ![]() |
2081/20 | 2102/16 | 2119/28 | 2133/35 | 2157/1 |
10![]() ![]() |
2081/15 | 2102/17 | 2119/37 | 2133/31 | 2157/0 |
100![]() ![]() |
2081/20 | 2102/8 | 2119/66 | 2133/0 | 2157/6 |
Stretching | ![]() |
![]() |
![]() |
---|---|---|---|
Bulk | 2167/21 | 2169/0 | 2181/79 |
1![]() ![]() |
2167/28 | 2169/38 | 2181/34 |
10![]() ![]() |
2167/26 | 2169/74 | 2181/0 |
100![]() ![]() |
2167/28 | 2169/44 | 2181/27 |
In the bulk compound, two stretching bands are observed at 2181 and 2167 cm−1. The intensity of the band at 2181 cm−1, the dominant one in bulk FeHCC, decreases by dilution with TiO2 while the intensity of the band at 2169 cm−1, absent in bulk FeHCC, increases; the latter band is tentatively assigned to the FeHCC–TiO2 bond. The intensity of the band at 2167 cm−1 is not influenced by the concentration, as shown in Table 6, so it can be referred to the FeHCC in bulk. In the case of FeHCC we observe a net shift between CN in the bulk form and CN in the TiO2-linked form. Furthermore, the shift is inversely proportional to the FeHCC concentration. The spectra of the samples with CoHCF have more features than those with FeHCC, corresponding to a relatively minor complexity of the latter.
To obtain information about the chemical state of the elements, the spectra of iron, cobalt, nitrogen and titanium were curve fitted. Parameters such as the Gaussian–Lorentzian ratio and the full width at half height (FWHH) of a component were obtained from the spectra of reference compounds taken under identical acquisition conditions.
The line shape of Fe2p3/2 in the FeHCC compounds is very different from that in CoHCF (Fig. 9a and S7 in the ESI†): the peaks are asymmetric, the full-width at half height (FWHH) is greater, and peak positions are shifted to higher binding energies. Curve fitting procedures performed according to literature40,41 lead to the conclusion that both FeII at 709.0 eV and FeIII at 710.5 eV are present at the surface of FeHCC grains.
![]() | ||
Fig. 10 N1s signal from CoHCF (a) and FeHCC (b) compounds. (c) Area% of the second component of N1s (B.E. = 399.5 eV) for all the TiO2–MHCM compounds. |
Ti2p3/2 binding energy value (eV ± 0.2) | ||
---|---|---|
TiO2![]() ![]() |
FeHCC | CoHCF |
1![]() ![]() |
458.9 | 458.8 |
10![]() ![]() |
458.8 | 458.8 |
100![]() ![]() |
459.2 | 459.1 |
Sample | Valence band edge binding energy (eV ± 0.2) |
---|---|
CoHCF | 2.0 |
TiO2![]() ![]() ![]() ![]() |
1.2 |
TiO2![]() ![]() ![]() ![]() |
1.2 |
TiO2 | 3.2 |
Also in this case a complex band between 0 and 12 eV is observed for pure FeHCC; in analogy with CoHCF, it is assigned to the overlapping of the bands due to Co–C σ and π bonding electrons with Fe–C σ and π bonding electrons. A shift toward lower energies of the edge is also observed (Table 9) in the TiO2–MHCM composites relative to pure TiO2; a difference of 0.7 eV is observed between the edge of bulk CoHCF and that of bulk FeHCC.
Sample | Valence band edge binding energy (eV ± 0.2) |
---|---|
FeHCC | 1.3 |
TiO2![]() ![]() ![]() ![]() |
1.3 |
TiO2![]() ![]() ![]() ![]() |
1.9 |
TiO2 | 3.2 |
The normalized XANES spectra are given in the left column of Fig. 13(a, c and e) whereas the right column provides the Fourier Transforms (FTs) of the Extended X-ray Absorption Fine Structure (EXAFS) spectra. Of the composite samples, we report only the spectra of TiO2–MHCM 1:
1, taken as the most representative. The normalized curves at the Ti K-edge (panel (a)) give evidence that the presence of FeHCC or CoHCF modifies the local environment of titanium, in comparison with that of pure anatase phase. This is evident from the pre-edge structures (A peak), the main absorption edge (B) and the resonance (C) but the modification at the Ti site with either FeHCC or CoHCF dopant is essentially the same. The comparison of the Fourier Transform curves of the EXAFS signals relatives to the K-edge of Ti confirms minor but significant modifications of the local structure of Ti. This is showed in the panel (b) where the FTs, which are related to the radial atomic distribution around the selected (photo-absorber) atom, display peaks intensity increasing following FeHCC or CoHCF doping. This might be due to a decreasing of the structural order in the three shells as indicated in Fig. 13b.
By tuning the X-ray beam to a precise metal edge, complementary information is available at the Fe and Co K-edges for both TiO2–FeHCF 1:
1 and TiO2–CoHCF 1
:
1 samples.
Panels (c), (d), (e), (f) display a selection of the XAS analysis concerning the CoHCF composites; comparison with bulk CoHCF is also provided. All panels indicate modification relative to the bulk sample of the XAS spectra, thus confirming the occurrence of a substantial interaction between TiO2 and CoHCF.
A close inspection of the figures reveals the following details of the TiO2–CoHCF binding. (1) The Fe local site is basically the same upon TiO2 addition as seen from the XANES in the panel (c) but a shift towards lower energy of the curve is evidenced, indicating a partial reduction to Fe(II). (2) Unlike the Fe, the Co local environment changes upon TiO2 addition, as the overall shape of the XANES curve of panel (e) is strongly modified; furthermore, no changes in the pre-edge peak position has been detected and therefore the Co is in the Co(II) site.
The trend observed in the XANES data is confirmed by the corresponding FTs curves. The Fe display (panel (d)) similar peak positions and intensities, with the exception of the 3rd peak at ∼5 Å, assigned to the Fe–Co distance, which decreases upon doping with TiO2. On the contrary, all three peaks displayed in the panel (f) shift to lower distances, providing evidence for shorter bond lengths of the first, second and third shells around cobalt.
Similar comments apply to the comparison of the Fe and Co K-edges in FeHCC and TiO2–FeHCC. The analysis, available in the ESI,† leads to the same conclusions if we swap the Co with Fe site. In this case the Fe site changes significantly upon TiO2 doping while the Co one does not, as clearly visible from the XANES curve of Fig. S11,† panels (c) and (d). This experimental finding is interesting and can be explained by considering the local probe characteristic of a XAS experiment. Regardless the long range structure, the XAS indicates that significant changes occur only at the metal site (either Co or Fe), which is linked to the N side of the CN moieties of the cyanide bridge.
The waves of cyclic voltammetry and their dependence upon the K+ concentration demonstrate the successful synthesis of both CoHCF and FeHCC.20,27 Only a single quasi-reversible redox system is detected both in FeHCC and in CoHCF.
In bulk CoHCF, two redox processes due to the FeIII/FeII and CoIII/CoII couples, respectively, can be observed; the second one becomes electroactive only when the compound is crystallized in the so called “insoluble form”51 or in nano-sized form.20 In our bulk CoHCF, the peak potential and the E0 values allow to assign the redox wave to FeIII/FeII couple.20 In the FeHCC compounds, the observed redox wave is still due the iron center, as confirmed by the E0 values, while the cobalt center is non electroactive.27 Hence the observed redox waves in TiO2–FeHCC and TiO2–CoHCF are always due just to the FeIII/FeII couple.
From the CVs of TiO2–FeHCC (Fig. 2 and Table 3) we obtain that, with increasing the TiO2/FeHCC ratio, the kinetics of cation insertion becomes slower, since the cathodic peak shifts toward more negative potentials, while the kinetics of its release is faster, since the anodic peak shifts toward more negative potentials. Also the E0 values show a negative shift in going from 1:
1 to 10
:
1 composites, and no further changes in the 100
:
1 composite. The redox process is characterized by a relative high peak separation, in accordance with the published literature,27 while the peak shapes reflect the difference in the TiO2–FeHCC synthesis. Actually, the modified electrode was realized by chemical synthesis (see Experimental paragraph for details) while in the published literature,27 the TiO2–FeHCC composite electrodes were electrochemically synthesized in situ on a TiO2 thin film. In the case of TiO2–CoHCF (Fig. 3 and Table 4), both cation insertion and release become more difficult at least for 1
:
1 and 10
:
1 compounds, while in 100
:
1 ratio the CV shape prevents the resolution of the voltammetric wave. In this case, as expected, the E0 values remain constant.
The formation of MHCM cluster on the TiO2 surface causes a clear modification of the IR spectra. The change in the intensity, that might be assigned to the different amounts of MHCM added and hence to the different degree of interaction with the TiO2, is accompanied by a band shift towards lower wavenumbers and a shape morphology change (Fig. 7 and 8). IR results are in agreement with the XPS that allows to distinguish between Fe–CN (CoHCF) and Fe–NC (FeHCC) and confirm the absence of FeIII in TiO2–CoHCF samples with 1:
1 (Fig. 9a) and 10
:
1 ratios (ESI Fig. S6†) and the presence of FeIII in the 100
:
1 sample (ESI Fig. S6†). XPS and IR identification of cobalt species are also in agreement for both FeHCC and CoHCF samples. Furthermore XPS analyses provide the evidence of the interaction between nitrogen and titanium: cyanide groups may act as ligands for titanium ions at the surfaces, forming M–CN–Ti bonds, as also shown by the band shift towards lower wavenumbers and shape morphology change in IR spectra. The involved reaction might be thought as a nucleophilic substitution reaction with titanium ions playing the role of central ions and hexacyanoferrate anions acting as ligands.
The combined XANES and EXAFS analysis at the Ti K-edge of Fig. 13a and b show that the presence of MHCM modifies the local environment of the titanium, relative to that in pure anatase. This suggests the same type of binding between the anatase and either FeHCC or CoHCF cubes. The analysis at the metal (Fe and Co) K-edges shows modification in the XAS spectra respect to the pure CoHCF sample (and the same holds true for the FeHCC case of Fig. S11†), thus confirming the occurrence of a close interaction between TiO2 and CoHCF (or FeHCC). Overall, these findings are explained by considering a close interaction between the anatase and the FeHCC or CoHCF cubes, most likely through the N side of the CN moieties, as previously evidenced by the IR and XPS analyses.
On the basis of these findings two mechanisms for the metal hexacyanoferrate (FeHCC or CoHCF) interaction to the anatase particles can be proposed. According to the first mechanism, the HCC or HCF salt reacts with either Fe(III) or Co(III) respectively to give the mixed hexacyanometallate (I step, Fig. 14a) and subsequently the insoluble species, consisting in a dendrimer-like structure, reacts with the N terminals (II step, Fig. 14a). It is worth noting that the role of the vacancies is important because they suppress the perfectly cubic structure and increase the surface adhesion. The presence of ion vacancies, and their concentration, in metal hexacyanoferrates certainly affects a range of properties.52 However, one may imagine another mechanism: the HCC or HCF salt reacts with anatase particles (I step, Fig. 14b) and, subsequently, the metal hexacyanometallate FeHCC or CoHCF synthesis occurs (II step, Fig. 14b). Presently, it is not possible to determine which of these two mechanisms is the predominant one.
In order to evaluate the effect of CoHCF or FeHCC doping upon TiO2 absorption threshold, UV-Vis spectra were recorded in the 220–700 nm range in suspensions of TiO2–CoHCF and TiO2–FeHCC (Fig. 15 and 16). The progressive shift towards higher wavelengths of the TiO2 absorption threshold is notable by adding K3[Fe(CN)6] and CoCl2 or K3[Co(CN)6] and FeCl2 with the formation of CoHCF or FeHCC, respectively, linked to the TiO2. In both cases it is worth observing a shift of the threshold at lower energy that can be explained also on the basis of theoretical calculations.54 In addition, new absorption bands in the UV and Vis region related to MHCMs play a fundamental role in the promotion of titania electrons to the conduction band with the same mechanism of TiO2 dye solar cells. These findings are much relevant in all the applications of TiO2 depending upon its light absorption capability.
MB has been chosen as a model to test the photocatalytic activity of surfaces in an aqueous medium in according with the International Standard ISO 10678.
The tests were performed by following the methodology reported in the previous cited ISO standard. The degradation reaction kinetics are studied by monitoring the variation of the normalized dye absorption spectra in function of the irradiation time with UV light in the wavelengths range between 220 and 750 nm, as shown in Fig. 17. In the case of TiO2–CoHCF in 10:
1 ratio, the decrease of the absorbance vs. time is faster than native TiO2; the value of dA/dt for TiO2–CoHCF is about 20% higher than the native TiO2. The results revealed that the CoHCF doped TiO2 showed higher photocatalytic activity than that of native TiO2.
UV-Vis spectra and the valence band measurement in the composites confirm a desirable reduction of the TiO2 band gap. The versatility of the synthesis permits to obtain both bulk and thin films composite materials. Practical use of these materials can be envisaged in different areas, such as antibacterial treatments, protection of historical artifacts, self-cleaning surfaces, photovoltaic cells.
Footnote |
† Electronic supplementary information (ESI) available. See DOI: 10.1039/c5ra03458b |
This journal is © The Royal Society of Chemistry 2015 |