Adsorption of chlorinated phenols on multiwalled carbon nanotubes

Marijana Kragulj*a, Jelena Tričkovića, Ákos Kukoveczbc, Branislav Jovića, Jelena Molnara, Srđan Rončevića, Zoltán Kónyabd and Božo Dalmacijaa
aUniversity of Novi Sad, Faculty of Sciences, Department of Chemistry, Biochemistry and Environmental Protection, Trg Dositeja Obradovića 3, 21000 Novi Sad, Serbia. E-mail: marijana.kragulj@dh.uns.ac.rs; Tel: +381214852725
bDepartment of Applied and Environmental Chemistry, University of Szeged, Rerrich Béla tér 1, H-6720 Szeged, Hungary
cMTA-SZTE “Lendület” Porous Nanocomposites Research Group, Rerrich Béla tér 1, H-6720 Szeged, Hungary
dMTA-SZTE Reaction Kinetics and Surface Chemistry Research Group, Rerrich Béla tér 1, H-6720 Szeged, Hungary

Received 24th February 2015 , Accepted 2nd March 2015

First published on 2nd March 2015


Abstract

This work studies the adsorption of four chlorinated phenols (2,4-dichlorophenol, 2,4,6-trichlorophenol, 2,3,4,5-tetrachlorophenol and pentachlorophenol) in aqueous solutions on multiwalled carbon nanotubes (MWCNT). To investigate the influence of oxygen containing functional groups, adsorption parameters for the phenols were determined for original MWCNT (OMWCNT) and functionally modified MWCNT (FMWCNT) by acid treatment for 3 h and 6 h. The correlation between phenol adsorption affinity and specific surface area (SSA) indicates that OMWCNT have higher adsorption affinities for larger molecules such as tetrachlorophenol and pentachlorophenol, which suggests that mesopore filling is not the dominant mechanism controlling their adsorption. Electrostatic repulsion between disassociated chlorinated phenols and disassociated functional groups on the surface of both FMWCNT lead to adsorption decreasing with increasing functionalisation under neutral pH conditions. On OMWCNT, a positive correlation between molecular hydrophobicity and adsorption affinity was obtained, indicating hydrophobic interactions control the adsorption of chlorinated phenols. To investigate the role of π–π interactions, Kd values (at 0.01 and 0.5 SW) were normalized by hydrophobicity. The Kd/KOW values for all MWCNT decreased from 2,4-dichlorophenol to pentachlorophenol and were negatively correlated with the electron-acceptor property of the molecules. The most pronounced π–π interactions were observed for 2,6-dichlorophenol on all MWCNT.

1. Introduction

Since their discovery in 1991 (ref. 1), CNT have stimulated great research interest due to their unique and outstanding electronic, mechanical, and chemical properties and their potential applications in energy conversion, quantum nanowires, catalyst supports, and biomedical use. Due to their large surface area, potential CNT environmental applications as superior adsorbents have been suggested and examined for removal of inorganic and organic contaminants from water and gases. CNT would also affect the transport and fate of contaminants in the environment. At the same time, interaction with contaminants may also change the environmental behaviour and fate of CNT themselves. Therefore, understanding their sorption behaviour is crucial for environmental CNT application and environmental risk assessment of both CNT and contaminants.

A number of experimental studies investigated CNT adsorption for benzene, toluene, chlorobenzenes, nitrobenzene, PAHs,2–4 butane,5 trihalomethanes,6 dioxin,7 xylenes,8 chlorophenols,9 1,2-dichlorobenzene10 and resorcinol.11 Most of these studies focused on the adsorption capacity of nonionic chemicals on CNT. However, a few experimental studies have investigated the exact sorption mechanism of ionizable organic compounds to CNT. Phenols are ionizable organic compounds and also environmentally relevant contaminants, widely found in effluents from pesticides, dyestuffs, pharmaceuticals, petrochemicals, and other industries.12–14 Phenols are also present in domestic effluents and vegetation decay. In view of the wide prevalence of phenols in different wastewaters and their toxicity to human and animal life even at low concentrations, it is essential to remove them before discharging the wastewater into water recipients. Some of them have been included in the list of priority pollutants by the Water Framework Directive15 as they are harmful to organisms at low concentrations and many of them have been classified as hazardous pollutants because of their potential to harm human health.12–14 Therefore, their removal from water and understanding their environmental behaviours is of great interest for human health. The literature reports many studies relating to their adsorption by adsorbents to elucidate the mechanism of the adsorption process.12–14 Many studies have dealt with the adsorption of phenols by CNT.16–20 Thus, Lin and Xing17 investigated the adsorption of phenolic compounds by carbon nanotubes. In another study, Yang et al.18 investigated the adsorption of a series of phenols and anilines by MWNTs. Liao et al.11 also used HNO3 and NH3 treated MWCNTs for the removal of chlorophenols. Arasteh et al.16 investigated the adsorption behaviour of 2-nitrophenol onto CNT by varying the parameters such as agitation time, 2-nitrophenol concentration and pH. To date, many studies have dealt with the adsorption of phenols by CNT, but there is still a lack of information about the adsorption mechanism of the chlorophenols. In order to fill this gap in the understanding of adsorption mechanisms, this work investigated a series of chlorophenols (di-, tri-, tetra and penta-chlorophenol) with different hydrophobicity, electron polarizability, molecular size and number of chlorine atoms on the same type of MWCNTs. In addition, detailed experimental studies were conducted to characterize the type of interactions (electrostatic, hydrophobic and π–π), between CNTs and the series of chlorophenols. This enabled comparison of the adsorption affinities of the investigated chlorophenols, to establish which physico chemical properties of the CNTs and chlorophenols affect the adsorption affinity. As a result of their excellent performance with respect to the removal of phenols and other toxic organics, CNTs are already being considered for a broad range of applications for wastewater treatment.21 The information presented in this work is therefore useful to further improve the design of CNTs and their applications. Thus, all adsorption experiments were performed at neutral pH because it is the most relevant for environmental conditions. The major goal of this study was to investigate the following: (1) the adsorption affinities of three MWCNT that differ in the content of oxygen functional groups for selected chlorinated phenols, (2) the influence of specific surface area (SSA) and surface chemistry of MWCNT on the adsorption affinity; (3) the identity of the different types of interactions between selected chlorinated phenols and investigated MWCNT.

2. Materials and methods

2.1 Adsorbates and adsorbents

As adsorbates, four chlorinated phenols (2,4-dichlorophenol (2,4-DCP), 2,4,6-trichlorophenol (2,4,6-TCP), 2,3,4,5-tetrachlorophenol (2,3,4,5-TeCP) and pentachlorophenol (PCP)) that differ in hydrophobicity, electron polarizability, polarity, molecular size and number of chlorine atoms were used. All phenols (purity > 99%) were purchased from Sigma-Aldrich Chemical Company. The relevant properties of the chosen phenols are summarized in Table 1.
Table 1 Physicochemical properties of the investigated chlorinated phenolsa
Compounds MW log[thin space (1/6-em)]KOW22 Ai22,23 Bi22,23 Si22 Vi22 SW22 pKa22
a MW, molecular weight (g mol−1); KOW, octanol–water partition coefficient; Ai, electron acceptor property of the molecule; Bi, electron donor property of the molecule; Si, molecule's dipolarity/polarizability; Vi, McGowan volume in units of (cm3 mol−1)/100; SW, water solubility (mg l−1); pKa dissociation constant.
2,4-DCP 163 3.06 0.53 0.19 0.84 1.02 4500 7.90
2,4,6-TCP 197 3.69 0.82 0.08 1.01 1.14 800 6.40
2,3,4,5-TeCP 232 4.21 0.70 0.13 0.91 1.26 28.7 6.35
PCP 266 5.12 0.97 0 0.88 1.39 14.0 4.80


The MWCNT used are from the same batch as those used in our previous study.2 The MWCNT sample was synthesized using the catalytic chemical vapour deposition (CCVD) procedure, described in more detail in the papers Kanyó et al.24 and Kragulj et al.2 Briefly, the MWCNT functionalisation procedure was as follows: 10 g of original MWCNT (OMWCNT) was mixed with 1 l of cc. HNO3 for 1 h using magnetic stirring, followed by oxidation of the suspension under reflux for 3 h or 6 h, obtaining two samples labelled as FMWCNT3h and FMWCNT6h. The samples were thoroughly washed with deionised water after HNO3 treatment.

The surface carbon content of all MWCNT was analyzed by scanning electron microscope (SEM, Hitachi S-4700) with an energy-dispersive spectrometer (EDS). The multi-point BET (Brunauer–Emmett–Teller) SSA of all adsorbents was determined by nitrogen adsorption at 77 K by Autosorb iQ Surface Area Analyzer (Quantachrome Instruments, USA). Samples were outgassed at 200 °C for 2 h before running the isotherms. Mesopore volumes (Vmes) were derived from desorption isotherms using the BJH (Barrett–Joyner–Halenda) model. Micropore volumes were calculated by t-test method and Horwath–Kawazoe (HK) method.

The amount of basic and acidic surface oxygen groups (carboxylic, lactonic and phenolic groups) was determined using Boehm titration method.25,26 Briefly, 200 mg of sample was added to a series of flasks containing 50 ml of 0.01 M: NaOH, Na2CO3, NaHCO3 and HCl solutions. The flasks were then sealed, sonicated by ultrasound for 2 h, and then shaken for 24 h at 20 °C. The suspension was filtered and 10 ml of filtrate was titrated with 0.01 M HCl or NaOH, depending on the original solution used. The number of acidic groups was calculated based on the assumption that NaOH neutralizes carboxylic, lactonic and phenolic groups; Na2CO3 neutralizes carboxylic and lactonic groups; and NaHCO3 neutralizes only carboxylic groups. The number of basic sites was determined from the amount of HCl that reacted with MWCNT.

To measure the point of zero charge of all MWCNT, mass titrations were performed following the method proposed by Tian et al.27 The procedure was as follows: three aqueous NaNO3 (0.01 M) solutions of different pHs (3, 6 and 11) were prepared using HNO3 (0.1 M) and NaOH (0.1 M). The solid samples were then added to the solutions (20 ml) at different mass ratios (1%, 5%, 10%, 15%, 20%). The final pH of the mixture was measured after 24 h of shaking at 20 ± 1 °C. PZC was determined as the converging pH value from the pH vs. sample mass curves.

2.2 Adsorption isotherms

The isotherms were determined by a batch equilibration technique at room temperature (20 ± 1 °C). The background solution was 0.01 M CaCl2 in deionised water with 100 mg l−1 NaN3 as a biocide. Stock solutions of phenols (1000 μg ml−1) were prepared in MeOH (J.T. Baker, for organic residue analysis). Initial concentration of phenols ranged from 1 to 1000 μg l−1. The volume of methanol stock solutions of phenols used for the background solution spiking was <0.1% (v/v), which has been shown to have no measurable influence on the sorption behaviour of the hydrophobic organic compounds.28 The amount of adsorbent ranged from 1–5 mg to correspond to a sample/solution ratio that resulted in 20–80% uptake of solute. Head space in the glass flasks was kept at a minimum in order to minimize the loss of compounds during the experiment due to evaporation. The procedure was as follows: glass flasks containing premeasured adsorbent and background solution were agitated in an ultrasonic bath for 30 min before a certain volume of methanol stock solution of phenols was spiked and equilibrated at room temperature by continuous shaking for 48 h. The equilibration period of 48 h was based on a preliminary kinetics experiment which was performed over 168 h. All experiments were carried out at neutral pH conditions likely to be found in the environment. The initial pH of the background solution was 6.8, while the pH of the suspensions after reaching equilibrium was in the range 6.6–6.8. The pH value of the suspensions did not change significantly during the experiment due to large liquid/solid ratio which ranged from 66.7 to 775 for OMWCNT and from 66.7 to 400 for FMWCNT. After reaching equilibrium, the adsorbent was settled for 24 h, and a sample of clear supernatant was removed for determination of the phenols equilibrium concentration. To determine the initial concentration of phenols for each isotherm point and to determine phenol losses other than adsorption to the adsorbents, two control flasks without any adsorbent were prepared and treated in exactly the same way. The recoveries of the initial concentrations of phenols were in the range of recoveries for the applied analytical methods, indicating no significant losses of phenols due to processes other than adsorption (e.g. volatilization, biodegradation). Solid-phase solute concentrations were calculated from a mass balance of solute between the solid and aqueous phases.

2.3 Chemical analysis

Chlorinated phenol concentrations were determined by gas chromatography with mass spectrometric detection (GC/MSD), requiring an acetylation step prior to analysis. For acetylation of chlorinated phenols, K2CO3 was added to the aqueous solution and stirred for 1 min, followed by the addition of acetic anhydride and vigorous stirring for 2 min to ensure complete acetylation of the phenols. The acetylated phenols were extracted into hexane (J.T. Baker, for organic residue analysis) with 2 min of shaking. The acetylated phenols were analyzed by Agilent 7890A/5975C GC/MSD on a HP-5MS column (J&W Scientific) using the following conditions: helium carrier gas at a flow rate of 1.5 ml min−1 in the column; injector temperature 200 °C; initial oven temperature 40 °C for 2 min, then 40 °C min−1 to 100 °C for 0.5 min, then 2 °C min−1 to 140 °C and 30 °C min−1 to 300 °C; detector temperature 150 °C. The sample volume injected was 2 μl.

Recoveries from the applied analytical methods for all phenols were obtained from six measurements at two concentration levels of 300 and 600 μg l−1, and ranged from 80–98% and 112–116%, respectively, with the RSD being below 10% for all phenols.

2.4 Data analysis

The Freundlich and Dubinin–Radushkevich (D–R) models were used to fit the equilibrium adsorption data of phenols on all investigated MWCNT. Freundlich model is the most commonly employed model that enables comparison of obtained results with the literature data. The Freundlich model can be expressed as:
 
qe = KFCen (1)
where qe and Ce are the solid phase and aqueous phase equilibrium concentrations (in μg g−1 and mg l−1, respectively), while KF and the exponent n are the Freundlich sorption capacity coefficient [expressed as (mg g−1)/(mg l−1)n], and the site energy heterogeneity factor indicating isotherm nonlinearity (dimensionless), respectively. KF and n were obtained from direct nonlinear curve fitting of the adsorption data sets.

A single point distribution coefficient (Kd) for a certain equilibrium concentration (Ce) was determined according to the Freundlich isotherms following equation:

 
Kd = KFCen−1 (2)
where Kd is the adsorption distribution coefficient (in l kg−1).

The D–R isotherm is applied to estimate the characteristic porosity and the apparent free energy of adsorption and can be used to describe adsorption on both homogenous and heterogeneous surfaces. Its linear form can be shown in eqn (3):

 
ln[thin space (1/6-em)]qe = ln[thin space (1/6-em)]qm2 (3)
where B is a constant related to the mean free energy of adsorption (mol2 kJ−2); qm is the theoretical saturation capacity (mg g−1); and ε is the Polanyi potential, which can be calculated from eqn (4):
 
image file: c5ra03395k-t1.tif(4)
where R (J mol−1 K−1) is the gas constant and T (K) is the absolute temperature. The slope of the plot of ln[thin space (1/6-em)]qe versus ε2 gives B (mol2 kJ−2), and the intercept yields the adsorption capacity, qm. For the D–R isotherm equation, the mean free energy of adsorption (Ea), defined as the free energy change when 1 mol of an ion is transferred from infinity in solution to the surface of the adsorbent, was calculated from the B value using the following relation:
 
image file: c5ra03395k-t2.tif(5)

3. Results and discussion

3.1 Adsorbents characterisation

Detailed results of the characterization of all MWCNT used in this paper are given in our previous work Kragulj et al.2 Consequently, only the main characteristics of the investigated MWCNT are given in Table 2. Briefly, OMWCNT had a high carbon content (99.8%) reflecting its high purity and hydrophobicity. Functionalisation increased the content of phenolic and carboxyl groups from OMWCNT to FMWCNT6h (0.014 to 1.296 mmol g−1, respectively), thus increasing their polarity. In addition, SSA and porosity increased by acid treatment from OMWCNT (61.3 m2 g−1 and 0.974 cm3 g−1, respectively) to FMWCNT6h (600 m2 g−1 and 4.223 cm3 g−1, respectively). This result is in agreement with Asedegbega-Nieto et al.29 who have also observed an SSA increase after HNO3 treatment. In our particular case the most likely explanation is that the functionalization reaction has resulted in partial nanotube opening (making the normally inaccessible hollow inner channel available for N2 adsorption) and/or partial graphitic platelet exfoliation. Comparing the increase in SSA with the increase in the BJH pore volume reveals that the process starts with exfoliation, which increases the specific surface area significantly without introducing many new pores. Further HNO3 treatment completes the nanotube wall opening process. As a result, the inner channel becomes accessible to N2, which results in a major increase in both SSA and mesopore volume. This hypothesis is in agreement with the findings of Rosca et al.30 and derivative works discussing harsh MWCNT oxidation experiments.
Table 2 Structural and surface properties of all investigated MWCNT
Property OMWCNT FMWCNT3h FMWCNT6h
BET (m2 g−1) 61.3 269 600
BJH pore volume (cm3 g−1) 0.974 1.36 4.223
Micropore volume – HK method (cm3 g−1) 0.0391 0.107 0.388
C-content (%) 99.8 81.8 75.4
Carboxylic groups (mmol g−1) 0.208 0.671
Lactonic groups (mmol g−1) 0.005 0.075 0.007
Phenolic groups (mmol g−1) 0.009 0.517 0.618
Total acidity (mmol g−1) 0.014 0.800 1.296
pHpzc 6.9 2.9 2.2


Regarding the micropore volume, previous characterization using t-test method2 showed no presence of micropores. However, additional assessment using HK method showed the presence of micropores in all sorbents investigated (Table 2). The micropore volume increased from 0.0391 cm3 g−1 for OMWCNT to 0.388 cm3 g−1 for FMWCNT6h.

Based on the results of the Boehm titration, the number of oxygenated acidic functional groups increase from OMWCNT to FMWCNT6h. Thus, it has affected to pHpzc which gradually decreases from 6.9 to 2.2 for OMWCNT and FMWCNT6h, respectively, due to dissociation of surface acidic functional groups. Similar results were obtained for pHpzc for OMWCNT and FMWCNT from Lee et al.31

3.2 Adsorption isotherms

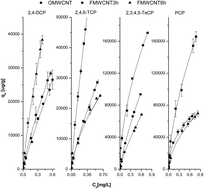
The isotherm data was fitted with both Freundlich and D–R models. Adsorption parameters for both models are presented in Table 3. Freundlich adsorption isotherms for the chlorinated phenols on all investigated MWCNT are presented in Fig. 1.
Table 3 Parameters of Freundlich and D–R models for adsorption of four phenols on three MWCNT
Compounds Adsorbents Freundlich model D–R model log[thin space (1/6-em)]Kd Kd/KOW
Ce (mg l−1)
R2 n KF (mg g−1)/(mg l−1)n R2 qm (mg g−1) B Ea (kJ mol−1) 0.01 SW 0.05 SW 0.5 SW 0.01 SW 0.5 SW
2,4-DCP OMWCNT 0.996 0.902 42.00 0.912 19.27 0.024 4.564 4.46 4.39 4.30 1.46 1.40
FMWCNT3h 0.995 0.830 46.58 0.900 20.63 0.020 5.000 4.39 4.27 4.10 1.43 1.34
FMWCNT6h 0.997 0.803 81.39 0.966 24.15 0.015 5.774 4.58 4.45 4.25 1.50 1.39
2,4,6-TCP OMWCNT 0.999 0.797 44.42 0.972 24.83 0.026 4.385 4.46 4.32 4.12 1.21 1.12
FMWCNT3h 0.998 0.861 125.5 0.970 59.34 0.031 4.016 4.97 4.88 4.74 1.35 1.28
FMWCNT6h 0.996 0.690 34.46 0.974 23.53 0.028 4.226 4.26 4.04 3.73 1.15 1.01
2,3,4,5-TeCP OMWCNT 0.992 0.551 196.1 0.921 142.8 0.018 5.270 5.54 5.22 4.77 1.31 1.14
FMWCNT3h 0.994 0.717 122.0 0.986 78.92 0.033 3.892 5.24 5.04 4.76 1.24 1.13
FMWCNT6h 0.997 0.781 99.87 0.991 72.10 0.037 3.676 5.12 4.97 4.75 1.22 1.12
PCP OMWCNT 0.997 0.620 193.1 0.966 134.6 0.022 4.767 5.61 5.34 4.96 1.10 0.97
FMWCNT3h 0.994 0.480 89.24 0.979 65.50 0.018 5.270 5.39 5.03 4.51 1.05 0.88
FMWCNT6h 0.998 0.618 23.40 0.966 68.60 0.028 4.226 4.70 4.43 4.05 0.92 0.79


image file: c5ra03395k-f1.tif
Fig. 1 Freundlich adsorption isotherms of chlorinated phenols on all investigated MWCNT.

In Fig. 1, the standard deviations of triplicate measurements are denoted by the error bars. The standard deviations of both Freundlich (Kf and n) and D–R model parameters (Ea and qm) were less than 5%. However, the Freundlich model fits the adsorption data slightly better (R2 = 0.992–0.999) than the D–R model (R2 = 0.900–0.991) when coefficients of determination are compared for all adsorption isotherms and all adsorbents (Table 3).

The adsorption of chlorinated phenols was nonlinear (n = 0.480–0.902) due to the heterogeneous adsorption sites of the original and both FMWCNT. This is a consequence of MWCNT ability to readily aggregate and form bundles in the aqueous phase due to strong van der Waals forces along their axes.

Direct comparison of the adsorption affinities could not be made due to their different units, which resulted from the nonlinearity of the adsorption isotherms. Therefore, the distribution coefficients (Kd) given in Table 3 were calculated at three equilibrium concentrations (Ce = 0.01 SW, 0.05 SW and 0.5 SW) based on eqn (2) and the Freundlich parameters given in Table 3.

The adsorption affinities (log[thin space (1/6-em)]Kd at Ce = 0.01; 0.05 and 0.5 SW) of all investigated compounds were in the range from 3.73 to 5.61 l kg−1 and generally are higher for OMWCNT than for both FMWCNT in the case of more hydrophobic 2,3,4,5-TeCP and PCP, while for more polar 2,4-DCP and 2,4,6-TCP no clear trend can be observed. With functionalisation, the saturation capacity qm calculated from the D–R model increases only for 2,4-DCP from OMWCNT to FMWCNT6h (19.27 mg g−1 to 24.15 mg g−1, respectively), while for 2,3,4,5-TeCP and PCP it decreases (Table 3). For 2,4,6-TCP the highest qm value is obtained for FMWCNT3h with no clear trend between qm and the level of CNT functionalisation. On the other hand, the available adsorption sites on the adsorbent could be different for different adsorbates because of their molecular sizes. Therefore, the larger the adsorbate molecular size (2,3,4,5-TeCP and PCP), the lower number of adsorption sites are available. These results are in line with the findings of other authors.32,33 However, no clear trend observed for 2,4,6-TCP indicate that not just the availability of adsorption sites but surface chemistry of adsorbent and physical–chemical parameters of adsorbates play role in the overall adsorption mechanism.

To assess the nature of interaction between phenols and the adsorption sites, mean free energy of adsorption is calculated from the D–R model. Ea value in the range of 1–8 kJ mol−1 indicates physical adsorption, from 8 to 16 kJ mol−1 indicates the adsorption process proceeds by ion-exchange, while its value in the range of 20–40 kJ mol−1 is indicative of the chemisorption.34,35 In our study, Ea values for all investigated adsorbates ranged from 3.676 to 5.774 kJ mol−1. Based on these results, the phenols adsorption process on all MWCNT appears to result from physical adsorption as a consequence of mainly hydrophobic interactions and π–π electron donor–acceptor (EDA) interactions between phenols and the π-electron-rich regions of CNTs.

3.3 Effect of MWCNTs functionalisation on adsorption

Since SSA and porosity are changed significantly during the functionalisation of MWCNT, the influence of SSA and Vmes of all investigated MWCNT on adsorption is analyzed. Fig. 2 presents the relationships between Kd at three equilibrium concentrations (Ce = 0.01; 0.05 and 0.5 SW) and the SSA of the adsorbents for four investigated phenols.
image file: c5ra03395k-f2.tif
Fig. 2 Relationship between SSA of adsorbents and Kd values of investigated phenols.

In general, the investigated phenols can be divided into two groups according to their adsorption behaviour on investigated MWCNT. Namely, larger molecules showed different behaviour from the smaller molecules.

The results clearly show that MWCNT adsorption affinities for 2,3,4,5-TeCP and PCP decreased as SSA increased. The highest adsorption affinities at all concentration levels were obtained for OMWCNT, while increasing both the SSA and mesopore volume for FMWCNT did not result in increasing the Kd values as might be expected.

On the other hand, no clear trend between Kd and SSA was observed for 2,4-DCP and 2,4,6-TCP. At the low concentration levels (Ce = 0.01 SW) adsorption of 2,4-DCP increases from OMWCNT to FMWCNT6h. However, as the concentration of 2,4-DCP increases (Ce = 0.05 SW and 0.5 SW), adsorption affinity shows no clear trend when correlated with SSA. The adsorption affinity for 2,4,6-TCP increases from OMWCNT to FMWCNT3h, but decreases for FMWCNT6h, and demonstrates the same trend at all concentration levels.

These results suggest that both adsorbent and adsorbate properties affect the mode of adsorption of organic compounds on MWCNT. The higher adsorption affinity of OMWCNT for the large molecules such as 2,3,4,5-TeCP and PCP, indicate that mesopore filling is not the dominant mechanism controlling their adsorption and that surface interactions probably play the dominant role. On the contrary, 2,4-DCP and 2,4,6-TCP are relatively small and therefore can penetrate deeper into the mesopores of MWCNT. However, since there is no clear trend between SSA, Vmes and Kd, adsorption of 2,4-DCP and 2,4,6-TCP is probably the result of simultaneous surface interactions and mesopore filling. We suggest that at low concentrations adsorption may result from surface interactions. As concentration of adsorbate increases, the high driving force causes molecules to penetrate deeper into the MWCNT mesopores. However, phenyl and carboxyl groups on FMWCNT (e.g. 47.7 and 51.8%, respectively in FMWCNT6h) may reduce the accessibility of compounds for effective adsorption sites within the mesopores resulting in lower affinity of FMWCNT for phenols. Our results are in line with Yu et al.34 who found that the adsorption depends on SSA and MWCNT mesopores volume. This is also in line with our previous study Kragulj et al.2

The positive correlation between the Kd values of OMWCNT for all tested phenols and their molecular size (R2 = 0.879 at 95% confidence) support the role of surface interactions and contact area between the adsorbent surface and compound during the adsorption process (Fig. 3). This effect is more clearly demonstrated for larger phenols since surface interactions play the dominant role over mesopore filling in the overall adsorption mechanism.


image file: c5ra03395k-f3.tif
Fig. 3 Relationship between the Kd of chlorinated phenols on OMWCNT and the McGowan volume of the molecules.

From the results given above, it can be concluded that the adsorption of chlorinated phenols depends on MWCNT properties such as surface chemistry, SSA and mesopore volume. This conclusion is supported by authors Abdel-Salam and Burk36 who found that the adsorption of PCP rapidly decreases from OMWCNT to FMWCNT, indicating that surface chemistry controls its adsorption.

3.4 Effect of MWCNT surface chemistry on phenols adsorption

Analysis of the Boehm titration (Table 2) for both FMWCNT indicates the presence of oxygen functional groups after functionalisation which increases the surface polarity. In order to investigate the influence of oxygen containing functional groups on MWCNT adsorption properties, Kd values (at 0.5 SW) for all the examined phenols were normalized by SSA. The relationship between Kd/SSA and total acidity groups are shown in Fig. 4. The same trend was observed at the lower concentration ranges (data not shown).
image file: c5ra03395k-f4.tif
Fig. 4 Relationship between Kd/SSA and total acidity groups on MWCNT surface.

These results illustrate that once the influence of SSA is eliminated, OMWCNT have higher adsorption affinities for all investigated phenols compared to both FMWCNT. Functionalisation of OMWCNT increases the content of carboxyl groups to 26.0 and 51.8% for FMWCNT3h and FMWCNT6h respectively, while phenolic groups content were 64.6 and 47.7% respectively. Thus, the reason for less adsorption on both FMWCNT may be due to electrostatic repulsion between disassociated species of phenols and disassociated functional groups on the FMWCNT surface. The data indicates that both FMWCNT have pHpzc in the range from 2.2 to 2.9, such that the oxygen functional groups on the FMWCNT surface at the experimental pH of 6.8 were negatively charged. The occurrence of disassociated acid species such as phenols depends on the pH solution in relation to their dissociation constant (pKa). When pH > pKa, disassociated species dominate for organic acids, whereas when pH < pKa associated spaces are dominant. The pKa for all investigated phenols range from 6.40 to 4.80, except for 2,6-DCP (pKa = 7.90), which shows that the disassociated species are dominant at pH 6.8. Thus for all phenols except 2,6-DCP, experimental pH > pKa and pHpzc indicating that both FMWCNT and adsorbate are negatively charged and electrostatic repulsion is one of the dominant mechanisms. Hence, adsorption decreases as a result of electrostatic repulsion between the disassociated chlorinated phenols and disassociated functional groups on the surface of both FMWCNT.

In contrast, for OMWCNT and all the investigated phenols except for 2,4-DCP, the high adsorption may be partially result from electrostatic attraction where conditions are such that pHpzc > experimental pH > pKa.

The presence of carboxyl and hydroxyl groups has been reported to inhibit the adsorption of phenolic compounds,36 whereby the adsorptive properties of carbonaceous material were determined mostly by the chemical composition of the surface. Pan and Xing37 found valuable data derived by comparing solution pH, the pKa of the organic chemical, and the CNT pHpzc, which indicated the same results.

3.5 Effect of phenol hydrophobicity on adsorption

In order to examine the role of hydrophobic interactions in the overall adsorption of investigated phenols on all MWCNT, the hydrophobicity of the molecules (log[thin space (1/6-em)]KOW) was correlated with log[thin space (1/6-em)]Kd (at 0.5 SW) (Fig. 5).
image file: c5ra03395k-f5.tif
Fig. 5 Relationships between log[thin space (1/6-em)]Kd of phenols on all investigated MWCNT and their log[thin space (1/6-em)]KOW.

A positive correlation between molecular hydrophobicity and adsorption affinity was obtained only for OMWCNT, indicates that hydrophobic interactions mainly control the adsorption of phenols on OMWCNT. The only exception was 2,4,6-TCP, which had a slightly lower adsorption than 2,6-DCP. The correlation coefficient was R2 = 0.856 at 95% confidence. Thus, the most hydrophobic adsorbent, OMWCNT, has relatively high Kd values for all investigated phenols, whereas FMWCNT6h shows much lower adsorption affinity.

As expected, the other two FMWCNT did not show a significant correlation between log[thin space (1/6-em)]Kd and log[thin space (1/6-em)]KOW, implying that hydrophobic interactions cannot explain adsorption between investigated phenols on functionalised MWCNT, indicating the role of other mechanisms. The influence of negative charge on the surface of both FMWCNT and negatively charged phenols does not allow for the formation of hydrophobic interactions between FMWCNT and phenol molecules. Another explanation is the adsorption of water molecules to the oxygen containing functional groups on the surface of the oxidized MWCNT by the means of hydrogen bonding,38 known as the “solvent effect”, thus blocking potential adsorption sites for organic molecules.

3.6 Effect of π–π interactions in phenols adsorption

An important feature of most carbon adsorbents is their aromaticity, with the presence of delocalized π electrons allowing the possible formation of π–π interactions with the adsorbate. In order to investigate the influence of π–π interactions in phenols adsorption on MWCNT, Kd values (at 0.01 and 0.5 SW) of all examined phenols were normalized with their respective hydrophobicities, KOW (Table 3). Fig. 6 presents the correlations between Kd/KOW values (at 0.01 and 0.5 SW) and the electron-acceptor properties of the investigated phenols on all MWCNT. Determination coefficients for Kd and electron acceptor properties were R2 = 0.999, 0.831 and 0.988 at 0.01 SW and R2 = 0.961, 0.790 and 0.997 at 0.5 SW for OMWCNT, FMWCNT3h and FMWCNT6h, respectively (Fig. 6). In general, the obtained Kd/KOW values for all MWCNT decreased in the following order: 2,4-DCP > 2,3,4,5-TeCP > 2,4,6-TCP > PCP. The obtained order is negatively correlated with electron-acceptor property of molecules and consequently positively correlated with electron-donor property of molecules. Thus, the most pronounced π–π interactions were observed for the 2,6-DCP compound on all MWCNT, while the least pronounced π–π interactions were observed for PCP.
image file: c5ra03395k-f6.tif
Fig. 6 Relationship between the Kd/KOW values and electron-acceptor properties of phenols.

These results can be explained as follows: the introduction of oxygen containing functional groups on the surface of OMWCNT can localize the π electrons, and consequently, remove them from the π-electron system from both FMWCNT (total acidities of 0.800 and 1.296 mmol g−1 for FMWCNT3h and FMWCNT6h, respectively), making them better electron acceptors. Therefore, as electron-acceptor properties of phenols increase, impact of π–π EDA interactions decreases. The same trend was observed for OMWCNT, since OMWCNT could be either electron-donors or acceptors.37,39 In this case OMWCNT has electron-acceptor properties and indicates decrease of π–π EDA interactions as electron acceptor properties of chlorinated phenols increase.

It is important to note that π–π EDA interactions are specific and are favoured at low initial concentration when molecules are bind to the higher energy site. Thus, for all adsorbents, at the low initial concentration (0.01 SW) the Kd/KOW values obtained are higher than the Kd/KOW value at higher initial concentrations (0.5 SW) (Table 3). The higher Kd/KOW values at low initial concentrations imply that π–π EDA are most pronounced, but as the phenol concentration increases, the role of other mechanisms such as electrostatic repulsion and hydrophobic interactions for both FMWCNT and OMWCNT become more significant. It can therefore be concluded that the surface chemical MWCNT properties influence the type of interactions present in phenols adsorption, as suggested by other authors.9,16,40,41

3.7 Comparison of the adsorption of chlorinated phenols by CNTs and activated carbon (AC)

In order to compare the adsorption affinities of the investigated chlorinated phenols on CNTs and ACs, the Kd values obtained from our experiments at three equilibrium concentrations (Ce = 0.01 SW, 0.05 SW and 0.5 SW) were compared with Kd values calculated from the Freundlich model based on literature data42–44 (Tables 3 and 4). The adsorption affinities of all investigated compounds on CNTs and ACs were similar and in the range from 2.30 to 6.26 l kg−1. In general, Kd values are higher for CNTs than for ACs in the case of the more polar chlorinated phenols such as 2,4-DCP and 2,4,6-TCP, whereas for the more hydrophobic 2,3,4,5-TeCP and PCP, no clear trend can be observed. CNTs therefore have the potential to be better adsorbents for air purification and water treatment for more polar phenols. Since more polar organic compounds are difficult to remove during water treatment, this could be a significant advantage for CNTs in comparison with ACs. In addition, authors Pan and Xing37 indicated that CNTs have been shown to be more efficient adsorbents than AC and other adsorbents, with higher adsorption capacities, shorter equilibrium times, higher adsorption energies, and easier and more efficient regeneration. It should be emphasized that CNTs can be regenerated, maintaining their high adsorption efficiency. Thus, they last longer than ACs, and with proper regeneration, the operational expense for CNTs in water treatment may be lowered.
Table 4 Adsorption affinities calculated from the Freundlich model based on literature data42–44
Compounds n KF (mg g−1)/(mg l−1)n log[thin space (1/6-em)]Kd
Ce (mg l−1)
0.01 SW 0.05 SW 0.5 SW
2,4-DCP 0.15–0.35 (ref. 42) 141–157 3.74–4.12 3.15–3.67 2.30–3.02
0.09–0.22 (ref. 43) 263–297 3.92–4.18 3.28–3.64 2.37–2.86
0.127 (ref. 44) 226 3.911 3.301 2.428
2,4,6-TCP 0.29–0.40 (ref. 42) 130–219 4.47–4.80 3.98–4.38 3.27–3.78
0.09–0.26 (ref. 43) 346–380 4.72–4.91 4.08–4.39 3.17–3.65
0.09 (ref. 44) 329 4.69 4.06 3.15
2,3,4,5-TeCP 0.09–0.18 (ref. 43) 314–323 5.99–5.95 5.35–5.38 4.44–4.56
PCP 0.39–0.42 (ref. 42) 100–260 5.52–5.91 5.09–5.51 4.48–4.92
0.11–0.20 (ref. 43) 320–280 6.26–6.13 5.64–5.57 4.75–4.77


4. Conclusion

We can conclude that all investigated MWCNT are good adsorbents for the removal of chlorinated phenols from aqueous solutions. The adsorption of chlorinated phenols onto the oxidized MWCNT was less than the pristine MWCNT, indicating that surface chemical properties, rather than SSA and pore volumes, play the more important role in determining the final MWCNT adsorption ability. The lower adsorption of phenols on both FMWCNT is a result of electrostatic repulsion between disassociated chlorinated phenols and disassociated functional groups on the surface of both FMWCNT.

In addition, the adsorption of chlorinated phenols depends on the physical–chemical properties of the molecules such as pKa, hydrophobicity, electron donor–acceptor properties. It is important to note that the degree of functionalisation effects the formation of π–π interactions. Thus the presence of carboxylic and phenolic groups on MWCNT surface increases the adsorption of electron-donors and decreases the adsorption of electron-acceptors.

More laboratory studies are required to systematically investigate the adsorption of phenols and other organic compounds with different functional groups, hydrophobicities, and electron-donor and electron-acceptor properties on different oxidised MWCNT, in order to better understand their behaviour and subsequent fate in the environment.

Acknowledgements

This work has been produced with the financial assistance of the EU (Project MATCROSS, HUSRB 1002/214/1 88). The financial support of the TAMOP-4.2.2.A-11/1/KONV-2012-0060 and the OTKA NN 110676 projects is acknowledged. The contents of this document are the sole responsibility of the University of Novi Sad Faculty of Sciences and can under no circumstances be regarded as reflecting the position of the European Union and/or the Managing Authority. Additionally, the authors acknowledge the financial support of the Ministry of Education, Science and Technological Development of the Republic of Serbia (Projects III43005 and TR37004).

References

  1. S. Iijima, Nature, 1991, 354, 56 CrossRef CAS.
  2. M. Kragulj, J. Tričković, B. Dalmacija, Á. Kukovecz, Z. Kónya, J. Molnar and S. Rončević, Chem. Eng. J., 2013, 225, 144 CrossRef CAS PubMed.
  3. K. Yang, L. Z. Zhu and B. S. Xing, Environ. Sci. Technol., 2006, 40, 1855 CrossRef CAS.
  4. S. Gotovac, H. Honda, Y. Hattori, K. Takahashi, H. Kanoh and K. Kaneko, Nano Lett., 2007, 7, 583 CrossRef CAS PubMed.
  5. J. Hilding, E. A. Grulke, S. B. Sinnott, D. L. Qian, R. Andrews and M. Jagtoyen, Langmuir, 2001, 17, 7540 CrossRef CAS.
  6. C. S. Lu, Y. L. Chung and K. F. Chang, Water Res., 2005, 39, 1183 CrossRef CAS PubMed.
  7. R. Q. Long and R. T. Yang, J. Am. Chem. Soc., 2001, 123, 2058 CrossRef CAS.
  8. C. J. M. Chin, L. C. Shih, H. J. Tsai and T. K. Liu, Carbon, 2007, 45, 1254 CrossRef CAS PubMed.
  9. Q. Liao, J. Sun and L. Gao, Carbon, 2008, 46, 553 CrossRef CAS PubMed.
  10. X. J. Peng, Y. H. Li, Z. K. Luan, Z. C. Di, H. Y. Wang, B. H. Tian and Z. P. Jia, Chem. Phys. Lett., 2003, 376, 154 CrossRef CAS.
  11. Q. Liao, J. Sun and L. Gao, Colloids Surf., A, 2008, 312, 160 CrossRef CAS PubMed.
  12. K. Laszlo, E. Tombacz and C. Novak, Colloids Surf., A, 2007, 306, 95 CrossRef CAS PubMed.
  13. W. M. Zhang, Q. J. Zhang and B. C. Pan, J. Colloid Interface Sci., 2007, 306, 216 CrossRef CAS PubMed.
  14. C. M. Castilla, Carbon, 2004, 42, 83 CrossRef PubMed.
  15. Council Directive 2000/60/EC of 23 October 2000 establishing a framework for Community action in the field of water policy Official Journal L 327/1, 22.12.2000., pp. 1–72.
  16. R. Arasteh, M. Masoumi, A. M. Rashidi, L. Moradi, V. Samimi and S. T. Mostafavi, Appl. Surf. Sci., 2010, 256, 4447 CrossRef CAS PubMed.
  17. D. Lin and B. Xing, Environ. Sci. Technol., 2008, 42, 7254 CrossRef CAS.
  18. K. Yang, W. Wu, Q. Jing and L. Zhu, Environ. Sci. Technol., 2008, 42, 7931 CrossRef CAS.
  19. A. Pacholczyk, A. P. Terzyk, M. Wisniewski, P. A. Gauden, R. P. Wesolowski, S. Furmaniak, A. Szczes, E. Chibowski and B. Kruszka, J. Colloid Interface Sci., 2011, 361, 288 CrossRef CAS PubMed.
  20. A. Tóth, A. Törőcsik, E. Tombácz and K. László, J. Colloid Interface Sci., 2012, 387, 244 CrossRef PubMed.
  21. J. G. Yu, X. H. Zhao, H. Yang, X. H. Chen, Q. Yang, L. Y. Yu, J. H. Jiang and X. Q. Chen, Sci. Total Environ., 2014, 482–483, 241 CrossRef CAS PubMed.
  22. C. Niederer, R. P. Schwarzenbach and K. U. Goss, Environ. Sci. Technol., 2007, 41, 6711 CrossRef CAS.
  23. L. Sprunger, E. W. J. Acree and H. A. Abraham, J. Chem. Inf. Model., 2007, 47, 1808 CrossRef CAS PubMed.
  24. T. Kanyó, Z. Kónya, A. Kukovecz, F. Berger, I. Dékány and I. Kiricsi, Langmuir, 2004, 20, 1656 CrossRef.
  25. H. P. Boehm, Carbon, 2002, 40, 145 CrossRef CAS.
  26. F. Yu, J. Ma and Y. Wu, J. Hazard. Mater., 2011, 192, 1370 CrossRef CAS PubMed.
  27. Y. Tian, B. Gao, Y. Wang, V. L. Morales, R. M. Carpena, Q. Huang and L. Yang, J. Hazard. Mater., 2012, 213–214, 265 CrossRef CAS PubMed.
  28. W. J. Weber and H. A. Huang, Environ. Sci. Technol., 1996, 30, 881 CrossRef CAS.
  29. E. Asedegbega-Nieto, M. Pérez-Cadenas, J. Carter, J. A. Anderson and A. Guerrero-Ruiz, Nanoscale Res. Lett., 2011, 6, 353 CrossRef PubMed.
  30. I. D. Rosca, F. Watari, M. Uo and T. Akasaka, Carbon, 2005, 43, 3124 CrossRef CAS PubMed.
  31. S. Lee, Z. Zhang, X. Wang, L. D. Pfefferle and G. L. Haller, Catal. Today, 2011, 164, 68 CrossRef CAS PubMed.
  32. M. Sander and J. J. Pignatello, Environ. Sci. Technol., 2005, 39, 1606 CrossRef CAS.
  33. R. M. Allen-King, P. Grathwohl and W. P. Ball, Adv. Water Resour., 2002, 25, 985 CrossRef CAS.
  34. F. Yu, Y. Wu and J. Ma, J. Hazard. Mater., 2012, 237–238, 102 CrossRef CAS PubMed.
  35. M. S. Onyangoa, Y. Kojima, O. Aoyi, E. C. Bernardo and H. Matsuda, J. Colloid Interface Sci., 2004, 279, 341 CrossRef PubMed.
  36. M. Abdel Salam and R. C. Burk, Appl. Surf. Sci., 2008, 255, 1975 CrossRef CAS PubMed.
  37. B. Pan and B. S. Xing, Environ. Sci. Technol., 2008, 42, 9005 CrossRef CAS.
  38. A. Dąbrowski, P. Podkoscienly, Z. Hubicki and M. Barczak, Chemosphere, 2005, 58, 1049 CrossRef PubMed.
  39. W. Chen, L. Duan, L. Wang and D. Zhu, Environ. Sci. Technol., 2008, 42, 6862 CrossRef CAS.
  40. G. G. Stavropoulos, P. Samaras and G. P. Sakellaropoulos, J. Hazard. Mater., 2008, 151, 414 CrossRef CAS PubMed.
  41. R. D. Vidic, C. H. Tessmer and L. J. Uranowski, Carbon, 1997, 35, 1349 CrossRef CAS.
  42. R. A. Dobbs and J. M. Cohen, Carbon adsorption isotherm of toxic organics, U.S. Environmental Protection Agency, EPA-600/8-80-023, 1980 Search PubMed.
  43. O. P. Nelson and M. Yang, Water Environ. Res., 1995, 67, 892 CrossRef.
  44. Q. S. Liu, T. Zheng, P. Wang, J. P. Jiang and N. Li, Chem. Eng. J., 2010, 157, 348 CrossRef CAS PubMed.

This journal is © The Royal Society of Chemistry 2015
Click here to see how this site uses Cookies. View our privacy policy here.