 Open Access Article
Creative Commons Attribution 3.0 Unported Licence
Crystallization and morphology development in polyethylene–octakis(n-octadecyldimethylsiloxy)octasilsesquioxane nanocomposite blends
E. L.
Heeley
*a,
D. J.
Hughes
b,
P. G.
Taylor
a and
A. R.
Bassindale
a
aDepartment of Life, Health and Chemical Sciences, Open University, Walton Hall, Milton Keynes, MK7 6AA, UK. E-mail: Ellen.Heeley@open.ac.uk
bWMG, University of Warwick, Coventry, CV4 7AL, UK
First published on 8th April 2015
Abstract
The dispersion, morphology and crystallization kinetics of low density polyethylene (LDPE)–octakis(n-octadecyldimethylsiloxy)octasilsesquioxane (POSS) nanocomposite blends was investigated. Novel octakis(dimethylsiloxy)octasilsesquioxane (Q8M8H) molecules were octafunctionalised with octadecyl alkyl-chains (Q8C18) and blended with 0.25–10 wt% loadings into a commercial LDPE. Time-resolved Small- and Wide-Angle X-ray Scattering (SAXS/WAXS), thermal and microscopy techniques were used to elucidate the POSS dispersal, crystalline morphology and crystallization kinetics of the host polymer. POSS particles dispersed well in the host polymer up to 5% wt loading and acted as nucleating agents without disrupting the crystal lattice of the PE. Above 5% wt loading the POSS aggregated, reduced the bulk crystallinity and hindered the crystallization process. The aggregation of POSS is attributed to increased POSS–POSS interactions whereby the POSS molecules self-assemble in an interdigitated manner. The results were compared with an analogous LDPE–T8C18 POSS cage blend at 10% wt loading. In complete contrast, the T8 POSS particles disperse well in the host polymer being effective nucleating agents and increased the bulk crystallinity. This may have important implications in the processing of polyolefins where the T8 system acts to accelerate crystallization whereas the Q8 system retards it.
Introduction
In the development of nanocomposite functional materials a group of nanosized inorganic–organic hybrid materials known as Polyhedral Oligomeric Silsesquioxanes (POSS)1,2 with the general nomenclature (RSiO3/2)8, have found widespread use as nanoparticle fillers in polymer materials. There are many studies covering the synthesis and blending of polymer–POSS composites.3–10 However, the fundamental issue in developing nanoparticulate composites is the effective dispersal of the nanofiller and hence understanding the effects on the materials properties. These unanswered questions, remain a barrier to the uptake of nanoparticulates in industrial applications.Cubic POSS molecules denoted as T8 cages, can be octafunctionalised with pendant R groups attached at the silicon corners of the cage,8,11,12 and are the most commonly synthesized and applied systems. However, the analogous Q8 structures where Q8 = R8(SiO2)8, are now gaining equal attention as potential polymer nanofillers. The Q8 cages have additional OSiMe2 spacer groups at each corner of the cage and can be modified by attaching R groups of varying molecular structure to the silicon of the spacer group.13–17
The chemistry of the R groups attached to the POSS cage plays an integral part in the compatibility and hence dispersal of the molecule with the host polymer. For example, non-polar groups such as alkyl and aryl groups can serve as compatible components for polyolefins18–22 due to their comparable chemistry, whereas polar groups encourage dispersal in polymers such as polyesters, polyamides, epoxides and polyurethanes.23–31 The addition of POSS as nanoparticulate fillers into polymers can bring about changes in the polymer's physical, chemical and mechanical properties, e.g. increasing glass transition temperatures, tensile and impact strength, morphology, crystallinity and thermal stability.5,7,9,17–30 These changes are usually attributed to the dispersal of the POSS molecules in the amorphous matrix of the host polymer. The dispersal of POSS is dependent on the wt% loading in the host polymer as well as the length and chemistry of the R groups attached to the cage. Dispersed POSS can act as nucleation sites enhancing the polymers crystallization rate under both isothermal and non-isothermal conditions.18–22,32 However, increasing the wt% loading of POSS can cause aggregation of the POSS crystals in the polymer matrix, which then retard the crystallization process by hindering the molecular motion of the polymer chains.18,21,22
Many investigations have looked at the influence of varying the length of the alkyl-chain R groups on POSS dispersal, crystallization and physical properties in polyolefins.19,33–35 Here, the length of the alkyl-chain played a fundamental role in the POSS dispersion and crystallization kinetics of the host polymer, although the length of the alkyl-chains investigated were relative short (isooctyl being the longest). Recently, we have reported22 on the dispersal, crystallization kinetics and morphology of a series T8 POSS molecules with long linear alkyl-chain R groups (C8, C12 and C18) blended at 10% wt fraction into a commercial low density polyethylene (LDPE). The compatibility and dispersal of the POSS molecules increased with increasing alkyl-chain length of the R groups being attributed to improved interaction with the host polymer chains. The POSS molecules acted as nucleating agents increasing the crystallization kinetics and influencing the final polymer morphology.
However, it should be noted that the above cited investigations predominantly report the influence of POSS T8 cages as nanoparticulate fillers. Fewer reports have detailed the effects of the analogous Q8 cages in the same manner. The OSiMe2 spacer groups in Q8 cage systems, give the R groups greater flexibility in arranging themselves around the POSS core and thus allowing a more efficient packing manner to be achieved, in comparison to the T8 cage systems. The R groups on one POSS molecule interdigitate to a degree with those on another POSS molecule.15,16 Moreover, the degree of interdigitation where the R groups are linear alkyl-chains is seen to increase as the alkyl-chain length increases.15
Recently, Frone36 and Perrin37 investigated the morphology, thermal and mechanical properties of low density polyethylene (LDPE) blended with a series of Q8 POSS cages functionalised with linear (up to C8) and branched alkyl-chain substituents. Interestingly, their studies showed that POSS dispersal increased with increasing alkyl-chain length but, the crystal structure of LDPE was unaltered indicating that the POSS were distributed in the amorphous fraction of the polymer. Generally, they saw a small increase in crystallinity in the composites with linear alkyl-chain groups but the melting and crystallization temperatures of the blends compared with neat LDPE were unchanged, suggesting that the POSS do not act as nucleating agents.
However, to our knowledge, no studies have detailed the crystallization kinetics and morphology development of polyethylene–Q8 POSS blends where the Q8 cages have long linear alkyl-chain R groups, that is, beyond C8. To address this, we have blended LDPE with novel Q8 POSS cages octafunctionalised with octadecyl, C18, alkyl-chains, denoted as Q8C18 (octakis(n-octadecyldimethylsiloxy)octasilsesquioxane). Previously, the crystal structure and packing morphology of the pure Q8C18 POSS has been fully characterised and compared with the equivalent T8C18 POSS cage system.16,38 Both cage systems are crystalline solids but, the molecules self-assemble and pack in a significantly different manner. The long alkyl-chain R groups in both Q8 and T8 cage systems align in an axial disposition from the POSS core giving a ‘rod-like’ self-assembled lamellar packing morphology. However, alkyl chains in the Q8 cage system can interdigitate and pack efficiently,15,16 whereas those in the T8 system do not. Recently, Hayakawa39,40 observed similar self-assembled lamellar type packing morphologies in a series of mono-substituted POSS cages with long aliphatic chains C6, C12 and C18. In all these cases, the packing length-scales correlate to the overall length-scale of the molecule.
Fig. 1 shows the interdigitated packing morphology model for the Q8C18 POSS cage system with associated dimension of the molecule and repeat packing distance.16
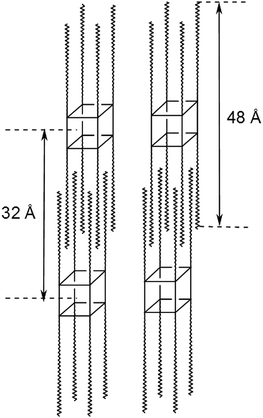 | ||
| Fig. 1 Packing morphology of the Q8C18 POSS cage system with associated molecular length-scale (48 Å) and repeat interdigitated packing distance (32 Å).16 | ||
Here, a series of POSS–LDPE blends have been prepared with loadings between 0.25 and 10 wt% of Q8C18 POSS. Using thermal analysis, scanning electron microscopy (SEM) and X-ray diffraction techniques (XRD) we have investigated the dispersion and crystallinity in the blends. Furthermore, isothermal crystallization kinetics, structure development and lamellar morphology of the POSS–LDPE blends were investigated using time-resolved small- and wide-angle X-ray scattering (SAXS/WAXS). We have chosen these techniques for their complimentary nature and power to elucidate the dispersion and the crystallization kinetics of the PE–POSS blends. The scattering techniques are highly sensitive to the dispersal of the POSS in the polymer matrix and reveal the crystalline structure of the blends over a large length-scale; WAXS giving crystal structure of the crystalline lattice and SAXS giving information on the long-range ordering of both the pure PE and POSS and the subsequent blends. These techniques are coupled with SEM and DSC analysis which serve to expand and corroborate the findings from the X-ray analysis.
A comprehensive data set is presented showing how the wt% loading of Q8C18 POSS effects the crystallinity, crystallization kinetics, crystalline morphology and dispersal of the blends compared with the pure LDPE host polymer. The results are then briefly compared and contrasted with the analogous LDPE–T8C18 POSS cage blend at one composition (10% wt loading).22 This has allowed us to ascertain how the packing and structure differences between the two POSS systems influences the final crystallization and morphology of the host polymer. Hence, indicating which POSS system has the best compatibility and effective nucleating capability for use as potential nanoparticles in polyolefin polymers.
Experimental
Materials
The general synthesis of octakis(n-octadecyldimethylsiloxy)octasilsesquioxane, Q8C18, was achieved by the hydrosilylation of octakis(dimethylsiloxy)octasilsesquioxane with 1-octadecene using Karstedt's catalyst, as detailed in Fig. 2. The full synthetic route, conditions and characterisation of Q8C18 has been reported in detail elsewhere.16 | ||
| Fig. 2 General synthetic route for the Q8C18 POSS cage system.16 | ||
The Q8C18 POSS system was blended with a well characterised commercial low density polyethylene, Lupolen 1840H (GPC Mw = 250![[thin space (1/6-em)]](https://www.rsc.org/images/entities/char_2009.gif) 000 g mol−1, Mw/Mn = 13.5, Tm (DSC) ≈ 109 °C), provided by BASF, having both short-chain (30 CH3/1000 C) and long-chain branching.41–43 LDPE–Q8C18 POSS composites were prepared using a solution compounding method as described previously.22,44 The POSS and LDPE were dissolved in CHCl3 and para-xylene solvents respectively, at 95 °C. The two solutions were combined and the resulting mixture stirred at 95 °C for 2 h. The blends produced were then vacuum dried at 130 °C for 10 h. Six blends were prepared with 0.25, 0.5, 1, 2, 5, and 10% wt fraction of Q8C18 POSS and are identified according to the % wt fraction they contained: PE–Q80.25, PE–Q80.5, PE–Q81, PE–Q82, PE–Q85, and PE–Q810.
000 g mol−1, Mw/Mn = 13.5, Tm (DSC) ≈ 109 °C), provided by BASF, having both short-chain (30 CH3/1000 C) and long-chain branching.41–43 LDPE–Q8C18 POSS composites were prepared using a solution compounding method as described previously.22,44 The POSS and LDPE were dissolved in CHCl3 and para-xylene solvents respectively, at 95 °C. The two solutions were combined and the resulting mixture stirred at 95 °C for 2 h. The blends produced were then vacuum dried at 130 °C for 10 h. Six blends were prepared with 0.25, 0.5, 1, 2, 5, and 10% wt fraction of Q8C18 POSS and are identified according to the % wt fraction they contained: PE–Q80.25, PE–Q80.5, PE–Q81, PE–Q82, PE–Q85, and PE–Q810.
Thermal analysis
Differential Scanning Calorimetry (DSC) was performed on each blend using a Mettler Toledo DSC822 instrument under argon gas (flow rate of 80 mL min−1), calibrated with indium metal. Samples (5–20 mg) were loaded into standard 40 μL aluminium pans and heat–cool cycles were run from 25 to 130 °C at a rate of 10 °C min−1. All thermograms and data analysis presented was obtained from the second heat–cool cycle. From the heating cycle the degree of crystallinity Xc, of each blend was determined from the relationship: | (1) |
Scanning electron microscopy (SEM)
A Zeiss Supra 55VP FEGSEM fitted with an Oxford Instruments Aztec Energy Dispersive Spectroscopy (EDS) system was used to obtain information on the dispersion of POSS, surface texture and elemental composition in the blends at 20 °C. The SEM operating voltage was 10 keV. Samples were sputter coated with gold prior to SEM analysis.X-ray scattering measurements and data analysis
Static X-ray diffraction (XRD) patterns at 25 °C, were collected on a PANalytical Empyrean diffractometer using Co Kα radiation (λ = 1.79 Å) operating at 40 kV and 40 mA. Samples mounted in flat, circular holders were rotated during the measurement (0.5 s−1). Data were collected on a 1D PIXcel detector system in continuous scanning mode over a scattering angle of 2θ = 5–40°.Time-resolved Small- and Wide-Angle X-ray Scattering (SAXS/WAXS) measurements were performed at the I22 beamline (Diamond Light Source, Didcot, UK),46 with an X-ray energy of 12.4 keV. SAXS data were recorded with a 2D gas-filled multiwire detector47 located at a distance of 3.5 m from the sample position and calibrated using an oriented rat-tail collagen specimen. A vacuum chamber was positioned between the sample position and SAXS detector reducing air scattering and absorption. Simultaneous WAXS data were recorded using a 1D detector48 situated at the sample position and was calibrated with high density polyethylene.
Isothermal crystallization experiments were performed using a Linkam DSC600 heating stage which was positioned vertically in the incident X-ray beam before the vacuum chamber, as described previously.22,49 Samples were sealed in aluminium DSC pans fitted with mica windows (25 μm thickness, 7 mm Ø) and positioned in the heating stage. All samples were heated to 130 °C, held for three minutes and then quenched to the crystallization temperature Ti, at a rate of 50 °C min−1. Simultaneous SAXS/WAXS data collection was started once the crystallization temperature was reached and continued throughout the crystallization process. The data was obtained at a rate of between 8 and 15 s per frame depending on Ti, with a 10 μs wait time.
All SAXS/WAXS data were corrected for sample thickness, transmission, background scattering and any detector spatial distortion. The 2D SAXS data were reduced to 1D intensity plots, I(q, t), by sector averaging symmetrically around the meridian by a fixed angle and radius, q.43,50 The peak positions of the 1D SAXS/WAXS data were obtained using a Lorentzian fitting function.
For the isothermal crystallization measurements, the invariant, Qs, was obtained from the 1D SAXS data where:
 | (2) |
Avrami plots51,52 were obtained for the isothermal crystallization measurements from Qs, where the Avrami model takes the general form:
| 1 − Xs(t) = e−ktn | (3) |
ln(ln[1 − Xs(t)]) = n![[thin space (1/6-em)]](https://www.rsc.org/images/entities/char_2009.gif) ln ln![[thin space (1/6-em)]](https://www.rsc.org/images/entities/char_2009.gif) t + ln t + ln![[thin space (1/6-em)]](https://www.rsc.org/images/entities/char_2009.gif) k k | (4) |
Results and discussion
Thermal analysis
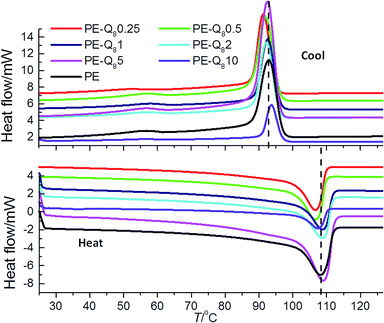
The melting and crystallization behaviour of the PE–POSS blends was investigated using DSC. The heat–cool thermograms of pure PE and PE–POSS blends are shown in Fig. 3. From the thermograms the melting temperatures Tm, crystallization temperatures Tc1, and percent crystallinity (determined from the enthalpy of fusion (eqn (1)) that is, ΔHc1 at Tc1), were obtained and collated in Table 1.| Sample | T m /°C | T c1/°C | ΔHc1/J g−1 at Tc1/°C | ΔHc2/J g−1 at Tc2/°C | % crystallinity |
|---|---|---|---|---|---|
| Pure LDPE | 109 | 93 | 56 | 2.8 | 36.7 |
| PE–Q80.25 | 107 | 91 | 52 | 2.6 | 39.0 |
| PE–Q80.5 | 107 | 92 | 58 | 2.3 | 38.6 |
| PE–Q81 | 109 | 93 | 58 | 1.9 | 35.0 |
| PE–Q82 | 109 | 92 | 57 | 1.3 | 34.5 |
| PE–Q85 | 109 | 93 | 57 | 1.2 | 36.5 |
| PE–Q810 | 108 | 94 | 57 | 0.9 | 31.1 |
For pure PE the values of Tm and Tc are ∼109 °C and ∼93 °C respectively, as indicated by the dashed lines on the thermogram plots in Fig. 3. The PE–POSS blends do not show any significant deviations in the values of Tm and Tc compared with pure PE. Here, it is worth noting that for the pure Q8C18 POSS cage system Tm = 45.5 °C and Tc = 29.1 °C (as previously reported),16 but there is no evidence of these individual transitions in any of the PE–POSS thermograms in Fig. 3. Hence, this suggests that the POSS is dispersed in the PE matrix and may not be aggregated into crystals to any large degree.
Similar results have been seen for linear and branched short-chained LDPE–Q8 blends, where the POSS is assumed to be dispersed in the amorphous phase of the LDPE.36,37
The addition of POSS has a marked effect on the bulk crystallinity of PE, particularly at 10% wt loading. At low wt% POSS (up to 0.5%) the crystallinity increases slightly. However, at 10% wt fraction POSS, there is a significant reduction of the crystallinity compared with pure PE. This indicates that the addition of POSS at very low wt% fraction enhances the crystallization process of PE under non-isothermal conditions. However, as the POSS content is increased the crystallization process is hindered. This postulation is supported by analysis of the crystallization kinetics presented later.
All of the cooling thermograms in Fig. 3, show evidence of a second broad crystallization transition Tc2, at ∼57 °C. Table 1 summarises the normalised enthalpy of fusion (that is, ΔHc2 at Tc2) for this second crystallization transition for pure PE and the blends. The occurrence of the second crystallization transition is commonly seen in LDPEs which have low bulk crystallinity and it is associated with the crystallization of thinner crystal lamellae at lower temperatures whereas the thicker crystal lamellae are formed at higher temperatures.36,37,53 Hence, different crystalline fractions are formed as the PE is re-crystallized from the melt. Multiple crystallization transitions are due to the extent of long- and short-chain branching and molecular weight distribution of the PE, both of which are considerable in the LDPE used here.41–43 Here, the enthalpy change associated with the second crystallization transition is greatest for pure PE and reduces with increasing POSS content of the blends. Thus, generally as the wt% fraction of POSS increases the formation of the thinner less well defined crystallites decreases. This is generally mirrored in the reduction of overall bulk crystallinity as the wt% fraction of POSS increases as well; once more highlighting the fact that at higher wt% fractions of POSS, the molecules in the blend may hinder the crystallization of the PE. Again, comparable results have been reported, where a lower proportion of thinner lamellae crystals form in the secondary crystallization process in the PE–POSS blends compared with pure PE.36,37
From the DSC analysis of the PE–POSS blends, an increase in the bulk crystallinity is seen compared to pure PE, at very low wt% fractions of POSS. However, as the POSS content increases the crystallinity is significantly reduced and any secondary crystallization is also reduced. These results initially indicate that POSS dispersed in the PE matrix at low levels, may potentially act as a nucleating agent for the crystallization process whereas, at high levels POSS suppresses crystallization. It is worth noting that this notion is supported by the following X-ray scattering data.
X-ray scattering measurements
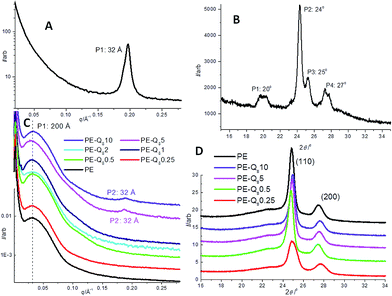
Static 1D SAXS and XRD scans of pure PE, pure Q8C18 POSS and PE–POSS blends at 25 °C are shown in Fig. 4. At this temperature all samples (both PE and the Q8C18 POSS) are well below their melt and crystallization temperatures so are considered crystalline.Firstly, the SAXS and XRD of the pure Q8C18 POSS are shown in Fig. 4A and B respectively, where the SAXS data provides detail on the long-range ordering and molecular length-scale of POSS and the XRD about the crystal lattice structure. The SAXS shows a strong 1st order peak at a length-scale of 32 Å and is related to the overall dimension of the packing of the POSS cage when the long alkyl-chain groups are interdigitated (shown schematically in Fig. 1).16 The XRD for the pure POSS which is a waxy solid at room temperature, with a melt temperature of 45.5 °C, shows a group of prominent peaks (labelled P2–P4) in the 2θ region of 24–27° previously assigned to the distance between the POSS cages and intra and inter chain packing distances.8,12,16,54 The peak at ∼20° (labelled P1), is attributed to the diagonal dimension of the POSS cube body.8,15–17
Fig. 4C and D show the 1D SAXS and XRD for pure PE and PE–POSS blends respectively. For pure PE the SAXS data shows a broad scattering maximum or long period (Lp) at ∼200 Å, which is representative of the average length-scale of crystalline and amorphous layer thicknesses or lamellar repeat distance.22,43 The PE–POSS blends also show the scattering maximum at ∼200 Å of PE without any shift in d-spacing.
However, a second weak scattering peak is seen in the 5% and 10% PE–POSS blends at 32 Å. This corresponds to the 1st order peak of pure POSS (Fig. 4A) indicating that the pure POSS particles seem to aggregate in the PE matrix in these particular blends showing some self-assembly and long-range ordering.16 The 1st order peak is not evident in the other blends where the wt% fraction is less than 5%, which suggests that there is improved dispersal of POSS particles in the PE amorphous matrix and any significant aggregation is not observed.
In Fig. 4D, the two main XRD peaks are common in all scans and labelled as (110) and (200) at 2θ values of 25° and 27.5° respectively. These are associated with the orthorhombic structure of polyethylene. These two peaks are in a similar region to the main group of peaks in the pure POSS in Fig. 4B (24–27°). The (110) and (200) peaks do not shift in the XRD scans of the PE–POSS blends compared with the pure PE, so we assume that the PE crystal lattice is not distorted by the addition of the POSS particles at any of the wt% fractions investigated. Similar results are seen for shorter linear and branched chained LDPE–Q8 blends.36,37 Also, no other POSS crystal peaks (from Fig. 4B) are evident in the PE–POSS blend XRD scans. This suggests that the POSS is dispersed in the amorphous regions of the PE in the blends when in its crystalline form, and even at a loading of 10%, no large regular crystalline aggregates of POSS molecules in the blend is observed.
Time-resolved SAXS/WAXS measurements
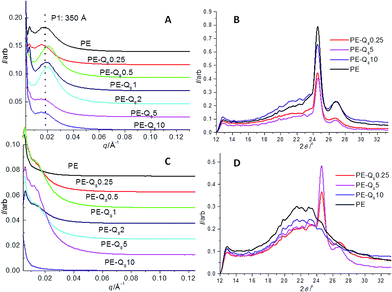
The pure PE and blends were isothermally crystallized at several temperatures from 95 °C to 100 °C which is just below Tm for PE = 109 °C, however theses temperatures were well above the Q8C18 POSS melt temperature. Hence, at these temperatures the crystalline structure development of just the PE was followed with simultaneous SAXS/WAXS as the POSS component will not crystallize at such high temperatures, so are considered as being in the melt form.To show the difference in the development of the long-range order and crystalline structure the last SAXS/WAXS data frames for pure PE and the blends from the isothermal crystallizations at 95 °C and 100 °C are given in Fig. 5.
In Fig. 5A, a broad SAXS peak is seen for PE and all the blends at 95 °C, but the final d-spacing or long period, Lp (PE being ∼350 Å indicated by dashed line in figure) is seen to shift slightly in the blends. A reduction in the Lp of the blends is seen between wt% loadings of 0.5 and 2%, indicating an insertion of narrow lamellae.22,43 Blends of 5% and 10%, show an increase in Lp compared with the pure PE, indicating larger amorphous regions and imperfect crystal lamellae regions. Hence, low wt% loading of the POSS in the PE amorphous regions, nucleates smaller lamellae to grow and increases crystallinity (supporting the DSC analysis of % bulk crystallinity, Table 1). At higher wt% loading, a less well developed crystalline lamellae structure prevails, where the POSS molecules in the PE amorphous matrix hinder the crystallization of the PE molecules. Again DSC data indicates lower % bulk crystallinity in these blends.
Corresponding WAXS data for PE at 95 °C and selected blends is given in Fig. 5B. Here, the (110) and (200) peaks are clearly well developed signifying the crystalline structure of PE. In contrast, Fig. 5C and D show the final SAXS/WAXS data respectively, for PE and the blends once isothermally crystallized at 100 °C. The SAXS peaks, if evident at this temperature, tend to manifest as a shoulder of intensity towards the backstop, having shifted to low q (very large d-spacings) suggesting the lamellar morphology is poorly developed, with large amorphous regions and imperfect lamellae crystals.43 In fact, no real discernible peak is seen for PE and the PE–Q810 blend. This is also mirrored in the WAXS, where the (110) and (200) peaks are not observed on the amorphous background, indicating no real crystalline structure has developed in the PE. Again at these temperatures the POSS molecules reside in melt form in the amorphous PE matrix and hinder the PE crystals to form.
Crystallization kinetics and Avrami analysis of time-resolved SAXS data
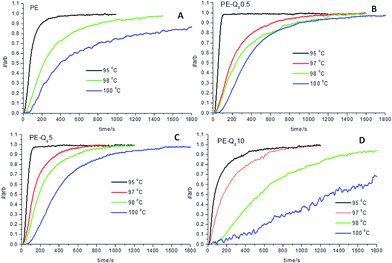
Fig. 6 shows the normalized isothermal crystallization curves obtained from the invariant SAXS data (eqn (2)), for pure PE selected blends. The crystallization process is slower as the isothermal temperature increases.These plots are used to obtain the crystallization half-time t1/2, which represents the time taken to reach 50% conversion to full crystallinity at a specific temperature.22,50 In Fig. 6, the PE–Q810 blend shows significantly slower crystallization kinetics than the pure PE and other blends at low undercoolings. Comparing the crystallization half-times t1/2, in Fig. 7, for PE and the blends shows the variation in the crystallization rates more clearly.
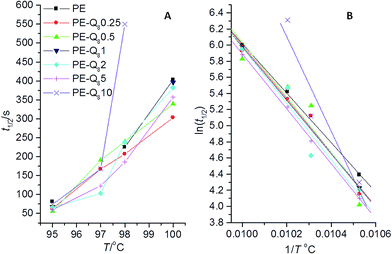 | ||
| Fig. 7 (A) Crystallization half-times (t1/2) versus temperature for pure PE and blends; (B) corresponding plots of ln(t1/2) versus 1/T. | ||
The variation in t1/2 in Fig. 7, shows that pure PE has slower crystallization kinetics compared with most of the blends. Thus, it is reasonable to assume that the POSS particles in the blends act as nucleating agents. However, the PE–Q810 blend shows that at this level of wt% loading the POSS particles are hindering the crystallization process at higher temperatures. This fits with the lack of crystalline structure development in this blend at 100 °C, indicted by SAXS/WAXS data (Fig. 5) and low overall bulk crystallinity from DSC analysis.
Avrami plots from the double logarithmic form of the Avrami equation (eqn (4)) were obtained from the isothermal crystallization curves for all samples at each isothermal crystallization temperature. Fig. 8, shows the Avrami plots with fits to the linear regions at 95 °C.
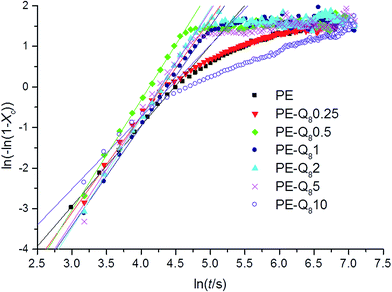 | ||
| Fig. 8 Avrami plots and fits to the linear regions for pure PE and blends during isothermal crystallization at 95 °C. | ||
In pure PE, the fitted linear region of the Avrami plot correlates to the primary crystallization process. This is followed by the slower secondary crystallization process.51,52 On addition of small wt% of POSS, the primary process dominates and the overall crystallization time is reduced. However, for 10% wt POSS loading, the secondary crystallization process is similar to pure PE but proceeds at a slower rate. This supports the earlier argument, where lower wt% of POSS acts as a nucleating agent whereas, higher wt% POSS retards crystallization and reduces the overall crystallinity.
The Avrami exponent n is obtained from the linear fit region and the rate constant, ln![[thin space (1/6-em)]](https://www.rsc.org/images/entities/char_2009.gif) k, from the intercept. Table 2, collates all the Avrami parameters obtained from the Avrami plot fits as well as t1/2 values, for pure PE and the blends during isothermal crystallization at several temperatures.
k, from the intercept. Table 2, collates all the Avrami parameters obtained from the Avrami plot fits as well as t1/2 values, for pure PE and the blends during isothermal crystallization at several temperatures.
| Sample | T i/°C | t 1/2/s | Avrami exponent, n | ln(k/s−1) |
|---|---|---|---|---|
| PE | 95 | 81 | 2.0 | −8.9 |
| 98 | 225 | 1.6 | −9.1 | |
| 100 | 403 | 1.4 | −9.6 | |
| PE–Q80.25 | 95 | 63 | 2.4 | −10.2 |
| 97 | 167 | 2.3 | −11.3 | |
| 98 | 207 | 2.2 | −11.4 | |
| 100 | 378 | 2.8 | −16.4 | |
| PE–Q80.5 | 95 | 56 | 2.7 | −11.2 |
| 97 | 191 | 2.1 | −11.3 | |
| 98 | 240 | 2.0 | −11.1 | |
| 100 | 339 | 3.3 | −18.9 | |
| PE–Q81 | 95 | 68 | 2.5 | −10.8 |
| 100 | 396 | 2.3 | −14.3 | |
| PE–Q82 | 95 | 68 | 2.7 | −11.6 |
| 97 | 103 | 2.4 | −11.6 | |
| 98 | 238 | 2.4 | −12.6 | |
| 100 | 382 | 2.8 | −15.8 | |
| PE–Q85 | 95 | 60 | 2.6 | −10.4 |
| 97 | 123 | 2.1 | −11.1 | |
| 98 | 186 | 2.7 | −13.6 | |
| 100 | 357 | 3.7 | −20.4 | |
| PE–Q810 | 95 | 74 | 1.8 | −7.8 |
| 97 | 168 | 1.4 | −7.2 | |
| 98 | 550 | 2.4 | −14.8 |
The Avrami exponent n, provides information about the nucleation and dimensionality of the crystal growth unit of the material during the isothermal crystallization process. For pure PE n is in the range of 1.4 to 2 with decreasing isothermal crystallization temperature. Values of n in the region of 2–4 have previously been reported for HDPE–POSS blends during isothermal and non-isothermal crystallization.21,55,56 Values of n ≤ 2 implies a low dimensionality growth unit; homogeneous or heterogeneous nucleation of fibril or disc like structures.57–59 The Avrami exponents for the blends are still relatively low in, the region of 2–4, but on average a slight increase compared to the pure PE is seen in the values. This indicates that the POSS particles in the blends do seem to increase the dimensionality of the growth unit and are therefore likely to act as heterogeneous nucleation sites. In all cases the rate constant k, decreases with increasing isothermal crystallization temperature.
SEM of PE–POSS blends
To investigate the dispersal of the POSS in the PE matrix, SEM and elemental analysis on the PE–Q810 and PE–Q81 blends was performed at 20 °C. This is comparable to the static SAXS and XRD data shown in Fig. 4 where the POSS and PE is fully crystallised at room temperature.From the static SAXS data (Fig. 4C) the PE–Q810 blend showed the 1st order scattering peak of the POSS indicating aggregation of the POSS particles, whereas this peak was not evident in low wt% loadings of POSS in the PE matrix. This is confirmed in the SEM in Fig. 9.
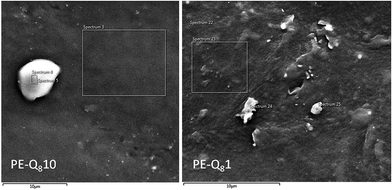 | ||
| Fig. 9 SEM images of PE–Q810 and PE–Q81 blends at 20 °C. X-Ray EDS spectrum location points and areas are indicated. | ||
The SEM image for the PE–Q810 blend shows a spherical feature which is an aggregation of POSS particles in the PE matrix. The locations of the X-ray elemental analysis are labelled in the SEM image and the spectral data of the elemental analysis are given in Table 3.
| Spectrum | Element | wt% |
|---|---|---|
| PE–Q810: spectrum 3 | C | 84.9 |
| O | 9.8 | |
| Si | 5.3 | |
| PE–Q810: spectrum 4 | C | 47.5 |
| O | 21.7 | |
| Si | 30.9 | |
| PE–Q810: spectrum 5 | C | 41.2 |
| O | 15.3 | |
| Si | 43.5 | |
| PE–Q81: spectrum 23 | C | 99.1 |
| O | 0.9 | |
| PE–Q81: spectrum 24 | C | 97.8 |
| O | 2.0 | |
| Si | 0.2 | |
| PE–Q81: spectrum 25 | C | 98.7 |
| O | 1.2 | |
| Si | 0.1 |
The elemental analysis of spectrum 3 (an area of the PE matrix) indicates mostly carbon as expected from the pure PE, as well as significant amounts of silicon and oxygen from the POSS distributed in the matrix. Elemental analysis of the particle feature (spectra 4 and 5) shows high levels of silicon and oxygen which confirms that this is an aggregation of POSS particles; as expected from the SAXS data.
In contrast the SEM image for the PE–Q81 blend shows some particulate features in the matrix. However, elemental analysis of the matrix and particles shows mainly carbon with a little silicon and oxygen. Thus, POSS is not sufficiently aggregated at such low wt% loadings in this blend, but is most likely dispersed in the PE amorphous matrix. Again from the SAXS data, this is expected as low wt% loadings of POSS are well dispersed in the PE matrix.
General discussion and comparison of PE–Q8C18 and PE–T8C18 blends
The data presented here has shown that blending Q8C18 POSS in PE clearly influences the crystalline lamellar morphology and crystallization kinetics of the polymer. As the wt% loading of POSS is increased it is apparent that the POSS begins to aggregate and hinders the crystallization of the PE, especially at the highest wt% loading of 10%. This was shown by the reduction of the bulk crystallinity from DSC, lack of crystalline morphology from SAXS/WAXS data and elemental analysis from SEM. Thus, the POSS–POSS interactions increase as the wt% loading increases, and poor dispersal is observed in the polymer matrix leading to POSS aggregation. Again, this is supported by the emergence of the 1st order SAXS peaks for the self-assembled pure POSS at 32 Å, in the blends at 5 and 10 wt%. This also fits with the proposed packing model (Fig. 1), which has been observed for pure Q8C18 POSS,16 as depicted in Fig. 4A, where the crystalline POSS molecules are interdigitated.The observed effects of POSS either nucleating or hindering the crystallization kinetics of the PE can be interpreted on a molecular level. Here, from the SAXS and SEM data at 25 °C, aggregation and phase-separation has been observed with increasing wt% POSS blended in the PE. This is attributed to POSS aggregations that disrupt the PE crystallization kinetics and perfection of the crystallites, but do not distort the PE crystal lattice being contained within the amorphous matrix.
The POSS molecules at high wt% loadings aggregate and reside in the amorphous polymer matrix and at the isothermal crystallization temperatures investigated, the POSS are in the melt form. The POSS disrupt the molecular motion of the polymer chains, hence retarding crystallization kinetics (as shown with the isothermal crystallization SAXS/WAXS data) and reduces the growth of the crystallites. Once the blend is cooled the POSS molecules crystallise and phase-separate out.
Conversely, at lower wt% loadings the POSS molecules are again distributed in the amorphous matrix, but are not concentrated enough to aggregate effectively and do not phase-separate out once fully cooled to room temperature. From the time-resolved SAXS/WAXS data, at low wt% POSS can act as nucleation points giving increased crystallization kinetics of the polymer during crystallization at high temperatures and serve as sites where new lamellae can begin to grow.
This crystallization behaviour has also been seen in other POSS–polyolefin (PE and iPP)–POSS blends; albeit with different types of POSS than those studied here (T8 rather than Q8). Waddon20,60 reported similar types of behaviour for PE copolymer–POSS blends where aggregates of both PE and POSS were observed when crystallized from the melt and POSS disrupted the crystallization process. X-ray scattering studies confirmed the presence of POSS and PE crystal structures but the PE lattice was not distorted by POSS, implying that the POSS and PE form a two-phase crystalline structure. Fu18 and Joshi21,55 also studied the isothermal crystallization kinetics in PP–octamethyl and HDPE–octamethyl POSS blends respectively. Here again they observed that higher POSS fractions in the blend reduced the crystallization kinetics due to the dispersal of POSS molecules in the polymer matrix retarding the molecular motion of the chains and hence, decreases crystal growth. Recently, Huang61,62 studied the crystallization kinetics of POSS–polydimethylsiloxane rubber (PDMS) nanocomposite blends. Once again they reported that at low loadings POSS was uniformly dispersed in the polymer matrix and acted as nucleation agents, but as the POSS aggregate at higher loadings they crystallize in regions restricting the PDMS chain segments from forming ordered structures.
All of these comparative studies indicate that at high levels of POSS loadings, POSS aggregate as the POSS–POSS interactions are greater than POSS–polymer interactions at a molecular level. The POSS molecules phase-separate out of the polymer matrix, this in effect, hinders the crystallization kinetics of the host polymer. However, at low loadings of POSS, the POSS–polymer interactions are greater and hence the POSS are preferentially dispersed in the polymer matrix. Thus, the POSS molecules do not aggregate or phase-separate out but act as nucleating agents for the host polymer during crystallization. These observations are corroborated by our findings here with the Q8C18 PE–POSS blends.
At this point it is interesting to compare these results briefly with those of the analogous T8C18 POSS–PE blends,22 where the POSS molecules do not have the OSiMe2 spacer groups and so the C18 alkyl chains are directly attached to the corners of the cage. The T8C18 cages do not interdigitate (in contrast to the Q8C18 molecules, Fig. 1), but form rod-like bundles which stack in a regular bilayer structure, with a packing distance of 52 Å (ref. 16, 38 and 54) assigned to the molecular length-scale of the POSS molecule. The different packing scenarios are attributed to the added flexibility of the alkyl-chains in the Q8 cages, due the OSiMe2 spacer groups.
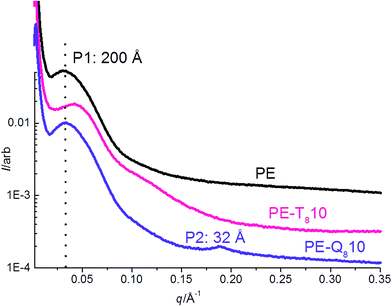
Similarly, we have reported on the morphology and crystallization kinetics of PE where T8C18 POSS particles have been blended into PE at a 10% loading22 (PE–T810). Interestingly, we now observe contrasting results with respect to the two POSS blend systems. The POSS in the PE–T810 POSS blend showed good dispersal in the matrix from both DSC and X-ray analysis. The PE–T810 POSS blend showed a significant increase in crystallinity at ∼42% (where pure PE is ∼37%), compared with the reduction seen here with the PE–Q810 blend at ∼31%. The increased dispersal and crystallinity in the PE–T810 POSS blend is also highlighted in Fig. 10.
This shows the static SAXS at 25 °C, where the PE–Q810 blend shows the separate 1st order peak of pure Q8C18 POSS, in contrast no similar 1st order peak at ∼52 Å (q = 0.121 Å−1) for T8C18 is observed in the PE–T810 blend.38 This again confirms that the T8C18 POSS is well dispersed in the blend at 10% loading, whereas the Q8C18 is aggregated at this loading. The lamellar morphology is also significantly altered; pure PE and PE–Q810 blend have a final Lp = 200 Å but this is significantly reduced in the PE–T810 blend where the final Lp = 155 Å.22 The reduction in Lp and increased bulk crystallinity in the PE–T810 blend indicates shorter average amorphous and lamellar crystal repeat distances, from insertion and subsequent growth of lamellae into the amorphous regions. This is in contrast for the PE–Q810 blend where the existence of a second crystalline transition Tc2 (Fig. 3 and Table 1) highlighted by the insertion of thinner lamellae into the amorphous polymer, is significantly reduced for this blend.
Finally, a comparison of isothermal crystallization kinetics also emphasizes the difference in the Q8 and T8 blends. Fig. 11, presents the crystallization half-times t1/2, for pure PE and 10% blends of PE–T8C18 and PE–Q8C18 at several isothermal crystallization temperatures.
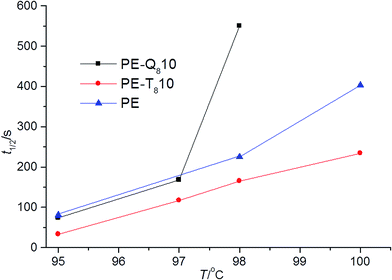 | ||
| Fig. 11 Comparison of t1/2 pure PE and 10% blends of PE–T8C18 and PE–Q8C18 at several isothermal crystallization temperatures. | ||
Clearly, pure PE and PE–Q8C18 blend have similar values of t1/2 up to undercoolings of ∼97 °C but, at undercoolings above ∼97 °C the kinetics are slowed significantly, compared with pure PE for this blend. However, at all undercoolings, the PE–T8C18 blend shows increased crystallization kinetics, more so for both the pure PE and the PE–Q8C18 blend.
The comparison of the PE–T8C18 and PE–Q8C18 blends with respect to each other and pure PE gives rise to some noteworthy points. The dispersal, crystallinity and crystallization kinetics are all increased in the T8 POSS cage blends compared with both pure PE and comparable Q8 POSS blends. Evidently, this difference is due to the different structural chemistry of the Q8 POSS cages, that is, the additional OSiMe2 spacer groups, as in both cases the C18 alkyl-chain group is the same. The added flexibility of the OSiMe2 spacer groups allows the interdigitation of the alkyl-chains attached to the POSS molecules, which in turn promotes preferred POSS–POSS interaction and aggregation as the wt% loading increases in the blend.
This aggregation appears to then hinder the crystallization process in the host polymer, PE. A distinctly different situation is seen with the T8C18 POSS system. This has good dispersal and increases the crystallization kinetics and crystallinity in PE, where the POSS act as nucleating agents.22 Indeed, T8C18 POSS cages do not interdigitate so the POSS–POSS interaction at higher wt% loadings is not significant enough to cause aggregation (at least at loadings of 10% as studied here).
Conclusions
We have investigated the dispersal, morphology and crystallization kinetics of a series of novel PE–Q8C18 POSS blends with increasing wt% loadings. From the X-ray and DSC results, as the wt% loading of POSS in the PE matrix is increased the dispersal of the POSS is reduced and hinders the crystallization kinetics and hence lowers the bulk crystallinity of the PE. Aggregation of POSS is observed from 5% loading, where POSS–POSS interactions are favoured and the molecules self-assemble in an interdigitated manner and phase-separate out of the host polymer matrix. At low loadings, the POSS is well dispersed and an increase in both the bulk crystallinity and crystallization kinetics are observed, where the POSS acts as a nucleating agent. The POSS do not aggregate or phase-separate out of the host polymer matrix.A comparison is also made with the analogous T8C18 POSS cage system when blended in the same PE at 10% loading. Interestingly, the Q8 and T8 systems give contrasting results, which are attributed to their different structural chemistry; that is, from the added flexibility of the alkyl-chain groups attached to the Q8 POSS cages owing to the OSiMe2 spacer groups, which are absent in the T8 cage systems. Both the T8 and Q8 POSS particles do not significantly alter the melting and crystallization temperatures of the host polymer, but T8 POSS particles disperse well, are effective nucleating agents and increase overall crystallinity. In contrast Q8 POSS particles become aggregated at high wt% loadings and hinder crystallization rates and reduce crystallinity.
Both Q8 and T8 POSS cage systems could potentially serve as nanoparticulate fillers in polyolefins, but with differing influences on polymer crystallization and morphology. Certainly, this may have industrially important implications in the processing of polyolefins. It is well known that PE has very fast crystallization kinetics,57–59 thus being able to hinder or nucleate crystallization rates at processing temperatures and hence alter the crystallinity and resulting morphology can allow tailoring of the material to application. However, the mechanical properties of the host polymer may well be significantly influenced by the changes in crystallinity and morphology which requires attention if POSS is to be employed as a nanoparticulate filler system. Further to this, experimental investigations into the mechanical properties of the POSS blends presented here are currently being undertaken and will be published by the authors in a forthcoming paper.
Acknowledgements
X-ray beam time was provided under the experimental application SM-6719. We are grateful for the assistance of all the Diamond I22 beamline staff. Mr Ian Williamson is acknowledged for assistance with sample preparation and experimental measurements. Mr Gordon Imlach is acknowledged for SEM sample preparation and instrumental analysis.Notes and references
- D. W. J. Scott, J. Am. Chem. Soc., 1946, 68, 356 CrossRef CAS.
- R. H. Baney, I. Itoh, A. Sakakibara and T. Suzuki, Chem. Rev., 1995, 95, 1409 CrossRef CAS.
- J. J. Schwab and J. D. Lichtenhan, Appl. Organomet. Chem., 1998, 12, 707 CrossRef CAS.
- J. Wu and P. T. Mather, Polym. Rev., 2009, 49, 25 CrossRef CAS PubMed.
- F. K. Wang, X. Lu and C. He, J. Mater. Chem., 2011, 21, 2775 RSC.
- S. H. Phillips, T. S. Haddad and S. J. Tomczak, Curr. Opin. Solid State Mater. Sci., 2004, 8, 21 CrossRef CAS PubMed.
- S. W. Kuo and G. C. Chang, Prog. Polym. Sci., 2011, 36, 1649 CrossRef CAS PubMed.
- D. B. Cordes, P. D. Lickiss and F. Rataboul, Chem. Rev., 2010, 110, 2081 CrossRef CAS PubMed.
- G. Li, L. Wang, H. Ni and C. U. Pittman, J. Inorg. Organomet. Polym., 2001, 11, 123 CrossRef CAS.
- R. Y. Kannan, H. J. Salacinski, P. E. Butler and A. M. Seifalian, Acc. Chem. Res., 2005, 38, 879 CrossRef CAS PubMed.
- A. R. Bassindale and T. E. Gentle, J. Mater. Chem., 1993, 12, 1319 RSC.
- R. M. Laine, J. Mater. Chem., 2005, 15, 3725 RSC.
- N. Auner, B. Ziemer, B. Herrschaft, W. Ziche, P. John and J. Weis, Eur. J. Inorg. Chem., 1999, 1999, 1087 CrossRef.
- E. Markovic, J. Matisons, M. Hussain and G. P. Simon, Macromolecules, 2007, 40, 4530 CrossRef CAS.
- F. X. Perrin, T. B. V. Nguyen and A. Margaillan, Eur. Polym. J., 2011, 47, 1370 CrossRef CAS PubMed.
- E. L. Heeley, D. J. Hughes, Y. El Aziz, I. Williamson, P. G. Taylor and A. R. Bassindale, Phys. Chem. Chem. Phys., 2013, 15, 5518 RSC.
- Y. C. Sheen, C. H. Lu, C. F. Huang, S. W. Kuo and F. C. Chang, Polymer, 2008, 49, 4017 CrossRef CAS PubMed.
- B. X. Fu, L. Yang, R. H. Somani, S. S. Zong, B. S. Hsiao, S. Philips, R. Balanski and P. Ruth, J. Polym. Sci., Part B: Polym. Phys., 2001, 39, 2727 CrossRef CAS PubMed.
- A. Fina, D. Tabunani, A. Frache and G. Camino, Polymer, 2005, 46, 7855 CrossRef CAS PubMed.
- A. J. Waddon, L. Zheng, R. J. Farris and E. B. Coughlin, Nano Lett., 2002, 2, 1149 CrossRef CAS.
- M. Joshi and B. S. Butona, J. Appl. Polym. Sci., 2007, 105, 978 CrossRef CAS PubMed.
- E. L. Heeley, D. J. Hughes, Y. El Aziz, P. G. Taylor and A. R. Bassindale, Eur. Polym. J., 2014, 51, 45 CrossRef CAS PubMed.
- J. Zeng, S. Kumar, S. Iyer, D. A. Schiraldi and R. I. Gonzalez, High Perform. Polym., 2005, 17, 403 CrossRef CAS PubMed.
- H. W. Milliman, H. Ishida and D. A. Schiraldi, Macromolecules, 2012, 45, 4650 CrossRef CAS.
- E. T. Kopesky, T. S. Haddad, G. H. McKinley and R. E. Cohen, Polymer, 2005, 46, 4743 CrossRef CAS PubMed.
- J. Wu, T. S. Haddad and P. T. Mather, Macromolecules, 2009, 42, 1142 CrossRef CAS.
- E. S. Cozza, Q. Ma, O. Monticelli and P. Cebe, Eur. Polym. J., 2013, 49, 33 CrossRef CAS PubMed.
- R. Misra, B. X. Fu, A. Plagge and S. E. Morgan, J. Polym. Sci., Part B: Polym. Phys., 2009, 47, 1088 CrossRef CAS PubMed.
- R. Jeziórska, B. Świerz-Motysia, A. Szadkowska, B. Marciniec, H. Maciejewski, M. Dutkiewicz and I. Leszczyńska, Polimery, 2011, 56, 809 Search PubMed.
- L. Matĕjka, A. Strachota, J. Pleštil, P. Whelan, M. Steinhart and M. Šlouf, Macromolecules, 2004, 37, 9449 CrossRef.
- K. N. Raftopoulos, M. Jancia, D. Aravopoulou, E. Hebda, K. Pielichowski and P. Pissis, Macromolecules, 2013, 46, 7378 CrossRef CAS.
- J. H. Chen and Y. D. Chiou, J. Polym. Sci., Part B: Polym. Phys., 2006, 44, 2122 CrossRef CAS PubMed.
- M. Pracella, D. Chionna, A. Fina, D. Tabuani, A. Frache and G. Camino, Macromol. Symp., 2006, 234, 59 CrossRef CAS PubMed.
- A. Fina, D. Tabuani and G. Camino, Eur. Polym. J., 2010, 46, 14 CrossRef CAS PubMed.
- F. Baldi, F. Bignotti, A. Fina, D. Tabuani and T. Riccò, J. Appl. Polym. Sci., 2007, 105, 935 CrossRef CAS PubMed.
- A. N. Frone, F. X. Perrin, C. Radovici and D. M. Panaitescu, Composites, Part B, 2013, 50, 98 CrossRef CAS PubMed.
- F. X. Perrin, D. M. Panaitescu, F. N. Frone, C. Radovici and C. Nicolae, Polymer, 2013, 54, 2347 CrossRef CAS PubMed.
- E. L. Heeley, D. J. Hughes, Y. El Aziz, P. G. Taylor and A. R. Bassindale, Macromolecules, 2013, 46, 4944 CrossRef CAS.
- L. Wang, Y. Ishida, R. Maeda, M. Tokita, S. Horiuchi and T. Hayakawa, Langmuir, 2014, 30, 9797 CrossRef CAS PubMed.
- L. Wang, Y. Ishida, R. Maeda, M. Tokita and T. Hayakawa, RSC Adv., 2014, 4, 34981 RSC.
- E. L. Heeley, A. C. Morgovan, W. Bras, I. P. Dolbnya, A. J. Gleeson and A. J. Ryan, PhysChemComm, 2002, 5, 158 RSC.
- M. Sentmanat, B. N. Wang and G. H. McKinley, J. Rheol., 2005, 49, 585 CrossRef CAS.
- E. L. Heeley, T. Gough, D. J. Hughes, W. Bras, J. Rieger and A. J. Ryan, Polymer, 2013, 54, 6580 CrossRef CAS PubMed.
- X. Huang, L. Xie, P. Jiang, G. Wang and Y. Yin, Eur. Polym. J., 2009, 45, 2172 CrossRef CAS PubMed.
- J. Brandrup, E. H. Immergut and E. A. Grulke, Polymer Handbook, Wiley-Interscience, New York, 4th edn, 2003 Search PubMed.
- http://www.diamond.ac.uk/Beamlines/Soft-Condensed-Matter/small-angle/I22.html .
- A. Berry, W. I. Helsby, B. T. Parker, C. J. Hall, P. A. Buksh, A. Hill, N. Clague, M. Hillon, G. Corbett, P. Clifford, A. Tidbury, R. A. Lewis, R. J. Cernik, P. Barnes and G. E. Derbyshire, Nucl. Instrum. Methods Phys. Res., Sect. A, 2003, 513, 260 CrossRef CAS PubMed.
- J. E. Bateman, G. E. Derbyshire, G. Diakun, D. M. Duxbury, J. P. A. Fairclough, I. Harvey, W. I. Helsby, J. D. Lipp, A. S. Marsh, J. Salisbury, G. Sankar, E. J. Spill, R. Stephenson and N. J. Terrill, Nucl. Instrum. Methods Phys. Res., Sect. A, 2007, 530, 1526 CrossRef PubMed.
- W. Bras, I. P. Dolbnya, D. Detollenaere, R. van Tol, M. Malfois, G. N. Greaves, A. J. Ryan and E. Heeley, J. Appl. Crystallogr., 2003, 36, 791 CrossRef CAS.
- E. L. Heeley, C. M. Fernyhough, R. S. Graham, P. D. Olmsted, N. J. Inkson, J. Embery, D. J. Groves, T. C. B. McLeish, A. C. Morgovan, F. Meneau, W. Bras and A. J. Ryan, Macromolecules, 2006, 39, 5058 CrossRef CAS.
- M. Avrami, J. Chem. Phys., 1939, 7, 1103 CrossRef CAS PubMed.
- M. Avrami, J. Chem. Phys., 1940, 8, 212 CrossRef CAS PubMed.
- G. F. Shan, W. Yang, X. G. Tang, M. B. Yang, B. H. Xie, Q. Fu and Y. W. Mai, Polym. Test., 2010, 29, 273 CrossRef CAS PubMed.
- Y. El Aziz, A. R. Bassindale, P. G. Taylor, R. A. Stephenson, M. B. Hursthouse, R. W. Harrington and W. Clegg, Macromolecules, 2013, 46, 988 CrossRef CAS.
- M. Joshi, B. S. Butola, G. Simon and N. Kukaleva, Macromolecules, 2006, 39, 1839 CrossRef CAS.
- M. Joshi and B. S. Butola, Polymer, 2004, 45, 4953 CrossRef CAS PubMed.
- A. Sharples, Introduction to Polymer Crystallization, Edward Arnold Ltd., London, 1966 Search PubMed.
- U. W. Gedde, Polymer Physics, Springer, 1995 Search PubMed.
- J. M. Schultz, Polymer Crystallization. The Development of Crystalline Order in Thermoplastic Polymers, Oxford, New York, 2001 Search PubMed.
- L. Zheng, A. J. Waddon, R. J. Farris and E. B. Coughlin, Macromolecules, 2002, 35, 2375 CrossRef CAS.
- D. Zhang, Y. Shi, Y. Liu and G. Huang, RSC Adv., 2014, 4, 41364 RSC.
- D. Zhang, Y. Liu, Y. Shi and G. Huang, RSC Adv., 2014, 4, 6275 RSC.
| This journal is © The Royal Society of Chemistry 2015 |

