
Preparation of α-Fe2O3 films by electrodeposition and photodeposition of Co–Pi on them to enhance their photoelectrochemical properties
Jin You Zheng,
Se In Son,
Thanh Khue Van and
Young Soo Kang*
Korea Center for Artificial Photosynthesis (KCAP), Department of Chemistry, Sogang University, Seoul 121-742, Republic of Korea. E-mail: yskang@sogang.ac.kr; Tel: +82-2-705-8882
First published on 14th April 2015
Abstract
In this paper, α-Fe2O3 photoanodes with different structures were prepared on indium-doped tin oxide (ITO) coated glass by calcination of electrodeposited α-Fe films. Morphologies of the films can be varied from the nanoparticle to sparse dendrites, and then to high-density dendrites as the deposition time is prolonged. Their morphology-dependent photoelectrochemical properties with and without coupling with the photodeposited Co–Pi were investigated through the photocurrent and the photoresponse. The α-Fe2O3 film exposing a larger area of the bottom layer has a low photocurrent onset potential; after coupling with the Co–Pi co-catalyst, their onset potentials are shifted to the negative direction. The photocurrent of hematite films can be enhanced more than 40% for the particle type and 70% for the dendritic type regardless of low photocurrent values. This indicates that the photodeposited Co–Pi can effectively suppress the photogenerated electron–hole recombination on the surface of hematite, especially dendritic α-Fe2O3.
1. Introduction
In 1972, Fujishima and Honda first reported the photoelectrochemical (PEC) production of H2 and O2, via a water splitting reaction with photo-generated electrons and holes (e−–h+), at chemically biased TiO2 under UV light illumination.1 This report attracted great attention not only of electrochemists but also of many scientists in a broad area, and numerous related studies were reported from the 1970s to now.2 Nowadays, many other semiconductor materials such as α-Fe2O3, WO3 and BiVO4 are widely investigated for PEC water splitting with external bias or direct solar water splitting. Among them, α-Fe2O3 (hematite) is one of the most popular n-type semiconductors for use as a photoanode in the water splitting PEC cell. It is very abundant on earth, low in cost, environmentally benign and capable of withstanding neutral and alkaline condition.3,4 Above all, for solar water splitting, it has a narrow indirect band gap of ∼2.1 eV that could utilize about 40% of the incident solar spectra,5 which is better than TiO2 (Eg ∼ 3.0 eV) and WO3 (Eg ∼ 2.7 eV). α-Fe2O3 possesses 15.3% of theoretical solar-to-hydrogen efficiency or 12.6 mA cm−2 of photocurrent at 1.23 vs. RHE under 1 sun irradiation.6 Its valence band position has a sufficient overpotential for oxygen evolution reaction (OER).4 However, α-Fe2O3 has several inherent drawbacks such as the very short hole-diffusion length (∼2–4 nm), low electron mobility (∼10−1 cm2 V−1 s−1) and high recombination rate of photo-generated e−–h+, poor electrical conductivity and low visible light absorption coefficient.4,7,8 Many different strategies, such as nanostructuring, elemental doping and surface treatment, have been investigated to overcome these inherent drawbacks to achieve a high plateau photocurrent and/or low onset potential in hematite-based PEC devices.9In 2008, Nocera et al.10 reported a new type of oxygen-evolution catalyst with amorphous features composed of cobalt, oxygen, and phosphate elements, normally named as cobalt–phosphate (Co–Pi), which is formed in situ upon anodic polarization of an inert indium-tin-oxide coated glass (ITO) electrode in aqueous phosphate buffer solution at pH 7.0 containing Co2+ ions. The Co–Pi film can oxidize water at pH 7 with a current density of 1.0 mA cm−2 under a very low overpotential of 0.41 V. It can be possible structural and functional analogues to the Mn3CaO4–Mn cubane of the oxygen-evolving complex in photosystem II (PSII), where Co replaces Mn and the cubane is extended in a corner-sharing head-to-tail dimer.10–15 This Co–Pi catalyst has been received much attention due to its ability to self-assemble under neutral conditions, its self-repair mechanism, and its formation from low-cost and earth-abundant elements.10,16,17 Interestingly, when the Co–Pi was coupled with semiconductors, it considerably enhances the efficiency of solar water splitting.14 Many works related with Co–Pi as a co-catalyst have been reported. For examples, Co–Pi can enhance the efficiency of water photooxidation when it was coupled with WO3,4 ZnO,18 BiVO4,19–22 Si23 and α-Fe2O3.4,9,24–26 In presence of Co–Pi electrocatalyst on photoanodes as co-catalyst can not only enhance the photocurrent density, but also achieve negative shift of onset potential.27 For examples, Wang et al.21 reported that the photocatalytic activity of O2 evolution on Co–Pi/BiVO4 can be greatly enhanced with 6.8 times comparison with that of bare BiVO4 when the loading amount of Co–Pi is about 1.0 wt%. The photocurrent of BiVO4 electrode also can be enhanced accompanied by the onset potential negatively shifted with optimal amount of Co–Pi loading. Recently, Kim et al.6 have reported that a kind of wormlike hematite photoanode gives a photocurrent of 1.26 mA cm−2 at 1.23 V vs. RHE under 1 sun (100 mV cm−2) and AM 1.5 G simulated solar light irradiation. After Pt doping (Pt:Fe2O3), the photocurrent increases by 74% to 2.19 mA cm−2. When the Pt:Fe2O3 is modified again with Co–Pi co-catalyst, the photocurrent surprisingly increases by additional 170% to 4.32 mA cm−2, which is the highest stable PEC water oxidation current for hematite photoanode ever reported.6
The Co–Pi can be prepared by several methods such as electrodeposition,10 photodeposition,4,18 photo-assisted electrodeposition,6 and two-step chemical immersion.28 Among them, Choi and co-workers4,18 reported a facile method to form Co–Pi on the surface of some n-type semiconductors such as ZnO and α-Fe2O3 by photochemical deposition (photodeposition). The distinctive advantage of the photodeposition for coupling Co–Pi with a photoanode is that the photodeposition method has the effect of placing Co–Pi on the most active sites on the semiconductor surface for solar O2 evolution. This self-site-selective photodeposition of Co–Pi can make the most effective use of Co–Pi and enhance O2 evolution with a minimal amount of Co–Pi.4
In our previous work,29,30 we have reported that dendritic α-Fe2O3 nanowire array films with high surface area can be formed via thermal oxidation of the electrodeposited dendritic α-Fe nanowires. The photocurrent density of the dendritic α-Fe2O3 nanowires was lower than the other reported nanowires and nanotubes, which may be attributed to higher e−–h+ recombination probability or the presence of higher amount of surface defects.9,30 Herein, for enhancing the photocatalytic activities, the Co–Pi was coupled to the α-Fe2O3 films with different structures by the facile photodeposition method.
2. Experimental
The electrodeposition of α-Fe films were carried out in a conventional three-electrode cell system using a PysioLab potentiostat (Model KST-P1) as the similar process as our previous report.29,30 The commercial indium-doped tin oxide (ITO: 50 mm × 5 mm) (ITO film thickness 200 nm, resistance ≤ 10 Ω cm−2) coated glass substrate was used as working electrode. ITO glass substrate was dipped into the electrolyte solution vertically and the deposition area was fixed to 0.5 cm2 (10 mm × 5 mm) by a Scotch tape. A coiled platinum wire and Ag/AgCl (in 3.0 M NaCl) electrode were used as counter and reference electrodes, respectively. All potentials in this work were measured versus Ag/AgCl electrode. All the electrodeposition experiments were carried out at room temperature (∼24 °C) without stirring or any external gas bubbling. α-Fe films were deposited in 5 mL aqueous solution containing 0.05 M FeSO4 and 0.1 M Na2SO4 aqueous solution with pH 2.5 (adjusted by adding 5.0 M and 1.0 M H2SO4) at +1.5 V for given time. α-Fe2O3 films were obtained by calcination of α-Fe films in air at 500 °C for 3 h (heating speed 2 °C min−1) in furnace. Photodeposition of Co–Pi on the α-Fe2O3 films was carried out all at once in a glass Petri dish (9 cm in diameter) containing 40 mL solution of 0.5 mM CoCl2 and 0.1 M potassium phosphate buffer at pH 7 under a hand-held UV lamp (Spectroline, Model ENF-260C/FE, λ = 365 nm) with an irradiance of 0.15 mW cm−2 measured by a Lutron UV light meter (Model YK-34UV) at room temperature (∼24 °C) for 3 h.X-ray diffraction (XRD, Rigaku miniFlex-II desktop, Cu Kα) patterns, transmission electron microscope (TEM, JEOL, JEM-2100F) with energy-dispersive spectroscopy (EDS, Oxford Instruments, INCA X-sight), scanning electron microscope (SEM, Hitachi S-4300) were used to check crystallinity, crystal structure, elemental composition, and surface and cross-sectional morphologies of the obtained films. Photoelectrochemical measurements were conducted with a potentiostat/galvanostat (Compactstat, Invium technologies) in a V-style three-electrode electrochemical cell equipped with quartz window at room temperature under 1 sun (Asahi HAL-320 solar simulator) illumination, employing a Pt foil and an Ag/AgCl (in 3.0 M NaCl) electrode as counter and reference electrode, respectively. A 1.0 M NaOH aqueous solution (pH = 13.6) was used as electrolyte. Photocurrent–potential was measured using linear sweep voltammogram (LSV) method at a scan rate of 10 mV s−1 under continue 1 sun light. Photoresponse was checked using chronoamperometry method with chopped 1 sun light (light on and off: 20 s) at +0.22 V vs. Ag/AgCl. The stability of the films in PEC water splitting were carried out at +0.5 V vs. Ag/AgCl for around 2 h under 1 sun light. For checking the incident photon to electron conversion efficiency (IPCE) (HS Technologies, Korea), the absolute intensity of the monochromic incident light was measured by a standard silicon photodiode (model BS-500, Bunkoukeiki Co. Ltd., Japan). Electrochemical impedance spectroscopy (EIS) was checked using a potentiostat/galvanostat (Compactstat, Invium Technologies) in a frequency range of 0.05–10 kHz.31
3. Results and discussion
Fig. 1(a) shows the schematic drawing of experimental set-up with three electrode system, working electrode (WR: ITO glass), reference electrode (RE: Ag/AgCl in 3.0 M NaCl) and counter electrode (CE: coiled Pt wire). Herein, all the experiments were carried out with a pH value of 2.5 and applied potential of +1.5 V since they are appropriate parameters for 1-D dendritic iron wire array growth on the fixed-size ITO substrates as the discussion in our previous works.29,30 As the further experimental processes and products are shown in Fig. 1(b–d), the as-deposited α-Fe films can be converted to α-Fe2O3 by calcination at 500 °C for 2 h in air; then a Co-based oxygen-evolution catalyst is covered on the surface of α-Fe2O3 films by photodeposition method.4 The as-obtained α-Fe films are dark color and non-transparent when the given deposition times are more than 30 s. The transparent α-Fe film with grey color can be obtained at 10 s since there are very less deposits on the ITO substrate. After calcination, the color of these films was changed to yellow, red or dark red color, which depends on the film thickness. As the deposition time is increased, the transmittance is decreased and the films deposited longer than 300 s were non-transparent. | ||
| Fig. 1 Schematic diagrams showing (a) the experimental set-up and (b) the processes of formation of α-Fe2O3 and Co–Pi/α-Fe2O3 films from electrodeposited α-Fe films via calcination and photodeposition. (c) and (d) are the digital photographs of the electrodeposited α-Fe films at +1.5 V vs. Ag/AgCl for 30–400 s before and after calcination, respectively. | ||
SEM images of α-Fe films are similar to the corresponding α-Fe2O3 films since the structures of the films are not changed by calcination.29,30 Therefore, herein we only show the morphologies of α-Fe2O3 films, which were obtained by annealing the as-deposited α-Fe films, via SEM images as shown in Fig. 2(a–f). The α-Fe2O3 film, comes from the α-Fe film with the deposition time of χ seconds, is called α-Fe2O3-χ for short. The α-Fe2O3-30 film (Fig. 2(a)) is very compact and smooth; the similar morphology has been reported by Choi's group.4 With 50 s deposition, the sparse dendrites with the length of ca. 3 μm are formed on the plate film. The α-Fe2O3-50 film (Fig. 2(b)) shows a plate film combined with the triangular hierarchical and dendritic structures. The dendrites of α-Fe2O3-100 films become longer wires, around 10 μm in length. The dendritic wires cannot stand vertically since they are soft and their densities are too low to give enough support to the neighbour dendritic wires.32 In 200 s, 300 s and 400 s samples, the dendritic wires with the length of ca. 20, 35 and 50 μm, respectively, can stand vertically. In addition, some dendritic wires in some part of films lean slightly. This is caused by the washing process after electrodeposition. The α-Fe2O3-400 film has a similar surface construction with α-Fe2O3-300 film, but it contains higher dendrite density than the α-Fe2O3-300 film.
 | ||
| Fig. 2 (a–f) are the SEM images of α-Fe2O3 films obtained with different deposition times. (a) 30 s, (b) 50 s, (c) 100 s, (d) 200 s, (e) 300 s, and (f) 400 s. | ||
After photodeposition of Co–Pi for 3 h, there are no much difference in the color and the morphology change between the α-Fe2O3-χ film and the corresponding Co–Pi/α-Fe2O3-χ film. Therefore, we only show two typical Co–Pi/α-Fe2O3-χ films with χ = 30 s (Fig. 3(a)) and 400 s (Fig. 3(b)) which represent the plate film and the dendritic array, respectively. It is easily observed that they are similar to the corresponding α-Fe2O3 films. It indicates that the photodeposited Co–Pi particles should be very small and cannot be distinguished by low-resolution SEM images. The detailed analysis is carried out by EDS elemental mapping, EDS spectrum and HRTEM as shown in Fig. 3(c–e). The similar Co and P element distribution mapping with Fe element indicates that the Co–Pi nanoparticles are uniformly deposited on the α-Fe2O3 dendrites surface. The ratio of Co to Fe is about 1.4![[thin space (1/6-em)]](https://www.rsc.org/images/entities/char_2009.gif) :44.2. Co–Pi nanoparticles are easily distinguished from α-Fe2O3 grains by HRTEM images since Co–Pi is amorphous and α-Fe2O3 is crystalline as a typical image shown in Fig. 3(e). From the HRTEM image, it can be observed that the Co–Pi particles were deposited on the specific positions of the α-Fe2O3 surface, which gives an evidence for the self-site-selective photodeposition of Co–Pi.4
:44.2. Co–Pi nanoparticles are easily distinguished from α-Fe2O3 grains by HRTEM images since Co–Pi is amorphous and α-Fe2O3 is crystalline as a typical image shown in Fig. 3(e). From the HRTEM image, it can be observed that the Co–Pi particles were deposited on the specific positions of the α-Fe2O3 surface, which gives an evidence for the self-site-selective photodeposition of Co–Pi.4
 | ||
| Fig. 3 (a) and (b) are the typical SEM images of Co–Pi/α-Fe2O3-χ films with χ = 30 s and 400 s. (c) and (d) are the typical EDS elemental mapping and data. (e) is the HRTEM of Co–Pi/α-Fe2O3 structure. | ||
Fig. 4(a) shows XRD patterns of the typical (i) as-electrodeposited α-Fe, (ii) α-Fe2O3 and (iii) Co–Pi/α-Fe2O3 films. They can be perfectly indexed to α-Fe and α-Fe2O3 in terms of peak positions of JCPDS no. 65-4899 and 33-0664, respectively, as the same as our previous reports.29,30 The baseline of the XRD pattern of Co–Pi/α-Fe2O3 film is hunched and has higher noise signals than pure α-Fe2O3 film, which is attributed to the amorphous Co–Pi nanoparticles. To assess the photocatalytic activity for solar water splitting, the photoelectrochemical properties containing of photocurrents and photoresponses for α-Fe2O3 and Co–Pi/α-Fe2O3 films were carried out in 1.0 M NaOH electrolyte solution (pH = 13.6) since the α-Fe2O3 photoanode is chemically stable in it.33 The working electrodes (α-Fe2O3 or Co–Pi/α-Fe2O3 films) were immerged in the electrolyte and illuminated from the front side with 1 sun light by a solar simulator. The applied potentials were measured versus the Ag/AgCl reference electrode and can be converted to the reversible hydrogen electrode (RHE) scale using the following relationships.31,34,35
| ERHE = EAg/AgCl + E0Ag/AgCl vs. NHE + 0.0591 × pH | (1) |
| ERHE = EAg/AgCl + 0.209 + 0.0591 × 13.6 ≈ EAg/AgCl + 1.013 V | (2) |
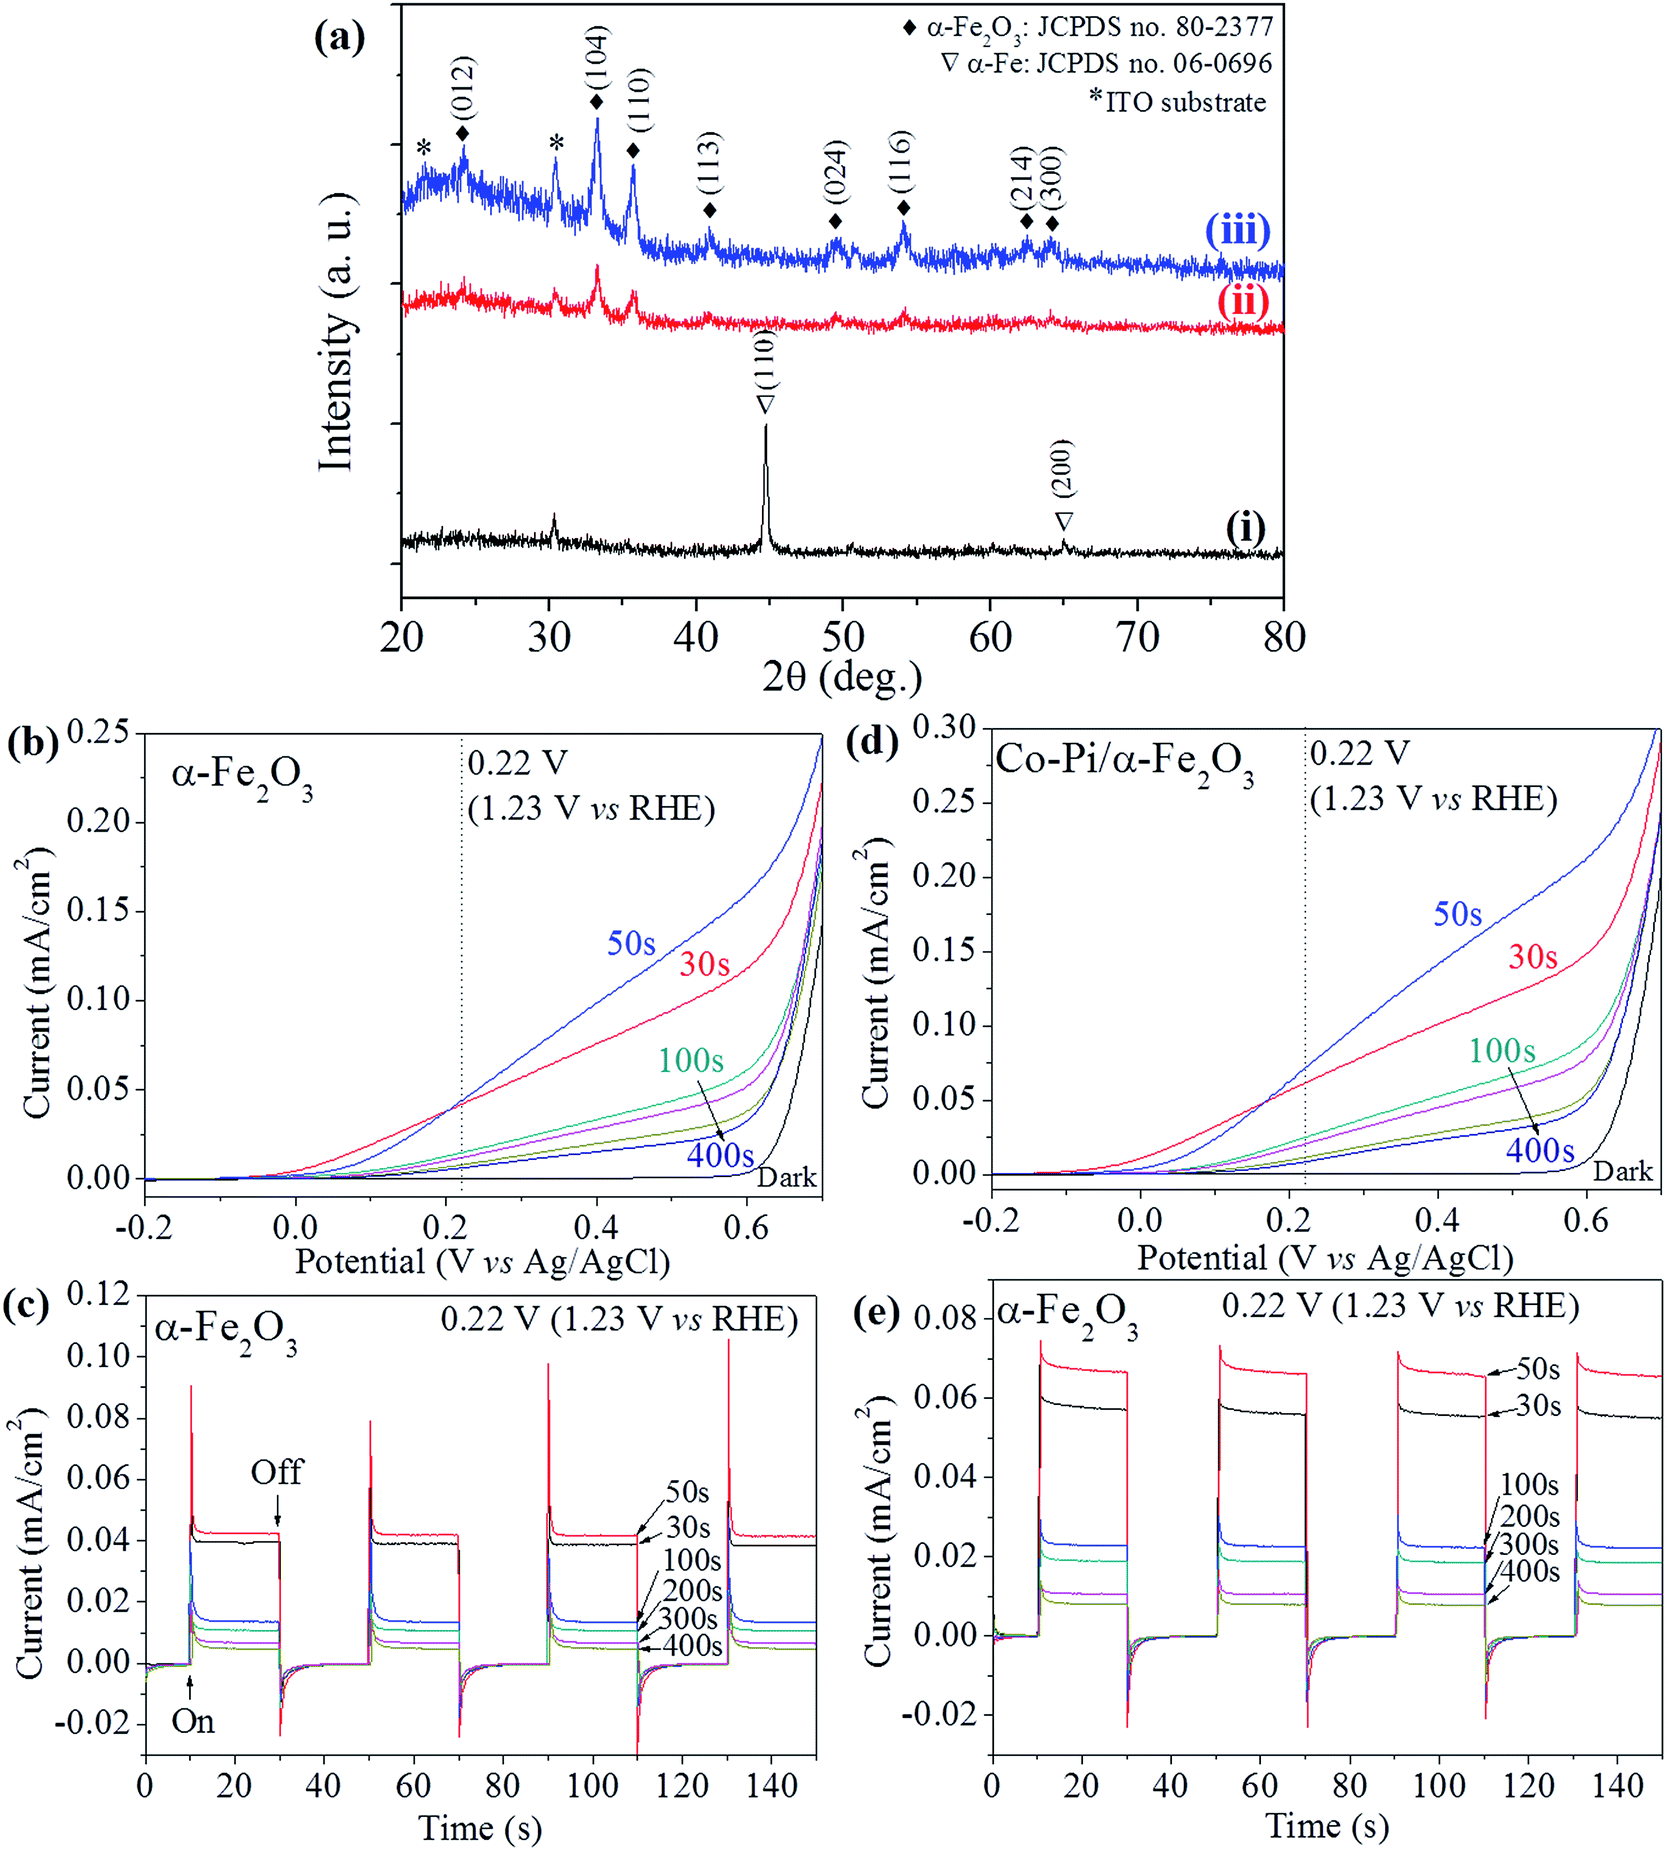 | ||
| Fig. 4 (a) XRD patterns of the typical (i) electrodeposited α-Fe, (ii) α-Fe2O3 and (iii) Co–Pi/α-Fe2O3 films. Photocurrents and photoresponses of (b and c) α-Fe2O3-χ and (d and e) Co–Pi/α-Fe2O3-χ films in 1.0 M NaOH under continuing and chopped (on and off: 20 s) 1 sun light illumination. χ = 30, 50, 100, 200, 300 and 400 s. | ||
 × 100%
| Samples | Photocurrent onset potential (V) | Photocurrent at +0.22 V (μA cm−2) | ||||
|---|---|---|---|---|---|---|
| χ | α-Fe2O3 | Co–Pi/α-Fe2O3 | ΔEonset | α-Fe2O3 | Co–Pi/α-Fe2O3 | ΔI(δ) |
| 30 s | −0.1 | −0.2 | −0.1 | 40.0 | 57.2 | 17.2 (43%) |
| 50 s | −0.1 | −0.15 | −0.05 | 42.4 | 66.8 | 24.4 (57.5%) |
| 100 s | −0.1 | −0.1 | 0 | 13.6 | 22.8 | 9.2 (67.6%) |
| 200 s | 0 | 0 | 0 | 10.8 | 18.9 | 8.1 (75%) |
| 300 s | 0 | 0 | 0 | 6.7 | 10.6 | 3.9 (58.2%) |
| 400 s | 0 | 0 | 0 | 4.8 | 8.1 | 3.3 (68.8%) |
The photocurrent onset potentials of α-Fe2O3-χ films with χ = 30, 50 and 100 s are the similar in the value of ca. −0.1 V; the others have the similar photocurrent onset potentials at 0 V. It can be easily observed that the α-Fe2O3-χ films with χ = 30, 50 and 100 s can expose the bottom layer with large area and the bottom layers of χ = 200, 300 and 400 s films are mostly covered with the dendritic structures. It indicates that the films with exposing thin bottom layer have relatively low photocurrent onset potentials and the films with relatively high density dendrites have high onset potentials. For a fine α-Fe2O3 particle film prepared by annealing the electrodeposited Fe film, the photocurrent onset potential can be as low as −0.4 V vs. Ag/AgCl as reported by Choi et al.4 After coupling with Co–Pi via photodeposition, the photocurrent onset potential of Co–Pi/α-Fe2O3-χ with χ = 30 and 50 s are shifted to negative direction by −0.1 and −0.05 V, respectively. The other films with χ = 100 to 400 s are not shifted. It indicates that the Co–Pi/α-Fe2O3-χ with relatively short χ can give the more negative photocurrent onset potentials. The possible explanation is that in the photodeposition process the competition for deposition of Co–Pi between the bottom layer and upper dendritic structures was existed; under considerations of the light intensity decay and the reduced concentration gradient, the Co–Pi should be primarily deposited on the dendritic structures rather than on the bottom layer. The photocurrent of a stable photoelectrode (photoanode or photocathode) in PEC system is determined by the difference between the current with and without light illumination. Herein, we show the photocurrent values at +0.22 V for comparison since the value of +0.22 V is the thermodynamic potential for water oxidation in our PEC system as mentioned above. The photocurrents of Co–Pi/α-Fe2O3-χ films with χ = 30 to 400 s are 57.2, 66.8, 22.8, 18.9, 10.6 and 8.1 μA cm−2 at +0.22 V, which are increased by 43%, 57.5%, 67.6%, 75%, 58.2% and 68.8%, respectively, compared with their initial α-Fe2O3 films. Obviously, the photocurrents of the bare α-Fe2O3 and Co–Pi/α-Fe2O3, especially the dendritic films with thicker thickness, are very low. Several possible attenuation factors should be mentioned in these dendritic films: the higher e−–h+ recombination probability or the presence of higher amount of surface defects.9,30 In addition, as shown in Fig. 5(a) and (b), the length of dendritic α-Fe2O3 wires, obtained at long time deposition, is too long for electrons transferring from the top to the bottom because the long electron pathway could enhance the probability of e−–h+ recombination. In addition to it, the longer dendritic α-Fe2O3 wires films have much higher charge-transfer resistance (Rct), which were investigated by the electrochemical impedance spectra (EIS) as shown in Fig. 5(c). Under the dark, the Rct of three samples tends to infinity, which indicates that the huge charge-transfer resistance exists at the interface between the electrode and the electrolyte even with an external potential of +0.22 V.31 Under 1 sun light illumination, all the Rct of three samples are reduced. The photogenerated charge carriers (e−–h+) can be separated for the water splitting reactions. Especially, the Rct of α-Fe2O3-χ films with χ = 30 and 50 s are decreased more. Therefore, the photocurrents of the α-Fe2O3 wires films obtained at short time (30 and 50 s) deposition are much better than long time deposition (>100 s). Recently, Shen36 also mentioned that only low photocurrents were obtained because the dendritic hematite wires obtained at the long time deposition were too long to achieve effective light absorption and extract the photogenerated electrons to the substrate. To get the better photoelectrochemical performance of hematite films, the ideal nanostructure is a nanowires array with diameter of 5–10 nm and length of 400–500 nm.9 After coupling with the Co–Pi co-catalyst, it is surprised that the photocurrent densities of most films can be enhanced by more than 50% regardless of the low photocurrent values at +0.22 V. The large initial anodic spikes, which occurred in the photoresponse curves of α-Fe2O3 films when the light was irradiated suddenly, were extraordinarily decreased after coupling with Co–Pi as shown in Fig. 4(c) and (e). It indicates that the Co–Pi can highly suppress the electron–hole recombination. In addition, as the reported works,4,24–26 the photodeposited Co–Pi on α-Fe2O3 surface can increase the total amount of photocurrent generated by suppressing e−–h+ recombination because of the formation of a Schottky-type heterojunction by working as co-catalyst and increases the photocurrent to O2 conversion efficiency by improving water oxidation kinetics; the Co–Pi and can also increase the lifetime of photogenerated holes in α-Fe2O3 photoanode.
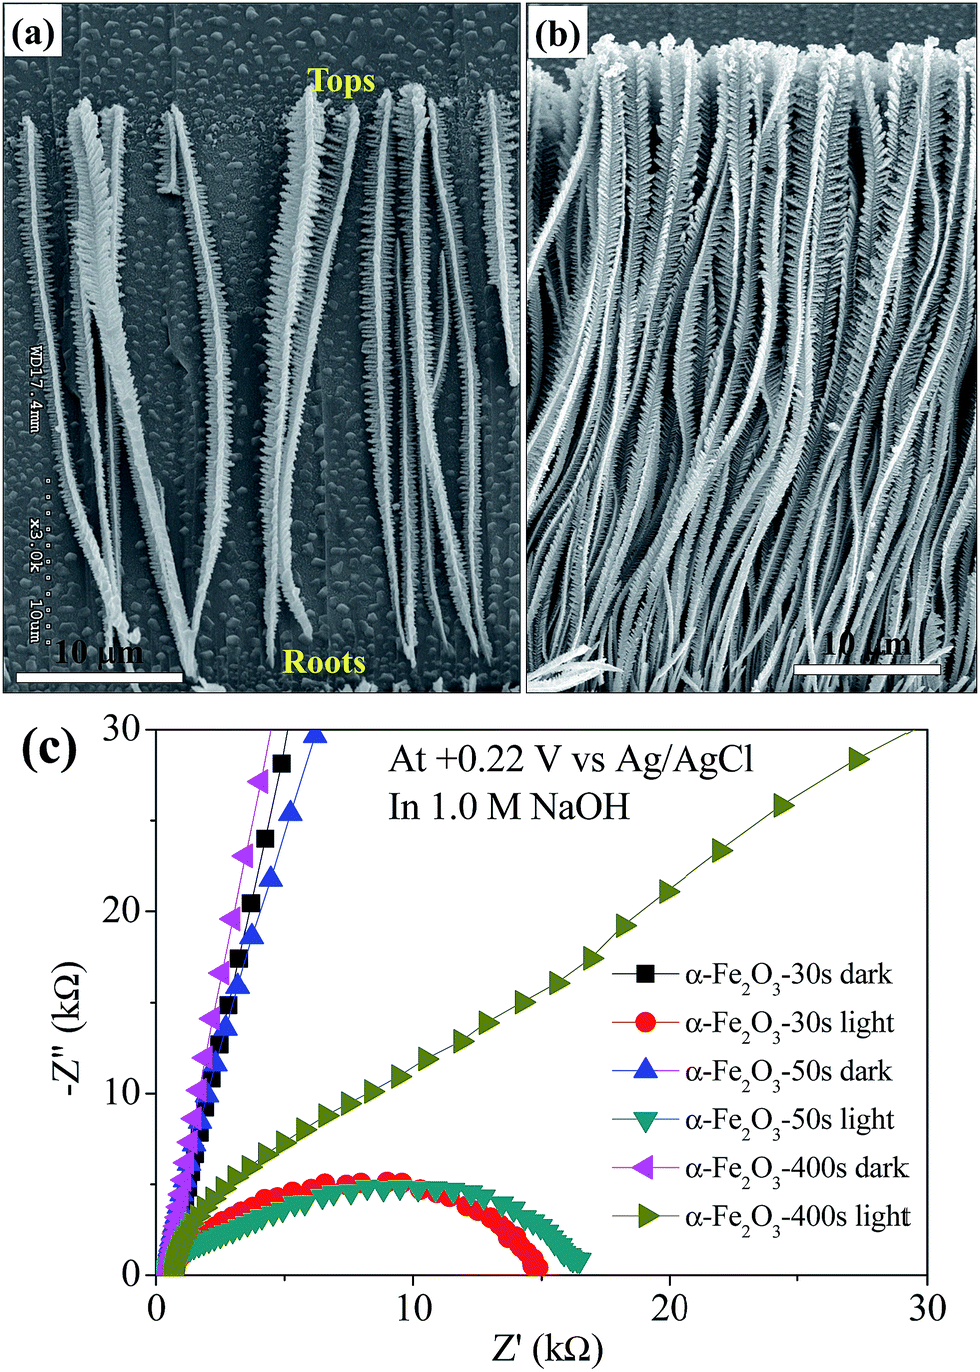 | ||
| Fig. 5 (a) and (b) SEM images of the separated α-Fe2O3 dendritic wires and the α-Fe2O3 dendritic wire array obtained at the electrodeposition time of 300 s. (c) EIS of α-Fe2O3-χ films with χ = 30, 50, and 400 with and without light illumination, which were conducted in 1.0 M NaOH solution at +0.22 V vs. Ag/AgCl. | ||
The incident photon to electron conversion efficiencies (IPCEs) of the typical α-Fe2O3-χ and Co–Pi/α-Fe2O3-χ films with χ = 30, 50 and 400 s were carried out in 1.0 M NaOH at +0.5 V vs. Ag/AgCl under monochromic light illumination as shown in Fig. 6.

 | ||
| Fig. 6 IPCE for the typical α-Fe2O3-χ and Co–Pi/α-Fe2O3-χ films with χ = 30, 50, and 400 s. IPCEs were measured in 1.0 M NaOH solution at +0.5 V vs. Ag/AgCl. | ||
 | ||
| Fig. 7 Photocurrent–time curves of α-Fe2O3-50 and Co–Pi/α-Fe2O3-50 measured at +0.5 V vs. Ag/AgCl for ∼2 h under 1 sun light illumination in 1.0 M NaOH solution. | ||
4. Conclusions
In summary, the α-Fe2O3 photoanodes with different structures can be easily prepared by calcination of the electrodeposited α-Fe films in air. The morphology of the film varies from nanoparticle to sparse dendrite, and then to close dendrite as the deposition time of α-Fe is prolonged. Their morphology-dependent photoelectrochemical properties are investigated through photocurrent and photoresponse. The α-Fe2O3 film exposing larger bottom particle layer area, such as α-Fe2O3-χ films with χ = 30 and 50 s, has low photocurrent onset potential; after coupling with Co–Pi co-catalyst, their onset potentials are shifted to negative direction. The α-Fe2O3-50, be composed of the bottom particle layer and the loose dendrites with short length, has the best photoelectrochemical performance with the photocurrent density of 66.8 μA cm−2 at +0.22 V vs. Ag/AgCl. The photocurrent of hematite films can be enhanced by more than 40%; especially, high-density dendrite films can be increased by around 70% regardless of low photocurrent values. It indicates that photodeposited Co–Pi can effectively suppress the photogenerated electron–hole recombination. This work provides a useful insight for the comparison of the different structuring hematite films and gives a direction to preparing the hematite films with high photoelectrochemical performance for water splitting. The work for decreasing the charge transfer resistance is undergoing to enhance the photocurrent of dendritic film.Acknowledgements
This work financially supported by the Korea Center for Artificial Photosynthesis (KCAP) located in Sogang University (no. 2009-0093885) funded by the Minister of Science, ICT and Future Planning (MSIP) through the National Research Foundation of Korea and the Brain Korea 21 Plus Project 2014.Notes and references
- A. Fujishima and K. Honda, Nature, 1972, 238, 37 CrossRef CAS.
- K. Hashimoto, H. Irie and A. Fujishima, Jpn. J. Appl. Phys., Part 1, 2005, 44, 8269 CrossRef CAS.
- D. K. Zhong, J. Sun, H. Inumaru and D. R. Gamelin, J. Am. Chem. Soc., 2009, 131, 6086 CrossRef CAS PubMed.
- K. J. McDonald and K.-S. Choi, Chem. Mater., 2011, 23, 1686 CrossRef CAS.
- J. S. Jang, K. Y. Yoon, X. Xiao, F.-R. F. Fan and A. J. Bard, Chem. Mater., 2009, 21, 4803 CrossRef CAS.
- J. Y. Kim, G. Magesh, D. H. Youn, J.-W. Jang, J. Kubota, K. Domen and J. S. Lee, Sci. Rep., 2013, 3, 2681 Search PubMed.
- J. H. Kennedy and K. W. Frese Jr, J. Electrochem. Soc., 1978, 125, 709 CrossRef CAS PubMed.
- U. Björkstén, J. Moser and M. Grätzel, Chem. Mater., 1994, 6, 858 CrossRef.
- P. S. Bassi, Gurudayal, L. H. Wong and J. Barber, Phys. Chem. Chem. Phys., 2014, 16, 11834 RSC.
- M. W. Kanan and D. G. Nocera, Science, 2008, 321, 1072 CrossRef CAS PubMed.
- M. W. Kanan, Y. Surendranath and D. G. Nocera, Chem. Soc. Rev., 2009, 38, 109 RSC.
- X. B. Han, Z. M. Zhang, T. Zhang, Y. G. Li, W. Lin, W. You, Z. M. Su and E. B. Wang, J. Am. Chem. Soc., 2014, 136, 5359 CrossRef CAS PubMed.
- M. D. Symes, Y. Surendranath, D. A. Lutterman and D. G. Nocera, J. Am. Chem. Soc., 2011, 133, 5174 CrossRef CAS PubMed.
- S. Y. Reece, J. A. Hamel, K. Sung, T. D. Jarvi, A. J. Esswein, J. J. H. Pijpers and D. G. Nocera, Science, 2011, 334, 645 CrossRef CAS PubMed.
- Y. Qu and X. Duan, Chem. Soc. Rev., 2013, 42, 2568 RSC.
- M. D. Kärkäs, O. Verho, E. V. Johnston and B. Åkermark, Chem. Rev., 2014, 114, 11863 Search PubMed.
- X. Li, J. Yu, J. Low, Y. Fang, J. Xiao and X. Chen, J. Mater. Chem. A, 2015, 3, 2485 CAS.
- E. M. P. Steinmiller and K. S. Choi, Proc. Natl. Acad. Sci. U. S. A., 2009, 106, 20633 CrossRef CAS PubMed.
- S. K. Pilli, T. E. Furtak, L. D. Brown, T. G. Deutsch, J. A. Turner and A. M. Herring, Energy Environ. Sci., 2011, 4, 5028 CAS.
- T. H. Jeon, W. Choi and H. Park, Phys. Chem. Chem. Phys., 2011, 13, 21392 RSC.
- D. E. Wang, R. G. Li, J. Zhu, J. Y. Shi, J. F. Han, X. Zong and C. Li, J. Phys. Chem. C, 2012, 116, 5082 CAS.
- F. F. Abdi, N. Firet and R. van de Krol, ChemCatChem, 2013, 5, 490 CrossRef CAS PubMed.
- E. R. Young, R. Costi, S. Paydavosi, D. G. Nocera and V. Bulovic, Energy Environ. Sci., 2011, 4, 2058 CAS.
- M. Barroso, A. J. Cowan, S. R. Pendlebury, M. Grätzel, D. R. Klug and J. R. Durrant, J. Am. Chem. Soc., 2011, 133, 14868 CrossRef CAS PubMed.
- D. K. Zhong, M. Cornuz, K. Sivula, M. Grätzel and D. R. Gamelin, Energy Environ. Sci., 2011, 4, 1759 CAS.
- Q. Zeng, J. Bai, J. Li, L. Xia, K. Huang, X. Li and B. Zhou, J. Mater. Chem. A, 2015, 3, 4345 CAS.
- J. Yang, D. Wang, H. Han and C. Li, Acc. Chem. Res., 2013, 46, 1900 CrossRef CAS PubMed.
- L. Fu, H. Yu, C. Zhang, Z. Shao and B. Yi, Electrochim. Acta, 2014, 136, 363 CrossRef CAS PubMed.
- R. Qiu, J. Y. Zheng, H. G. Cha, M. H. Jung, K. J. Lee and Y. S. Kang, Nanoscale, 2012, 4, 1565 RSC.
- J. Y. Zheng, M. J. Kang, G. Song, S. I. Son, S. P. Suh, C. W. Kim and Y. S. Kang, CrystEngComm, 2012, 14, 6957 RSC.
- J. Y. Zheng, G. Song, J. Hong, T. K. Van, A. U. Pawar, D. Y. Kim, C. W. Kim, Z. Haider and Y. S. Kang, Cryst. Growth Des., 2014, 14, 6057 CAS.
- J. Y. Zheng, Z. L. Quan, G. Song, C. W. Kim, H. G. Cha, T. W. Kim, W. Shin, K. J. Lee, M. H. Jung and Y. S. Kang, J. Mater. Chem., 2012, 22, 12296 RSC.
- P. S. Shinde, G. H. Go and W. J. Lee, J. Mater. Chem., 2012, 22, 10469 RSC.
- X. Zhang, Y. Liu, S. T. Lee, S. Yang and Z. Kang, Energy Environ. Sci., 2014, 7, 1409 CAS.
- G. Read, Y. Park and K.-S. Choi, J. Phys. Chem. Lett., 2012, 3, 1872 CrossRef.
- S. Shen, J. Mater. Res., 2014, 29, 29 CrossRef CAS.
| This journal is © The Royal Society of Chemistry 2015 |