Synthesis of nanoporous hypercrosslinked polyaniline (HCPANI) for gas sorption and electrochemical supercapacitor applications

Vivek Sharma, Asit Sahoo, Yogesh Sharma and Paritosh Mohanty*
Department of Applied Science & Engineering, IIT Roorkee, Saharanpur Campus, Saharanpur-247001, India. E-mail: paritosh75@gmail.com; Fax: +91-132-271-4311; Tel: +91-132-271-4338

Received 17th February 2015 , Accepted 14th May 2015

First published on 15th May 2015


Abstract

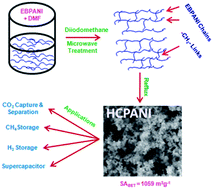
Nanoporous hypercrosslinked polyaniline with SABET of 1059 m2 g−1 has been synthesized. The specimen showed CO2 and CH4 uptake of 3.52 and 1.01 mmol g−1, respectively at 273 K, and H2 storage capacity of 1.85 wt% at 77 K and 1 bar. The material has a high specific capacitance of 410(±5) F g−1 and has shown good cyclability (100% retention) up to 1000 cycles.

1. Introduction

Recently, the high energy demands and the elevation of content of greenhouse gases in the environment has forced scientific communities to look for green and alternative energy resources. Coal would be a greener energy if the CO2 could be captured from the flue gas streams of the coal fired power plants in an economical manner. Thus, there is an urgent need to find the right adsorbent for CO2 capture. Liquid organic amines have been tested but were not that successful because of their very high regeneration cost.1 Recently, porous solid adsorbents with high surface areas such as, activated carbons,2 conjugated microporous polymers (CMPs),3 metal–organic frameworks (MOFs),4 porous electron rich covalent organonitridic frameworks (PECONFs),5 and amine-functionalized silicas,6 have been investigated. Another clean energy option is, using H2 in fuel cells to reduce the dependence on fossil fuels. The H2 economy is very much dependent on the suitable storage systems. Again for this application, nanoporous high surface area solid adsorbents7–10 have been investigated keeping in mind the target of 5.5 wt% and 40 g of H2 L−1 by the year of 2017 set by the U. S. Department of Energy (DOE).7

The uses of non-conventional energies are limited due to the regeneration and storage problems. Recently, supercapacitors have been received great attention as the energy storage device due to their high power density, fast charging discharging cycles and long cycle life.11–14 Among the components used in the supercapacitors which could manipulate the properties and hence applications, majority of the studies were focused on the electrode materials.11–13 The dominance of carbonaceous materials as electrodes in the commercial supercapacitors was mostly due to low cost, good resistance to corrosion, excellent cycling stability, electrode life, and safe operations.11–13 However, low energy density and low specific capacitance restrict their wide scale use.11–13 Metal oxides (RuO2, MnO2, NiO, Co3O4, and V2O5) and polymers [polyaniline (PANI), polypyrrole (PPy), poly(3,4-ethylenedioxythiophene) PEDOT] with high theoretical capacitance have been investigated.11–14 Among metal oxides, RuO2·0.5H2O with theoretical capacitance of 1360 F g−1 received considerable attention, but the high cost hinders its commercial acceptability.11,13 Moreover, abundance of the element and environmental compatibility play important role in deciding commercial viability of the materials.

Considering this, polymers seem better alternative to both carbonaceous materials and metal oxides as electrode material due to their low cost, low environmental impact, high specific capacitance, reversible faradic reactions and controlled redox reaction.11,13,14 Among the polymers, PANI with theoretical specific capacitance of 2000 F g−1 has been extensively studied.15 However, the highest experimental capacitance reported were in the range of 690 to 950 F g−1 for different pure PANI nanostructures.13,14 The difference in theoretical and experimentally observed values could be attributed to the less effective percentage of PANI that contributes to the capacitance.15 Furthermore, PANI undergoes volumetric swelling and shrinkage during charging/discharging at the electrode/electrolyte interface leading to structural breakdown and capacitance decay. These problems can be circumvent by synthesizing PANI with high specific surface area (SABET) and well defined pore size.11,12,16 The ideal pore size should be close to the ion size of the electrolyte and deviation from this led to a significant drop in theoretical capacitance.16

The ideal way to improve the surface area and pore size distribution (PSD) of PANI is crosslinking and hypercrosslinking the linear chains by both thermal and chemical routes.17–19 For example, high SABET of 630 m2 g−1 has been achieved by hypercrosslinking of PANI.18 Similarly, the SABET has been increased from 20 to 349 m2 g−1 by thermal crosslinking of PANI chains.17 Here, we report a facile N-alkylation of PANI chains to produce HCPANI with permanent porosity and high surface area of 1059 m2 g−1 using a microwave assisted method. Moreover, the HCPANI has shown not only good CO2 and H2 storage capacity but also shown very good supercapacitance properties.

2. Experimental

2.1. Chemicals

The reagents used in the synthesis were of analytical grades and used as-received without any purification. Aniline hydrochloride (Alfa Aesar, UK), ammonium persulfate (Himedia, India), ammonia solution (Merck, India), N,N-dimethylformamide (DMF) (Fisher Scientific, India) and diiodomethane (Himedia, India) were procured.

2.2. Synthesis of EBPANI and HCPANI

Typically, 2.59 g of aniline hydrochloride was dissolved in 50 ml distilled water. To this solution an aqueous solution of ammonium persulfate was added drop wise followed by ultrasonication for 30 min. A green coloured precipitate was obtained. The product was deprotonated by stirring it in an aqueous solution of ammonia for one day. A blue coloured product was obtained which was filtered out and dried at RT. This product was designated as EBPANI and was used for the hypercrosslinking (Scheme 1).
image file: c5ra03016a-s1.tif
Scheme 1 Reaction scheme for the synthesis of HCPANI.

In a typical hypercrosslinking procedure, 0.11 g of EBPANI was dissolved in 10 ml of DMF and 1.1 g of anhydrous potassium carbonate was added to it followed by ultrasonication for 15 min. 2 ml of diiodomethane was added to it and the reaction mixture was placed in microwave reactor (power = 400 W) at 130 °C for 15 min. The precipitate was filtered and refluxed in DMF for 72 h, washed with water and ethanol and dried in vacuum oven at 60 °C. The obtained product was designated as HCPANI (Scheme 1).

2.3. Characterization

FTIR analysis was carried out using Perkin-Elmer infrared spectrophotometer in the wave number range 4000 to 500 cm−1. Elemental analysis of EBPANI and HCPANI was carried out using CHNSO analyzer (Flash 2000, Thermo Scientific, UK). The 13C CPMAS-NMR spectrum of HCPANI was obtained at 400 MHz using JEOL RESONANCE ECX-400. The thermogravimetric analysis were carried out in N2 atmosphere using EXSTAR TG/DTA 6300 instrument with a heating rate of 10 °C min−1. XRD patterns of the specimens were obtained in the 2θ range of 10–70° with Rigaku, Ultima-IV X-ray diffractometer using Cu Kα radiation source (λ = 1.5405 Å) at a scanning speed of 4° min−1. FESEM images were taken on MIRA3 TESCAN at suitable voltage and magnifications. TEM images were obtained with TECNAIG2S-TWIN with an operating voltage of 200 kV by dispersing the specimen over the carbon coated copper grids. The porosity, surface area and gas sorption studies were done using Autosorb-iQ instrument (Quantachrome, USA). Prior to the analysis, the samples were degassed in vacuum at 120 °C for 6 h. Supercapacitive performance of EBPANI and HCPANI was studied using cyclic voltammetry (CV) in the potential range of 0–0.6 V, with multichannel potentiostat/galvanostat (AUTOLAB:MAC-80039) in three electrode configuration using aqueous 2 M KOH as electrolyte. The working electrode was prepared using HCPANI/EBPANI, conducting carbon (Super P), and polyvinylidenefluoride (PVdF) in wt% ratio of 70[thin space (1/6-em)]:[thin space (1/6-em)]15[thin space (1/6-em)]:[thin space (1/6-em)]15, respectively.

3. Results and discussion

In order to confirm the formation of EBPANI and HCPANI, the synthesized specimens have been investigated by FTIR spectroscopy. Fig. 1 shows the FTIR spectra of EBPANI and HCPANI. Four strong bands at 1160, 1300, 1500, and 1590 cm−1 were observed due to the N[double bond, length as m-dash]Q[double bond, length as m-dash]N (Q denotes quinoid ring) vibrations, C–N stretching vibrations, C[double bond, length as m-dash]C stretching deformation of benzenoid, and quinoid rings, respectively, confirms the formation of EBPANI.20–22 Appearance of C–H stretching vibrations of CH2 groups around 2920 and 2856 cm−1 as shown in Fig. 1b confirms the hypercrosslinking in HCPANI.21 Additionally, the bands due to the C[double bond, length as m-dash]C stretching deformation of quinoid and benzenoid rings have been shifted slightly towards higher wavenumbers and the appearance of the band at 1235 cm−1, which is attributed to the aliphatic C–N stretching, further supports the N-alkylation.18,21,22
image file: c5ra03016a-f1.tif
Fig. 1 FTIR spectra of (a) EBPANI and (b) HCPANI.

The hypercrosslinking phenomenon was further studied by the CP-MAS NMR spectroscopy. Fig. 2 shows the 13C CP-MAS NMR spectrum of HCPANI. The signals (shown in inset of Fig. 2) around 117, 128, 133, 142, 146 and 159 ppm are attributed to the aromatic carbon, and hence, confirms the presence of benzenoid as well as quinoid ring in the structure of HCPANI.23 Furthermore, the broad signal centred at 35 ppm could be indexed to the methylene carbon confirming the hypercrosslinking.24


image file: c5ra03016a-f2.tif
Fig. 2 13C CPMAS-NMR spectrum of HCPANI.

The formation of the EBPANI and HCPANI has been investigated by CHNSO analysis. Assuming a complete polymerization of aniline followed by deprotonation, the theoretical composition of the EBPANI would be C6.0H4.5N1 and HCPANI would be C6.2H4.5N1. However, the experimental values for the EBPANI and HCPANI are C6.0H4.8N1O0.1 and C5.6H4.8N1O0.2, respectively. The slight differences in the theoretical and experimental elemental composition could be attributed to several factors, such as, moisture adsorption, partial oxidation of PANI chain,25 incomplete hypercrosslinking, and entrapped solvent in the high surface area HCPANI material. This difference in elemental composition is common in porous polymers as reported earlier.5,26

The microstructure of the obtained specimens has been investigated by FESEM and TEM. The FESEM image (Fig. 3a) of the EBPANI shows nearly spherical or ellipsoid particles of size in the range of 150 to 250 nm. However, on hypercrosslinking the particles of size in the range of 70 to 200 nm become agglomerated to form network (Fig. 3b and c). The individual particles are highly porous in nature with wormhole like pores of sizes less than 2 nm and are lacking the long range pore ordering as can be seen with the high magnification TEM image (Fig. 3d). The SAED pattern (inset of Fig. 3c) indicates the formation of an amorphous specimen, which was further confirmed from the powder XRD pattern (Fig. S1).


image file: c5ra03016a-f3.tif
Fig. 3 FE-SEM images of (a) EBPANI and (b) HCPANI. (c) TEM image of HCPANI and (d) high magnification TEM image of HCPANI. The SAED pattern of HCPANI is shown in the inset of (c).

It is important to note that the hypercrosslinking substantially improves the thermal stability. For example, the thermal degradation of EBPANI starts as early as 220 °C, whereas, in HCPANI, it starts at a much higher temperature of 400 °C as studied by the TGA/DTG in Fig. S2. The thermal stability of HCPANI is in the higher side compared to the reported literatures of PANI.27,28 The initial mass loss in both the sample below 120 °C attributed to the desorption of the adsorbed moisture, solvent etc. and was commonly observed in high surface area nanoporous materials.5,26 This further corroborates the results obtained from the elemental analysis.

The porous microstructure of the HCPANI as depicted from the TEM images encouraged us to study the N2 sorption analysis. Fig. 4a shows the N2 sorption isotherms of EBPANI and HCPANI. The HCPANI has a type-I isotherm with a small hysteresis at the high pressure range that extended towards the lower pressure. Such hysteresis is observed typically in complex microporous materials with throats and cavities, or could be attributed to the swelling effect also.29 The specimen has basically trimodal pore structure. Majority of the pores are in the 0.65 to 0.85 nm range with some pores between 1.25 to 2.05 nm range. In addition to that the mesopores with sizes in the range of 2.45 to 10 nm has been observed (Fig. 4b and S3). Thus, the HCPANI has a hierarchical porous structure with the presence of ultramicro, micro and mesoporosity. The HCPANI has a high specific surface area of (SABET) 1059 and (SALang) 1416 m2 g−1 as calculated by BET and Langmuir equations (Fig. S4), respectively, with a total pore volume of 0.77 cm3 g−1. To the best of our knowledge, this is the highest achieved surface area for any form of PANI. As expected the EBPANI has a much lower SABET of 44 m2 g−1 (Fig. S4). Thus, the hypercrosslinking has enhanced the specific surface area of EBPANI to more than 24 times. Detailed textural properties of both the specimens are given in the Table S1.


image file: c5ra03016a-f4.tif
Fig. 4 (a) N2 sorption isotherms (measured at 77 K) and (b) NLDFT pore size distribution of EBPANI and HCPANI.

The moderately high surface area, ultra small pore size and presence of the nitrogen atoms with lone pair of electrons in the HCPANI frameworks prompted us to study the CO2 capture properties. The HCPANI could reversibly capture 3.52 mmol g−1 (15.5 wt%) of CO2 at 273 K and 1 bar (Fig. 5a). At 298 K, the CO2 capture capacity becomes 2.15 mmol g−1 (9.5 wt%). Although, the CO2 capture capacity is not among the highest reported materials but still towards the higher side considering the specific surface area.8,30,31 Moreover, the facile synthesis, high thermal stability and low cost of the monomer units have major advantages over many other nanoporous materials with higher CO2 capture capacity.9,32 Additionally, this is the first report on the CO2 capture studies for any form of PANI. The isosteric heat of adsorption (Qst) has a moderate value of 32.26 kJ mol−1 at the onset (Fig. S5a) indicates that the interaction of the CO2 with the framework is neither purely physisorption nor chemisorption. It is worth mentioning that the HCPANI has higher CO2 uptake and higher Qst compared to some of the recently reported microporous organic polymers even having higher specific surface areas.30,31 This indicates that the Lewis acidic and Lewis basic interaction between CO2 and amine groups of HCPANI, and surface dipole interaction play important role.5,26 The CH4 sorption properties of HCPANI was further investigated (Fig. 5b). The HCPANI shows reversible high CH4 uptake of 1.01 and 0.53 mmol g−1 at 273 and 298 K, respectively. The Qst was calculated to be 24.95 kJ mol−1 (Fig. S5b). The lower value of Qst for CH4 compared to CO2 could be due to non polar nature of CH4 molecule. To evaluate the potential of using HCPANI as an adsorbent, the selectivity of different gases has been calculated. The selectivity of CO2[thin space (1/6-em)]:[thin space (1/6-em)]N2, CO2[thin space (1/6-em)]:[thin space (1/6-em)]CH4 and CH4[thin space (1/6-em)]:[thin space (1/6-em)]N2 at 273 K was calculated to be 57, 13 and 4.5, respectively (Fig. 5c).


image file: c5ra03016a-f5.tif
Fig. 5 (a) CO2 and (b) CH4 sorption isotherms measured at 273 and 298 K. (c) Gas selectivity of HCPANI measured at 273 K and (d) H2 sorption isotherm measured at 77 K and 1.0 bar.

The HCPANI was further investigated for H2 storage application (Fig. 5d) due to the presence of the ultramicropores. The H2 storage capacity was found to be 1.85 wt% at 77 K and 1 bar. This H2 storage capacity is much higher than any form of PANI (0.96 wt% was best reported under similar experimental conditions),18,19 however, is less than few of the other reported microporous polymers (Table S2) such as, BILP-6 (2.20 wt%),9 SPOP-3 (2.22 wt%),8 and CPOP-1 (2.80 wt%).10 The Qst for H2 sorption was calculated to be 5.46 kJ mol−1 (Fig. S6).

The high surface area and narrow pore size distribution of the HCPANI and its surface properties encouraged us to explore the feasibility of using HCPANI as supercapacitor electrode material. The cyclic voltammetry (CV) analyses of the EBPANI and HCPANI were performed and corresponding curves are shown in Fig. 6. It is interesting to note that the shape of CV of the HCPANI is almost rectangular, whereas, redox peaks are depicted in EBPANI. In supercapacitor, both EDLC and redox reaction do contribute to storage properties. The CV curves of HCPANI and EBPANI are attributed to the formation of EDLC and redox mechanism, respectively. The clear difference in shape of CV of EBPANI and HCPANI indicates that the total capacitance in HCPANI is spread over entire voltage range and signifies the importance of surface area and narrow pore distribution as compared to EBPANI. The value of specific capacitance (Cs) in HCPANI and EBPANI were calculated to be 410(±5) and 260(±5) F g−1, respectively, at the scan rate of 3 mV s−1. The Cs value of HCPANI is in the higher side of the reported Cs for PANI and found to be better than several recent reports.13,14,33,34


image file: c5ra03016a-f6.tif
Fig. 6 Cyclic voltammetry curves of (a) EBPANI and (b) HCPANI. (c) Specific capacitance of HCPANI and EBPANI at different scan rates and (d) charging–discharging cycles at a constant scan rate of 3 mV s−1.

Further, the CV of EBPANI and HCPANI has been measured at various scan rates. It has been observed that in HCPANI, the Cs value decreases from 410(±5) to 200(±5) F g−1 with the increase in the scan rate from 3 to 10 mV s−1. The Cs value of 120(±10) F g−1 remains almost constant at the scan rate of 20 to 30 mV s−1. However, in the EBPANI, a continuous decrease in the Cs value was observed with an increase in the scan rate. The electrochemical impedance spectroscopy of the HCPANI was further studied and shown in Fig. S9. A sloppy region was observed towards low frequency represents the Warburg impedance. The large region of Warburg curve in Nyquist plot shows a large variation in the ion diffusion path length and increased obstruction of ion movement. We believe this is the major reason for not observing the capacitance in the higher side although the HCPANI has a high surface area of 1059 m2 g−1. The cyclability data up to 1000 cycles for HCPANI was also recorded and shown in Fig. 6d, where a stable Cs value of 410(±5) F g−1 at scan rate of 3 mV s−1 was obtained. This good rate capability and high value of Cs in HCPANI is ascribed to unique nanoporous structure and high surface area that seem to provide maximum active area of interaction with electrolyte ions and thereby the improved capacitive performance was obtained in comparison to EBPANI.

4. Conclusions

In summary, hypercrosslinking of emeraldine base (EBPANI) by a facile microwave assisted process resulted in the increase in the surface area from 44 m2 g−1 in EBPANI to 1059 m2 g−1 in the hypercrosslinked polyaniline (HCPANI). The high surface area, ultramicropores and the presence of nitrogen in the framework led to a high CO2 and H2 storage capacity. The material has shown very good supercapacitive performance without losing the capacitance, Cs = 410(±5) F g−1 at scan rate of 3 mV s−1, over 1000 cycles. Thus, the HCPANI has the potential to be used as the material for clean energy generation and storage.

Acknowledgements

The work is supported by DST, Govt. of India [Grant no. DST/IS-STAC/CO2-SR-132/12(G)]. VS acknowledges the CSIR, Govt. of India for the SRF fellowship.

Notes and references

  1. D. M. D'Alessandro, B. Smit and J. R. Long, Angew. Chem., Int. Ed., 2010, 49, 6058–6082 CrossRef PubMed .
  2. N. P. Wickramaratne and M. Jaroniec, ACS Appl. Mater. Interfaces, 2013, 5, 1849–1855 CAS .
  3. Y. Xie, T. T. Wang, X. H. Liu, K. Zou and W. Q. Deng, Nat. Commun., 2013, 4, 1960,  DOI:10.1038/ncomms2960 .
  4. H. Furukawa, K. E. Cordova, M. O'Keeffe and O. M. Yaghi, Science, 2013, 341, 1230444–1230451 CrossRef PubMed .
  5. P. Mohanty, L. D. Kull and K. Landskron, Nat. Commun., 2011, 2, 401,  DOI:10.1038/ncomms1405 .
  6. J. C. Hicks, J. H. Drese, D. J. Fauth, M. L. Gray, G. Qi and C. W. Jones, J. Am. Chem. Soc., 2008, 130, 2902–2903 CrossRef CAS PubMed .
  7. M. P. Suh, H. J. Park, T. K. Prasad and D. W. Lim, Chem. Rev., 2012, 112, 782–835 CrossRef CAS PubMed .
  8. Q. Chen, J. X. Wang, Q. Wang, N. Bian, Z. H. Li and B. H. Han, Macromolecules, 2011, 44, 7987–7993 CrossRef CAS .
  9. M. G. Rabbani, T. E. Reich, R. M. Kassab, K. T. Jackson and H. M. El-Kaderi, Chem. Commun., 2012, 48, 1141–1143 RSC .
  10. Q. Chen, M. Luo, P. Hammershoj, D. Zhou, Y. Han, B. W. Laursen, C. G. Yan and B. H. Han, J. Am. Chem. Soc., 2012, 134, 6084–6087 CrossRef CAS PubMed .
  11. G. Wang, L. Zhang and J. Zhang, Chem. Soc. Rev., 2012, 41, 797–828 RSC .
  12. M. Zhi, C. Xiang, J. Li, M. Li and N. Wu, Nanoscale, 2013, 5, 72–88 RSC .
  13. W. Chen, R. B. Rakhi and H. N. Alshareef, J. Phys. Chem. C, 2013, 117, 15009–15019 CAS .
  14. K. Wang, J. Huang and Z. Wei, J. Phys. Chem. C, 2010, 114, 8062–8067 CAS .
  15. H. Li, J. Wang, Q. Chu, Z. Wang, F. Zhang and S. Wang, J. Power Sources, 2009, 190, 578–586 CrossRef CAS PubMed .
  16. C. Largeot, C. Portet, J. Chmiola, P. L. Taberna, Y. Gogotsi and P. Simon, J. Am. Chem. Soc., 2008, 130, 2730–2731 CrossRef CAS PubMed .
  17. M. Ayad and S. Zaghlol, Chem. Eng. J., 2012, 204–206, 79–86 CrossRef CAS PubMed .
  18. J. Germain, J. M. J. Frechet and F. Svec, J. Mater. Chem., 2007, 17, 4989–4997 RSC .
  19. J. Germain, F. Svec and J. M. J. Frechet, Chem. Mater., 2008, 20, 7069–7076 CrossRef CAS .
  20. M. Trchova, J. Stejskal and J. Prokes, Synth. Met., 1999, 101, 840–841 CrossRef CAS .
  21. W. Y. Zheng and K. Levon, Macromolecules, 1994, 27, 7754–7768 CrossRef CAS .
  22. B. Stuart, Infrared Spectroscopy: Fundamentals and Applications, John Wiley & Sons, 2004, p. 80 Search PubMed .
  23. S. Kaplan, E. M. Conwell, A. F. Richter and A. G. MacDiarmid, J. Am. Chem. Soc., 1988, 110, 7647–7651 CrossRef CAS .
  24. C. D. Wood, B. Tan, A. Trewin, H. Niu, D. Bradshaw, M. J. Rosseinsky, Y. Z. Khimyak, N. L. Campbell, R. Kirk, E. Stockel and A. I. Cooper, Chem. Mater., 2007, 19, 2034–2048 CrossRef CAS .
  25. J. Stejskal, Pure Appl. Chem., 2002, 74, 857–867 CrossRef CAS .
  26. P. Rekha, U. Sahoo and P. Mohanty, RSC Adv., 2014, 4, 34860–34863 RSC .
  27. Z. Qiang, G. Liang, A. Gu and L. Yuan, Mater. Lett., 2014, 115, 159–161 CrossRef CAS PubMed .
  28. C. H. B. Silva, A. M. D. C. Ferreira, V. R. L. Constantino and M. L. A. Temperini, J. Mater. Chem. A, 2014, 2, 8205–8214 CAS .
  29. P. M. Budd, A. Butler, J. Selbie, K. Mahmood, N. B. McKeown, B. Ghanem, K. Msayib, D. Book and A. Walton, Phys. Chem. Chem. Phys., 2007, 9, 1802–1808 RSC .
  30. S. Qiao, Z. Du and R. Yang, J. Mater. Chem. A, 2014, 2, 1877–1885 CAS .
  31. S. Yao, X. Yang, M. Yu, Y. Zhang and J. X. Jiang, J. Mater. Chem. A, 2014, 2, 8054–8059 CAS .
  32. Y. Zhu, H. Long and W. Zhang, Chem. Mater., 2013, 25, 1630–1635 CrossRef CAS .
  33. S. Chaudhari, Y. Sharma, P. S. Archana, R. Jose, S. Ramkrishna, S. Mhaisalkar and M. Srinivasan, J. Appl. Polym. Sci., 2013, 129, 1660–1668 CrossRef CAS PubMed .
  34. J. Yan, T. Wei, Z. Fan, W. Qian, M. Zhang, X. Shen and F. Wei, J. Power Sources, 2010, 195, 3041–3045 CrossRef CAS PubMed .

Footnote

Electronic supplementary information (ESI) available: XRD, TGA/DTG thermograms, isosteric heat of adsorption, gas sorption isotherms and gas selectivity of EBPANI, multi-point BET and Langmuir plots, PSD of HCPANI and EBPANI, detailed textural properties, and comparative study of H2 storage, electrochemical impedance spectroscopy. See DOI: 10.1039/c5ra03016a

This journal is © The Royal Society of Chemistry 2015
Click here to see how this site uses Cookies. View our privacy policy here.