
 Open Access Article
 This Open Access Article is licensed under a
 Creative Commons Attribution 3.0 Unported Licence
The system Ce–Zn–Si for <33.3 at.% Ce: phase relations, crystal structures and physical properties†
Fainan
Failamani
a,
Andriy
Grytsiv
af,
Raimund
Podloucky
a,
Herwig
Michor
b,
Ernst
Bauer
bf,
Pavel
Brož
cd,
Gerald
Giester
e and
Peter
Rogl
*af
aInstitute of Physical Chemistry, University of Vienna, Währingerstraße 42, A-1090 Vienna, Austria. E-mail: fai.failamani@gmail.com; andriy.grytsiv@univie.ac.at; raimund.podloucky@univie.ac.at; peter.franz.rogl@univie.ac.at; Fax: +43 142779524; Tel: +43 1427752456
bInstitute of Solid State Physics, Vienna University of Technology, Wiedner Hauptstraße 8-10, A-1040 Vienna, Austria. E-mail: michor@ifp.tuwien.ac.at; bauer@ifp.tuwien.ac.at; Fax: +43 15880113199; Tel: +43 15880113160
cMasaryk University, Faculty of Science, Department of Chemistry, Kotlarska 2, Brno 61137, Czech Republic
dMasaryk University, Central European Institute of Technology, CEITEC, Kamenice 753/5, Brno 62500, Czech Republic. E-mail: broz@chemi.muni.cz; Fax: +420 549492443; Tel: +420 549493299
eInstitute of Mineralogy and Crystallography, University of Vienna, Althanstraße 14, A-1090 Vienna, Austria. E-mail: gerald.giester@univie.ac.at; Fax: +43 14277853235; Tel: +43 1427753235
fChristian Doppler Laboratory for Thermoelectricity, Vienna University of Technology, Wiedner Hauptstraße 8-10, A-1040 Vienna, Austria
First published on 16th March 2015
Abstract
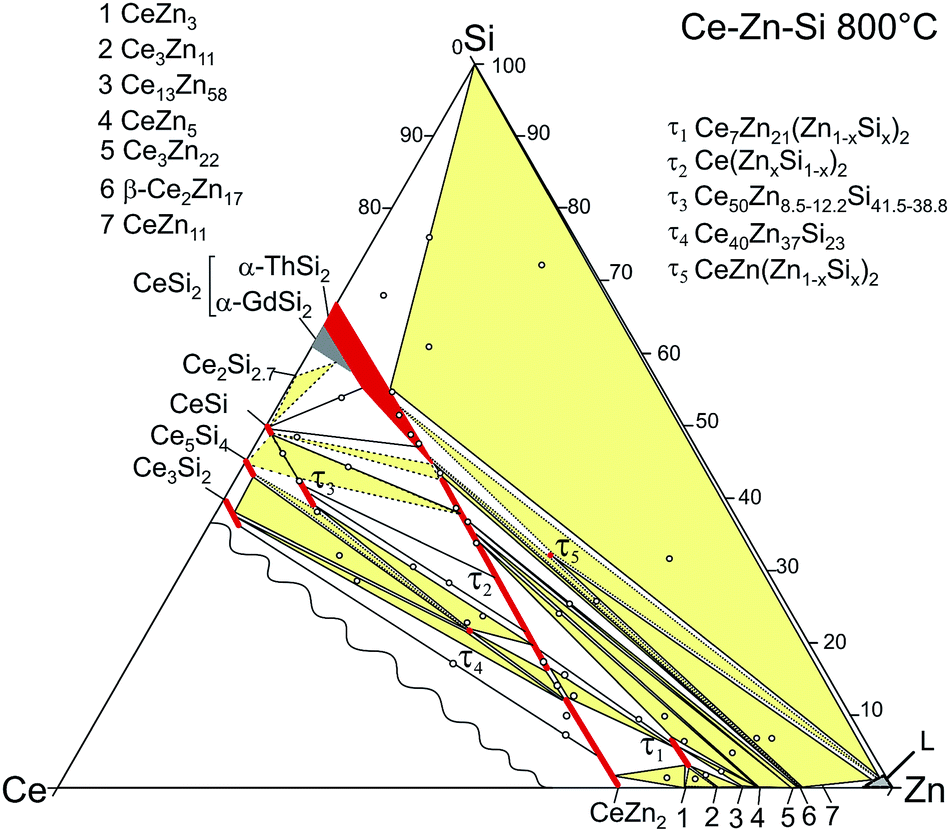
Phase equilibria of the system Ce–Zn–Si have been determined for the isothermal section at 600 °C for <33.3 at.% Ce by XRPD and EPMA. This partial section is characterized by the formation of five ternary compounds with homogeneity regions at constant Ce-content and partial substitution of Zn/Si: τ1-Ce7Zn21(Zn1−xSix)2 (unique type; 0.45 ≤ x ≤ 0.99), τ2-Ce(Si1−xZnx)2 (AlB2-type; 0.36 ≤ x ≤ 0.73), τ5-CeZn(Zn1−xSix)2 (CeNiSi2-type; 0.68 ≤ x ≤ 0.76), τ6-CeZn2(Si1−xZnx)2 (ThCr2Si2-type; 0.25 ≤ x ≤ 0.30) and τ7-Ce37Zn48Si15 (structure unknown). Whereas τ1, τ2 and τ5 are stable at 600 and 800 °C, the phases τ6, τ7 are unstable at 800 °C. Atom site distribution in the crystal structures of τ5, τ6 and {La,Ce}7Zn21(Zn1−xGex)2 have been elucidated from X-ray intensity refinements on single crystals. The small amounts of the stabilizing tetrel element in {La,Ce}7Zn21[Zn1−xSi(Ge)x]2 suggest a hypothetical binary phase “{La,Ce}7Zn23”. The stabilizing effect of Ge in Ce7Zn23−xGex has been elucidated from density functional theory (DFT) calculations discussing the electronic structure in terms of the density of states (DOS) and defining enthalpies of formation for Ce7Zn23−xGex (x = 0, 0.5, 2) as well as for several neighbouring binary Ce–Zn phases. A Schultz–Scheil diagram for the solidification behaviour in the (Zn,Si)-rich part of the diagram was constructed from DTA measurements in closed silica crucibles along with partial isothermal sections determined in the temperature range from 400 to 900 °C. The phases τ5 and τ6 both form in degenerate ternary peritectic reactions: L + CeSi2,β-Ce2Zn17 ⇔ τ5 at 865 ± 5 °C and L + τ5,CeZn11 ⇔ τ6 at 695 ± 5 °C, respectively. Magnetic susceptibility, specific heat and resistivity measurements of τ5-CeZn(Zn1−xSix)2 revealed Kondo lattice behavior with ferromagnetic ordering below TC = 4.4 K, whereas susceptibility and specific heat studies of τ6-CeZn2(Zn0.28Si0.72)2 revealed Curie–Weiss paramagnetic behaviour down to 3 K. The effective paramagnetic moments of Ce obtained from Curie–Weiss fits of τ5 (2.50μB) and τ6 (2.34μB) reveal a ground state close to trivalent Ce.
1. Introduction
Ternary compounds Ce–T–Si (T is one of the late transition metals) have been known for their interesting physical properties, such as heavy fermion and unconventional superconductivity,1,2 Kondo-behaviour and quantum criticalities,3 intermediate valency,4 thermoelectric features,5etc. Most ternary Ce–T–Si systems have been explored,6 except for group 12 elements (Zn, Cd, Hg). The high vapor pressure of these metals complicates sample preparation, and requires careful control of compositions. Therefore conventional preparation methods such as arc melting or induction melting in open crucibles cannot be used. However, a few investigations were already concerned with the Ce–Zn–Si system. Kido et al.7 reported paramagnetism and metallic behavior of REZnSi compounds (RE = Ce, Nd, Sm, Gd, Tb, Ho) in the temperature range of 77–300 K. Recently, phase equilibria for the Ce–Zn–Si system have been derived at 800 °C by Malik et al.8 and revealed the existence of 4 ternary compounds, labeled as τ1 to τ4. Whilst the crystal structures of τ1 and τ2 and their La-homologues have been elucidated from single crystal X-ray data, the crystal structures of the other compounds remained unresolved. A recent study of RE7Zn21Tt2-phases (Tt is a tetrel element) by Nian-Tzu Suen and Bobev,9 prompted among other rare earth elements (La–Nd) the formation of novel cerium compounds Ce7Zn21{Ge,Sn,Pb}2 crystallizing with the structure type first determined by Malik et al.8 for {La,Ce}7Zn21(Zn1−xSix)2. In their latest publication, they also investigated the single crystals of {Ce–Pr}7Zn21(Zn1−xSix)2 and their magnetic properties.10 Their result, especially on the crystal structure of Ce7Zn21.95Si1.05 confirms the work of Malik et al.8The absence of ternary compounds in the Ce-poor part (<33 at.% Ce) of the isothermal section Ce–Zn–Si seems unusual, particularly ternary compounds with ThCr2Si2 structure or derivative types are encountered in most Ce–T–Si systems (T is a transition metal from Cr to Cu).11 Therefore also the possibility of compound formation at lower temperature needs to be explored. Indeed the investigation of the Zn/Si-rich part of the Ce–Zn–Si phase diagram at 800 °C (ref. 8) revealed hints for a ternary compound (labelled as τ5) with composition close to Ce(Zn1−xSix)3; x ≈ 0.5. Our further attempts to investigate this phase at 700 °C prompted another ternary compound (labelled as τ6) with composition of Ce20Zn53Si27, which is also formed from the melt. An electron count on τ5-CeZn1.5Si1.5, considering the valencies of Ce = +3, Zn = +2 and Si = −4 yields balanced electronic charges suggesting a Zintl behaviour interesting for thermoelectric application.
Therefore this work focuses on the investigation of phase equilibria and crystal structures of τ5 and τ6, as well as their mechanism of formation and stability. Furthermore the magnetic ground state of cerium in these compounds was of interest. Particularly the small amount of tetrel elements (Tt) to stabilize {La,Ce}7Zn21(Zn1−xTtx)2 was investigated by DFT calculations for Tt![[double bond, length as m-dash]](https://www.rsc.org/images/entities/char_e001.gif) Ge to get insight into the electronic DOS, bonding behavior and ground state energies of hypothetical binary Ce7Zn23 in comparison with ternary Ce7Zn23−xGex (x = 0.5, 2).
Ge to get insight into the electronic DOS, bonding behavior and ground state energies of hypothetical binary Ce7Zn23 in comparison with ternary Ce7Zn23−xGex (x = 0.5, 2).
2. Experimental methods and density functional theory calculation
Most samples were prepared by mixing and cold pressing proper blends of ball milled powders of CeSix master alloys with Zn filings inside an Ar filled glove box. Master alloys CeSix were prepared by argon arc melting of Ce and Si pieces on a water-cooled copper hearth with a tungsten electrode, while Zn filings were prepared from purified Zn drops. Samples in the Zn-rich corner were then sealed under vacuum or argon and annealed at 600 °C for 4 to 14 days. Samples with low Si(Ge) content (close to binary Ce–Zn) were prepared in a different way. Ce filings, Zn filings, and Si(Ge) powder were mixed in proper ratio, cold pressed, sealed and then subjected to the same heat treatment. All starting materials had a purity of better than 99.9 mass%.After heat treatment, samples were quenched by submersing the quartz capsules in cold water and analyzed by X-ray powder diffraction with Ge-monochromated CuKα1-radiation employing a Guinier–Huber image plate recording system. X-ray powder diffraction analyses were performed via Rietveld refinement using the FULLPROF program.12 Precise lattice parameters were determined referring to Ge as internal standard (aGe = 0.565791 nm). Special treatments were needed to prepare samples for Electron Probe Microanalysis (EPMA) due to their powder-like consistency. Coarse powders of samples were mixed and cold pressed with fine powders of conductive resin in a small steel die (5–6 mm in diameter) prior to hot compacting them together into a coarse powder/granule of conductive resin. Samples were ground and polished under glycerin in order to avoid oxidation and/or hydrolysis. Microstructures and compositions were examined by light optical microscopy (LOM) and scanning electron microscopy (SEM) and EPMA on a Zeiss Supra 55 VP equipped with an energy dispersive X-ray analysis (EDX) detector operated at 20 kV.
Single crystals of τ5 and τ6 were grown from Zn flux. Powders of a multiphase alloy with nominal composition Ce20Zn50Si30 were mixed and cold pressed with Zn filings in a weight ratio of 1![[thin space (1/6-em)]](https://www.rsc.org/images/entities/char_2009.gif) :45 and 1:57 for τ5 and τ6, respectively. The sample billets were sealed under vacuum in quartz capsules, heated to 800 °C, kept at this temperature for 1 hour, and were then slowly cooled with a rate of 6 °C h−1 to 735 °C and 670 °C for τ5 and τ6, respectively. After quenching in cold water, the Zn flux matrix was dissolved in cold diluted HCl. No reaction of the single crystal material with HCl was observed during leaching.
:45 and 1:57 for τ5 and τ6, respectively. The sample billets were sealed under vacuum in quartz capsules, heated to 800 °C, kept at this temperature for 1 hour, and were then slowly cooled with a rate of 6 °C h−1 to 735 °C and 670 °C for τ5 and τ6, respectively. After quenching in cold water, the Zn flux matrix was dissolved in cold diluted HCl. No reaction of the single crystal material with HCl was observed during leaching.
Single crystals of {La,Ce}7Zn21(Zn1−xGex)2 were prepared from cold pressed mixtures of La/Ce filings, Zn filings and Ge powder with nominal composition of La25Zn73Ge2 and Ce25Zn70Ge5, respectively. The Ce-containing pellet was sealed under vacuum into a quartz ampoule, heated to 600 °C with a rate of 60 °C h−1, kept at this temperature for 12 h, further heated to 1050 °C at 600 °C h−1, and then slowly cooled to 800 °C with a rate of 10 °C h−1. A slightly different heat treatment was performed to grow single crystals of La7Zn21(Zn1−xGex)2 heating the pellet to 600 °C at 60 °C h−1, keeping this temperature for 12 h, followed by further heating to 900 °C at a rate of 600 °C h−1, resting at this temperature for 30 minutes, and then slowly cooling to 800 °C at a rate of 6 °C h−1. Single crystals were then mechanically isolated and selected from the crushed regulus.
Inspections on an AXS D8-GADDS texture goniometer assured high crystal quality, unit cell dimensions and Laue symmetry of the single crystal specimens prior to X-ray intensity data collections at room temperature on a Bruker APEXII diffractometer equipped with a CCD area detector and an Incoatec Microfocus Source IμS (30 W, multilayer mirror, Mo-Kα, λ = 0.071069 nm). Orientation matrices and unit cell parameters were derived using the Bruker APEXII software suite.13 No additional absorption corrections were performed because of the rather regular crystal shapes and small dimensions of the investigated specimens. The structures were solved by direct methods (SHELXS-97) and were refined with the SHELXL-97 (ref. 14) program within the Windows version WINGX.15 Crystal structure data were standardized using program STRUCTURE-TIDY.16
In order to investigate the thermal stability of τ5 and τ6 and to determine the corresponding ternary reaction isotherms, DTA measurements were performed using a Netzsch STA 409 CD/3/403/5/G apparatus. Due to the high vapor pressure of Zn, measurements were performed in closed thin-walled quartz crucibles. Single-phase material of τ5 and τ6 was measured from room temperature to 900 °C with a heating/cooling rate of 5 °C min−1. Isothermal annealing served to confirm the phase fields related to the four-phase reactions observed in DTA: for this purpose two alloys in the Zn rich part with nominal compositions, Ce5.9Zn59.8Si34.3 and Ce7.6Zn78.4Si14, were prepared from powders of CeSix and Zn filings and annealed at 500 °C for 4 days. After first reaction, the alloys were powderized to a grain size below 53 μm inside the glove box and were then cold compacted in a steel die (diameter = 10 mm). The pellets were dry-cut into several pieces and sealed in quartz tubes under about 300 mbar Ar and annealed at 400 °C, 650 °C, 710 °C, 750 °C, 770 °C, 790 °C, 810 °C, 850 °C, 860 °C, 870 °C, 880 °C and 900 °C for 1 day each. Single phase samples of τ5 and τ6 were prepared in a similar way. The second annealing temperature was 700 and 600 °C for τ5 and τ6, respectively. The furnaces were calibrated with standard thermocouples and Sb (melting point = 631 °C).
Dc magnetic susceptibility measurements were performed with a SQUID magnetometer for τ5 and τ6 from 2–300 K with various magnetic fields from 0.006 to 6 T on freely rotating single crystals with a total mass of 0.80 mg (individual crystals with a typical mass of 100 μg) and on sintered polycrystalline samples of about 20 mg. Ac susceptibility measurements were carried out on sintered polycrystalline samples of about 200 mg with a Lakeshore 7000 ac susceptometer applying an ac-field with amplitude of 325 A m−1 and a frequency of 100 Hz. Specific heat measurements were performed on a commercial Quantum Design PPMS calorimeter on a sintered τ6 sample and on τ5 single crystals. Parts of a sintered sample of τ5 were also used for resistivity and Seebeck coefficient measurements. Resistivity measurements were performed from 2–300 K in a home-made equipment using the ac bridge resistance technique, while the high temperature part (300–673 K) was measured simultaneously with the Seebeck coefficient in a ZEM-3 ULVAC.
The density functional theory (DFT) calculations were performed by using the Vienna ab initio simulation package (VASP)17,18 and applying the pseudopotential construction according to the projector-augmented-wave method.19 For the exchange-correlation functional the generalized gradient approximation according to Perdew et al. (PBE)20 was chosen. The VASP calculations were done with high precision using the predefined/default values as provided by the VASP package. The energy cutoff was chosen at 350 eV. Spin polarized calculations were done assuming ferro/ferrimagnetic ordering. For the k space integration the Gaussian smearing method with a value for σ of 0.1 eV was taken. k space grids were constructed by the method outlined in ref. 21, namely 11 × 11 × 11 for CeZn; 7 × 5 × 5 for Ce4Zn8 (CeZn2); 7 × 3 × 5 for Ce4Zn12 (CeZn3); 3 × 3 × 7 for Ce14Zn46 (Ce7Zn23) and related compounds; 7 × 3 × 2 for Ce6Zn22 (Ce3Zn11). No additional many-body treatment was made for the localized character of the f-like states of Ce, since the compounds under study are all in a metallic state with f-occupation of ∼1 per Ce atom. PBE is considered to reasonably capture the localization properties in terms of spin-polarization as it does for 3d transition metals. Assuming the experimental structure as starting point for all cases, the atomic positions as well as the unit cell parameters were fully relaxed. The Ge substitution was made according to Table 3 at the experimentally defined M1 sites.
3. Results and discussions
3.1. Binary boundary systems
The Zn–Si system (calculated) and the Ce–Zn system were accepted after Massalski22 taking also into account a more recent investigation on the low temperature modification of αCe2Zn17 (αCe1−xZn5+2x) with TbCu7-type.23 For the Ce–Si system we rely on the version of Malik et al.,8 which essentially is based on the investigation by Bulanova et al.24 but also includes further phases such as Ce2Si3−x (ref. 25) and the high pressure phases CeSi5 and Ce2Si7.26 The La–Zn system was taken from the latest experimental investigation by Berche et al.27 with recent data on the crystal structure of LaZn4.28 Detailed crystallographic data for unary and binary boundary phases are summarized in Table S1 (ESI†), those for ternary compounds are listed in Table 1, respectively.| Phase temperature range (°C) | Space group, prototype | Lattice parameters (nm) | Comments | ||
|---|---|---|---|---|---|
| a | b | c | |||
| τ1-Ce7Zn21(Zn1−xSix)2 | Pbam, Ce7Zn21(Zn1−xSix)2 | 1.55722(3) | 1.71942(3) | 0.44772(1) | x = 0.28 SC (ref. 8) |
| 0.28 ≤ x ≤ 0.98 at 800 °C (ref. 8) | |||||
| 0.45 ≤ x ≤ 0.99 at 600 °C [this work] | |||||
| τ2-Ce(Si1−xZnx)2 | P6/mmm, AlB2 | 0.4223 | — | 0.4238 | x = 0.50 (ref. 7) |
| 0.41827(2) | — | 0.42747(2) | SC at x = 0.44 (ref. 8) | ||
| 0.36 ≤ x ≤ 0.76 at 800 °C (ref. 8) | |||||
| 0.4421(2) | — | 0.38960(3) | x = 0.75 (ref. 8) | ||
| 0.36 ≤ x ≤ 0.73 at 600 °C [this work] | |||||
| 0.42206(5) | — | 0.42334(6) | x = 0.47 [this work] | ||
| τ3-Ce(ZnxSi1−x) | Unknown | — | — | — | 0.17 ≤ x ≤ 0.23 at 800 °C (ref. 8) |
| τ4-Ce40Zn37Si23 | Unknown | — | — | — | At.% (ref. 8) |
| τ5-CeZn(Zn1−xSix)2 < 865 ± 5 [this work] | Cmcm | 0.42079(1) | 1.76522(3) | 0.41619(1) | x = 0.71 SC [this work] |
| CeNiSi2 | 0.68 ≤ x ≤ 0.76 at 600 °C [this work] | ||||
| τ6-CeZn2(Si1−xZnx)2 < 695 ± 5 [this work] | I4/mmm | 0.41757(1) | — | 1.05073(2) | x = 0.30 SC [this work] |
| ThCr2Si2 | 0.25 ≤ x ≤ 0.30 at 600 °C [this work] | ||||
| τ7-Ce37Zn48Si15 < 800 | Unknown | — | — | — | This work |
3.2. Crystal structure of ternary compounds in the Ce–Zn–Si system
| Parameter/compound | τ5-CeZn(Zn1−xSix)2, x = 0.71 | τ6-CeZn2(Si1−xZnx)2, x = 0.30 |
|---|---|---|
| Phase composition (EPMA, at.%) | Ce24.9Zn39.6Si35.5 | Ce20.1Zn51.8Si28.1 |
| Refinement composition (at.%) | Ce25.0Zn39.7Si35.3 | Ce20.0Zn52.0Si28.0 |
| Structure type | CeNiSi2 | ThCr2Si2 |
| 2θ range (deg) | 4.62 ≤ 2θ ≤ 80.32 | 7.76 ≤ 2θ ≤ 72.72 |
| a [nm] | 0.42079(1) | 0.41757(1) |
| b [nm] | 1.76522(3) | 0.41757(1) |
| c [nm] | 0.41619(1) | 1.05073(2) |
| Reflections in refinement | 537 ≥ 4σ(Fo) of 556 | 157 ≥ 4σ(Fo) of 157 |
| Mosaicity | 0.55 | 0.48 |
| Number of variables | 20 | 11 |
| R F2 = ∑|Fo2 − Fc2|/∑Fo2 | 0.0203 | 0.0077 |
| wR2 | 0.0402 | 0.0197 |
| R Int | 0.0432 | 0.0311 |
| GOF | 1.349 | 1.370 |
| Extinction (Zachariasen) | 0.0059(3) | 0.034(1) |
| Ce; occ. | 4c (0,y,1/4), y = 0.39888(1); 1.00(−) | 2a (0,0,0); 1.00(−) |
| U11; U22; U33; U23; U13; U12 | 0.0052(1); 0.0073(1); 0.0038(1); 0; 0; 0 | 0.00567(9); 0.00567(9); 0.0096(1); 0; 0; 0 |
| M1; occ. | 4c (0,y,1/4), y = 0.03338(5); 0.26(1) Zn1 + 0.74 Si1 | 4d (0,1/2,1/4); 1.00(−) Zn1 |
| U11; U22; U33; U23; U13; U12 | 0.0137(4); 0.0062(4); 0.0050(4); 0; 0; 0 | 0.0101(1); 0.0101(1); 0.0090(1); 0; 0; 0 |
| M2; occ. | 4c (0,y,1/4), y = 0.16921(5); 0.31(1) Zn2 + 0.69 Si2 | 4e (0,0,z); z = 0.38507(5); 0.30(1) Zn2 + 0.70(1) Si1 |
| U11; U22; U33; U23; U13; U12 | 0.0087(4); 0.0080(4); 0.0064(4); 0; 0; 0 | 0.0087(2); 0.0087(2); 0.0090(2); 0; 0; 0 |
| Zn3; occ. | 4c (0,y,1/4), y = 0.74962(3); 1.00 Zn3 | |
| U11; U22; U33; U23; U13; U12 | 0.0099(2); 0.0082(2); 0.0080(2); 0; 0; 0 | |
| Residual electron density; max; min in (electron per nm3) × 103 | 2.61; −3.04 | 0.32; −0.81 |
Further refinement with anisotropic ADPs for all atoms converged to RF = 0.020 and residual electron densities smaller than ±3.04 e− Å−3. The final formula obtained, CeZn(Zn1−xSix)2 with x = 0.71 corresponds to the composition Ce25.0Zn39.7Si35.3 (in at.%), which perfectly fits to the value derived from EPMA (Ce24.9Zn39.6Si35.5). Details on crystal data along with ADPs are summarized in Table 2. A Rietveld X-ray powder diffraction refinement confirms the structure model for τ5. Furthermore, lattice parameters, crystal symmetry, and Wyckoff positions proved that this compound is isotypic with the structure type of CeNiSi2 (see Fig. 1).
 | ||
| Fig. 1 Crystal structure of τ5-CeZn(Zn1−xSix)2, x = 0.71 showing atoms with anisotropic displacement parameters from X-ray single crystal refinement. | ||
Interatomic distances are given in Table S2 (ESI†). Comparing atom distances with the sum of atomic radii, direct bonding is neither revealed between M1–Zn3 nor for M2–M2. However, stronger bonding is inferred from the distances among M1–M1, M1–M2 and M2–Zn3 atoms, particularly taking into account the Zn/Si random occupancy. At 600 °C the phase τ5-CeZn(Zn1−xSix)2 exhibits a compositional range, 0.68 ≤ x ≤ 0.76, excluding any stoichiometric composition (for details see Section 3.4).
Compounds with the CeNiSi2 type are known in many Ce–T–Si systems (T = Fe to Cu, Rh, Ir, Pt, and Sn) and exist in both stoichiometric and non-stoichiometric forms.11 For τ5-CeZn(Zn1−xSix)2, however, only the non-stoichiometric composition could be found, whereas the Ce–Cu–Si system,29 which is the closest homologous system, contains two individual phases of same symmetry (isotypic with CeNiSi2), namely CeCu1.6Si1.4 (![[triple bond, length as m-dash]](https://www.rsc.org/images/entities/char_e002.gif) CeCu(Cu0.6Si0.4)Si) and stoichiometric CeCuSi2, both separated by a two-phase equilibrium: Ce(Cu1−xSi1+x)2 (AlB2-type) + CeCu2Si2. It should be noted that the atom preference in the mixed sites in τ5-CeZn(Zn0.26Si0.74)(Zn0.31Si0.69) – where Zn/Si randomly fill two 4c-sites with y = 0.03338(5) and y = 0.16921(5) – differs from non-stoichiometric CeCu(Cu0.6Si0.4)Si where Cu and Si atoms only share the 4c-site with y = 0.038. However, we have to note here that the reliability of the X-ray single crystal study on photographs for CeCu1.6Si1.4 is low, as RF was only 17.7%.30 The discussion on TbFe0.5Si2 being a site exchange variant of the CeNiSi2-type has been solved from neutron diffraction data on HoFe0.5Si2,31 which clearly revealed isotypism with the CeNiSi2-type. From the good correspondence of the composition refined from X-ray data with the composition derived from EDX, we can safely conclude that the structure of τ5-CeZn(Zn1−xSix)2 does not contain any defect sites like HoFe0.5Si2.
CeCu(Cu0.6Si0.4)Si) and stoichiometric CeCuSi2, both separated by a two-phase equilibrium: Ce(Cu1−xSi1+x)2 (AlB2-type) + CeCu2Si2. It should be noted that the atom preference in the mixed sites in τ5-CeZn(Zn0.26Si0.74)(Zn0.31Si0.69) – where Zn/Si randomly fill two 4c-sites with y = 0.03338(5) and y = 0.16921(5) – differs from non-stoichiometric CeCu(Cu0.6Si0.4)Si where Cu and Si atoms only share the 4c-site with y = 0.038. However, we have to note here that the reliability of the X-ray single crystal study on photographs for CeCu1.6Si1.4 is low, as RF was only 17.7%.30 The discussion on TbFe0.5Si2 being a site exchange variant of the CeNiSi2-type has been solved from neutron diffraction data on HoFe0.5Si2,31 which clearly revealed isotypism with the CeNiSi2-type. From the good correspondence of the composition refined from X-ray data with the composition derived from EDX, we can safely conclude that the structure of τ5-CeZn(Zn1−xSix)2 does not contain any defect sites like HoFe0.5Si2.
![[4 with combining macron]](https://www.rsc.org/images/entities/char_0034_0304.gif) , I4/m, I422, I4mm, I2m, Im2 and I4/mmm, as possible space group types. Structure solution and refinement employing direct methods in the highest symmetry space group type I4/mmm converged to RF = 0.008 with residual electron densities smaller than ±0.81 e− Å−3. Details on crystal data along with ADPs are summarized in Table 2. Unit cell parameters, crystal symmetry, and Wyckoff sites confirm isotypism with the ThCr2Si2 structure type (see Fig. 2).
, I4/m, I422, I4mm, I2m, Im2 and I4/mmm, as possible space group types. Structure solution and refinement employing direct methods in the highest symmetry space group type I4/mmm converged to RF = 0.008 with residual electron densities smaller than ±0.81 e− Å−3. Details on crystal data along with ADPs are summarized in Table 2. Unit cell parameters, crystal symmetry, and Wyckoff sites confirm isotypism with the ThCr2Si2 structure type (see Fig. 2).
 | ||
| Fig. 2 Crystal structure of τ6-CeZn2(Si1−xZnx)2, x = 0.30 showing atoms with anisotropic displacement parameters from X-ray single crystal refinement. | ||
The final structure formula, CeZn2(Si1−xZnx)2 with x = 0.30, reveals one Zn/Si mixed atom site (M = 0.30 Zn2 + 0.70 Si in 4e; 0,0,z), which in many cases provides close contacts among the tetrel elements (dumbbell formation).32 The formula (Ce20.1Zn51.8Si28.1, in at.%) perfectly fits to the value derived from EDX: Ce20.0Zn52.0Si28.0.
Interatomic distances are given in Table S2 (ESI†). As the M-site is mainly occupied by Si, distances M–M and M–Zn1 are much smaller than distances Zn1–Zn1. Taking into account the random occupancy Zn/Si in the 4e site, the M–M distance is smaller than the sum of radii33 and is a good indication for dumbbell formation. Comparing the M–M and M–Zn1 distances with those in YbZn2(Si1−xZnx)2; x = 0.25,34 which is hitherto the only far off-stoichiometric REZn2Si2 crystallizing in the ThCr2Si2 type, no significant difference can be found. Consistent with the mixed atom site, τ6-CeZn2(Si1−xZnx)2 exists at 600 °C in a small homogeneity range 0.25 ≤ x ≤ 0.30 (for details see Section 3.4). Similar to τ5 also the phase τ6 does not include the stoichiometric composition CeZn2Si2, although first row transition metals mostly form ordered, stoichiometric compounds CeT2Si2 (T = Cr to Cu), some with only a small deviation from 1:2:2 stoichiometry.
 | ||
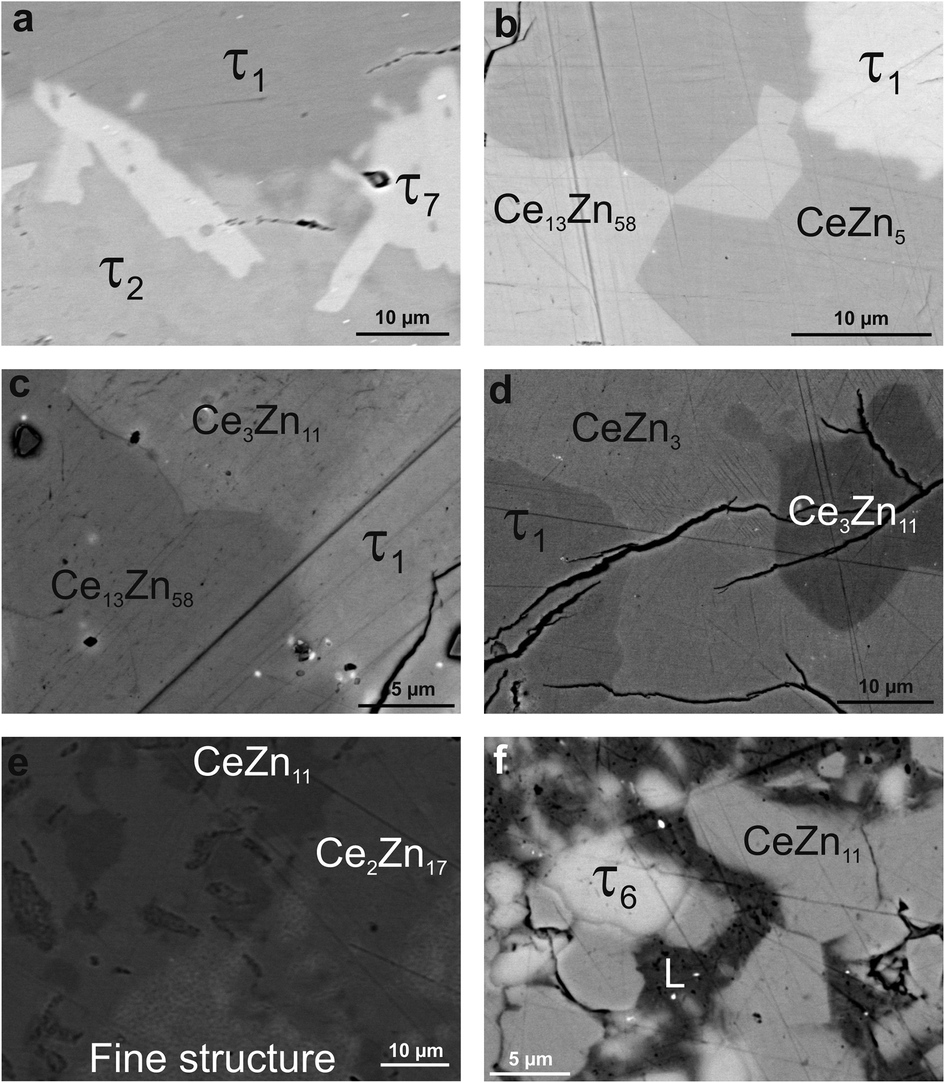
| Fig. 3 Micrographs of samples revealing the phase {La,Ce}7Zn21(Zn1−xGex)2 in contact with binary phases from the systems {La,Ce}–Zn. | ||
Indexing of the X-ray diffraction data from a suitable single crystal of Ce7Zn21(Zn1−xGex)2 was complete for an orthorhombic unit cell corresponding to the structure type of Ce7Zn21(Zn1−xSix)2. The structure solution, employing direct methods in space group Pbam with the highest symmetry, compatible with the set of systematic extinctions, resulted in the same atom arrangement as for Ce7Zn21(Zn1−xSix)2. Despite the small difference in the X-ray scattering power of Zn and Ge atoms, one mixed Zn/Ge site could unambiguously be identified from the rest of the fully occupied Zn sites. It is the same site as in the parent Ce7Zn21(Zn1−xSix)2 type revealing a slightly smaller ADP and thus requests the presence of an atom with a slightly higher scattering power.
Even though it was possible to refine the occupancy of Zn/Ge (yielding 0.45(5) Zn1 + 0.55(5) Ge1), the ratio Zn/Ge was fixed in accord with the composition obtained from EPMA (0.25 Zn1 + 0.75 Ge1). A final refinement with anisotropic ADPs converged to RF = 0.0215 with a residual electron density less than 1.7 e− Å−3. Detailed crystal data and atomic displacement parameters are summarized in Table 3. The structure refinement essentially confirmed the data obtained by Suen et al.9 but here for an even lower Ge-content.
| Parameter/compound | Ce7Zn21(Zn1−xGex)2, x = 0.75 | La7Zn21(Zn1−xGex)2, x = 0.10 |
|---|---|---|
| a The earlier data sets for single crystal Ce7Zn21(Zn1−xSix)2, x = 0.28 (ref. 8) and for isotypic La7Zn21(Zn1−xSix)2, x = 0.27,8 as well as the sets for {La–Nd}7Zn21+x(Tt)2−x (ref. 9 and 10) were not standardized correctly. b The occupancy value is fixed after EPMA. | ||
| Phase composition (EPMA, at.%) | Ce23.2Zn71.9Ge5.0 | La23.5Zn75.9Ge0.6 |
| Refinement composition (at.%) | Ce23.3Zn71.7Ge5.0 | La23.3Zn76.0Ge0.7 |
| Structure type | Ce7Zn21(Zn1−xSix)2 | Ce7Zn21(Zn1−xSix)2 |
| 2θ range (°) | 4.75 ≤ 2θ ≤ 72.58 | 5.19 ≤ 2θ ≤ 72.64 |
| a [nm] | 1.55215(2) | 1.57043(2) |
| b [nm] | 1.71447(2) | 1.73321(3) |
| c [nm] | 0.44836(1) | 0.45076(1) |
| Reflections in refinement | 2706 ≥ 4σ(Fo) of 3103 | 2732 ≥ 4σ(Fo) of 3196 |
| Mosaicity | 0.45 | 0.50 |
| Number of variables | 94 | 94 |
| R F2 = ∑|Fo2 − Fc2|/∑Fo2 | 0.0215 | 0.0330 |
| wR2 | 0.0532 | 0.0609 |
| R Int | 0.0147 | 0.0147 |
| GOF | 0.774 | 1.325 |
| Extinction (Zachariasen) | 0.00094(4) | 0.00028(3) |
| RE1 in 4h (x,y,1/2); occ. | x = 0.16459(2); y = 0.04538(1); 1.00(−) | x = 0.16342(2); y = 0.04474(2); 1.00(−) |
| U11; U22; U33; U23 = U13 = 0; U12 | 0.0093(1); 0.0094(1); 0.0076(1); −0.0004(1) | 0.0099(1); 0.0084(2); 0.0067(1); −0.0003(1) |
| RE2 in 4g (x,y,0); occ. | x = 0.16580(2); y = 0.31940(1); 1.00(−) | x = 0.16739(2); y = 0.31848(2); 1.00(−) |
| U11; U22; U33; U23 = U13 = 0; U12 | 0.0086(1); 0.0087(1); 0.0076(1); −0.00002(7) | 0.0096(1); 0.0091(2); 0.0072(1); −0.0005(1) |
| RE3 in 4g (x,y,0); occ. | x = 0.41826(2); y = 0.24008(3); 1.00(−) | x = 0.41760(2); y = 0.24148(3); 1.00(−) |
| U11; U22; U33; U23 = U13 = 0; U12 | 0.0093(1); 0.0195(1); 0.0118(1); −0.0019(1) | 0.0104(2); 0.0269(2); 0.0125(2); 0.0037(1) |
| RE4 in 2c (0,1/2,0); occ. | 1.00(−) | 1.00(−) |
| U11; U22; U33; U23 = U13 = 0; U12 | 0.0103(1); 0.0143(2); 0.0115(2); −0.0030(1) | 0.0137(2); 0.0166(3); 0.01304(2); 0.0056(2) |
| M1 in 4h (x,y,1/2); | x = 0.02039(3); y = 0.35860(3); 0.25 Zn1 + 0.75 Ge1b | x = 0.02098(5); y = 0.35861(4); 0.90 Zn1 + 0.10 Ge1b |
| occ.b | ||
| U11; U22; U33; U23 = U13 = 0; U12 | 0.0091(2); 0.0104(2); 0.0131(2); 0.0001(2) | 0.0108(3); 0.0107(4); 0.0165(3); 0.0001(3) |
| Zn2 in 4h (x,y,1/2); occ. | x = 0.07520(4); y = 0.21623(3); 1.00(−) | x = 0.07441(5); y = 0.21634(4); 1.00(−) |
| U11; U22; U33; U23 = U13 = 0; U12 | 0.0143(2); 0.0097(2); 0.0110(2); −0.0008(2) | 0.01500(3); 0.0093(3); 0.0102(3); −0.0005(3) |
| Zn3 in 4h (x,y,1/2); occ. | x = 0.15224(4); y = 0.44824(3); 1.00(−) | x = 0.15203(5); y = 0.44898(5); 1.00(−) |
| U11; U22; U33; U23 = U13 = 0; U12 | 0.0128(2); 0.0102(2); 0.0102(2); −0.0019(2) | 0.01432(3); 0.01062(4); 0.0096(3); −0.0023(3) |
| Zn4 in 4h (x,y,1/2); occ. | x = 0.25707(4); y = 0.21844(3); 1.00(−) | x = 0.25851(5); y = 0.21716(4); 1.00(−) |
| U11; U22; U33; U23 = U13 = 0; U12 | 0.0134(2); 0.0096(2); 0.0105(2); 0.0005(2) | 0.0166(3); 0.0085(3); 0.0093(3); 0.0001(3) |
| Zn5 in 4h (x,y,1/2); occ. | x = 0.30414(4); y = 0.35837(3); 1.00(−) | x = 0.30569(5); y = 0.35746(4); 1.00(−) |
| U11; U22; U33; U23 = U13 = 0; U12 | 0.0128(2); 0.0120(2); 0.0115(2); −0.0032(2) | 0.0132(3); 0.0114(4); 0.0107(3); −0.0037(3) |
| Zn6 in 4h (x,y,1/2); occ. | x = 0.36349(4); y = 0.09927(3); 1.00(−) | x = 0.36446(5); y = 0.09913(5); 1.00(−) |
| U11; U22; U33; U23 = U13 = 0; U12 | 0.0105(2); 0.0111(2); 0.0200(3); −0.0005(2) | 0.0114(3); 0.0124(4); 0.0223(4); −0.0011(3) |
| Zn7 in 4h (x,y,1/2); occ. | x = 0.46584(4); y = 0.40147(4); 1.00(−) | x = 0.46662(5); y = 0.40073(5); 1.00(−) |
| U11; U22; U33; U23 = U13 = 0; U12 | 0.0103(2); 0.0179(3); 0.0172(3); 0.0029(2) | 0.0106(3); 0.0176(4); 0.0178(4); 0.0030(3) |
| Zn8 in 4g (x,y,0); occ. | x = 0.07303(4); y = 0.14088(3); 1.00(−) | x = 0.07359(6); y = 0.14124(5); 1.00(−) |
| U11; U22; U33; U23 = U13 = 0; U12 | 0.0217(3); 0.0141(2); 0.0104(2); 0.0043(2) | 0.0260(4); 0.0144(4); 0.0096(3); 0.0046(3) |
| Zn9 in 4g (x,y,0); occ. | x = 0.24865(4); y = 0.14674(3); 1.00(−) | x = 0.24920(6); y = 0.14602(5); 1.00(−) |
| U11; U22; U33; U23 = U13 = 0; U12 | 0.0226 (3); 0.0119(2); 0.0109(2); −0.0050(2) | 0.0295(4); 0.0123(4); 0.0099(3); −0.0079(3) |
| Zn10 in 4g (x,y,0); occ. | x = 0.29957(4); y = 0.00600(4); 1.00(−) | x = 0.29942(5); y = 0.00570(5); 1.00(−) |
| U11; U22; U33; U23 = U13 = 0; U12 | 0.0144(3); 0.0197(3); 0.0106(2); 0.0067(2) | 0.0166(4); 0.0240(4); 0.0100(3); 0.0099(3) |
| Zn11 in 4g (x,y,0); occ. | x = 0.35248(4); y = 0.41919(3); 1.00(−) | x = 0.35252(6); y = 0.41889(5); 1.00(−) |
| U11; U22; U33; U23 = U13 = 0; U12 | 0.0223(3); 0.0135(2); 0.0100(2); −0.0021(2) | 0.0250(4); 0.0134(4); 0.0093(3); −0.0031(3) |
| Zn12 in 2a (0,0,0); occ. | 1.00(−) | 1.00(−) |
| U11; U22; U33; U23 = U13 = 0; U12 | 0.0147(4); 0.0175(4); 0.0178(4); −0.0010(3) | 0.0139(5); 0.0205(6); 0.0172(5); −0.0020(4) |
| Residual electron density; max; min in (electron per nm3) × 103 | 1.59; −1.70 | 1.71; −2.13 |
Although EPM analyses in the La–Zn–Ge system prompted a phase with composition of La23.3Zn71.6Ge5.1 (see Fig. 3b), attempts to grow a single crystal with this Ge content were unsuccessful. However, for lower Ge-contents a suitable single crystal could be obtained (see Fig. 3a). Following the same steps and arguments as for Ce7Zn21(Zn1−xGex)2, structure solution and refinement of the single crystal data clearly showed isotypism with Ce7Zn21(Zn1−xSix)2. However, due to the low amount of Ge atoms in the unit cell, it was not possible to identify the Zn/Ge mixed site from the rest of the Zn sites. Therefore Ge atoms were placed at the corresponding Si-site as in Ce7Zn21(Zn1−xSix)2 with the occupancy taken from EPMA (La23.3Zn76.0Ge0.7 in at.%).
Detailed crystal data and atomic displacement parameters are listed in Table 3. As expected from the isotypism with Ce7Zn21(Zn1−xSix)2, the atomic arrangement in {La,Ce}7Zn21(Zn1−xGex)2 also gives a similar zig-zag chain of distorted AuCu3 and BaAl4 blocks along the b-axis (see Fig. 4). This arrangement is similar to Ce3Zn11 with La3Al11-type, which is the neighbouring phase of Ce7Zn21(Zn1−xGex)2. Due to the comparable size of Zn and Ge atoms, no significant difference could be found in the interatomic distances between fully occupied Zn and mixed Zn/Ge sites.
 | ||
| Fig. 4 Crystal structure of Ce7Zn21(Zn1−xGex)2, x = 0.75 projected along the c-axis and the coordination polyhedra for the Ce atoms. Atoms are drawn with anisotropic displacement parameters from X-ray single crystal refinement. Please note that (with respect to the previously incorrect standardization of Ce7Zn21(Zn1−xSix)2) the origin of the unit cell is now shifted by (1/2 0 0). | ||
The amount of Ge necessary to stabilize the ternary compounds {La,Ce}7Zn21(Zn1−xGex)2 is even less than for isotypic {La,Ce}7Zn21(Zn1−xSix)2 and with less than 1 atom percent of Ge infers a rather small degree of thermodynamic instability for the hypothetical binary phases “La7Zn23” and “Ce7Zn23”.
3.3. Phase stability of Ce7Zn23−xGex
| ΔHDFT(CexZn1−x) = EtotDFT(CexZn1−x) − (xErefDFT(Ce) + (1 − x)ErefDFT(Zn) | (1) |
As reference energies of the pure phases we defined:
| ErefDFT(Ce) = EtotDFT(Ce) − Eadj(Ce),and ErefDFT(Zn) = EtotDFT(Zn) − Eadj(Zn) | (2) |
The DFT energies for the pure phases were calculated for solid nonmagnetic α-fcc-Ce and solid hcp-Zn. It was necessary to adjust the reference energies by Eadj(Ce) and Eadj(Zn) for a direct comparison with the results of the thermodynamic modeling of Wang et al.,36 and experimental work by Chiotti et al.37 and Johnson et al.,38 because of the choice of different reference ground states. Then the values for Eadj were extracted by linearly fitting the DFT results (column DFT in Table 4) to the thermodynamic modeling data (column “model”) for the four given compounds, and by that Eadj(Ce) = 27.87 and Eadj(Zn) = 4.38 kJ mol−1 were obtained.
| Compound | x Ce | DFT | DFT-adj | Model | m loc | V 0 |
|---|---|---|---|---|---|---|
| CeZn | 0.50 | −17.81 | −33.94 | −34.04 | 0 | 23.72 |
| CeZn2 | 0.333 | −28.16 | −40.37 | −40.06 | 0.71 | 21.22 |
| CeZn3 | 0.25 | −28.00 | −38.25 | −38.47 | 0.25 | 19.23 |
| Ce14Zn46 | 0.233 | −26.76 | −36.62 | — | 0.29 | 19.29 |
| Ce14Zn42Ge4 | 0.233 | −34.16 | −43.73 | — | 0.19 | 19.16 |
| Ce14Zn45Ge | 0.233 | −28.47 | −38.33 | — | 0.08 | 19.16 |
| Tie-line | 0.233 | −27.75 | −37.61 | — | ||
| Ce3Zn11 | 0.214 | −27.47 | −36.89 | −36.88 | 0.65 | 18.66 |
Table 4 summarizes results of the DFT calculations. The DFT derived adjusted enthalpy of formation compares very well with data of the thermodynamic modelling by Wang et al.36 Concerning magnetic properties, as taken from the listed magnetic moments, CeZn does not spin polarize, whereas for the other listed compounds CexZn1−x the magnetic moment per Ce atom decreases with decreasing Ce content, starting with CeZn2 which has the largest local moment per Ce atom of 0.71μB. For (hypothetical) Ce14Zn46 (x = 0.23) the local moment is still sizeable amounting to 4.06μB for the total magnetic moment of the unit cell. Replacing Zn by Ge in Ce14Zn46−xGex strongly reduces the magnetic moment to less than 0.07μB for x = 1. The gain in spin-polarization energy is very small being about 0.01 kJ mol−1 per Ce atom, which hints at a spin fluctuation system. If x = 4 than there is no spin polarization anymore.
The enthalpy of formation for Cex(Ge,Zn)1−x compounds was derived similarly to the procedure described above. As a reference, solid Ge was taken in its ground state in the diamond structure. Most noticeable for our study is the stability for the Ge-doped compounds. Even for one Ge atom per formula unit, Ce14Zn45Ge1, ΔHDFT is below the tie-line connecting neighboring Zn-compounds. Here we assume, that in fact the ternary system can be approximately described as a binary one (see Fig. 5). Why Ge stabilizes the compound is analyzed in the following discussing the electronic structure in terms of the density of states (DOS).
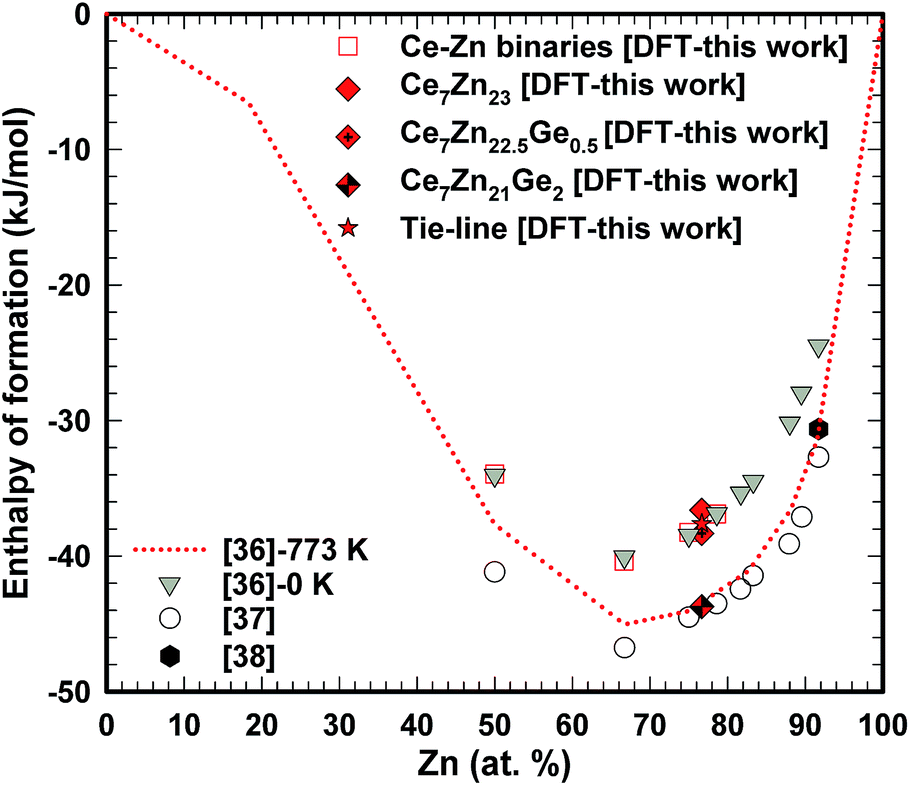 | ||
| Fig. 5 Comparison between experimental and DFT derived adjusted calculated enthalpies of formation for Ce–Zn binaries and Ce7Zn23−xGex. | ||
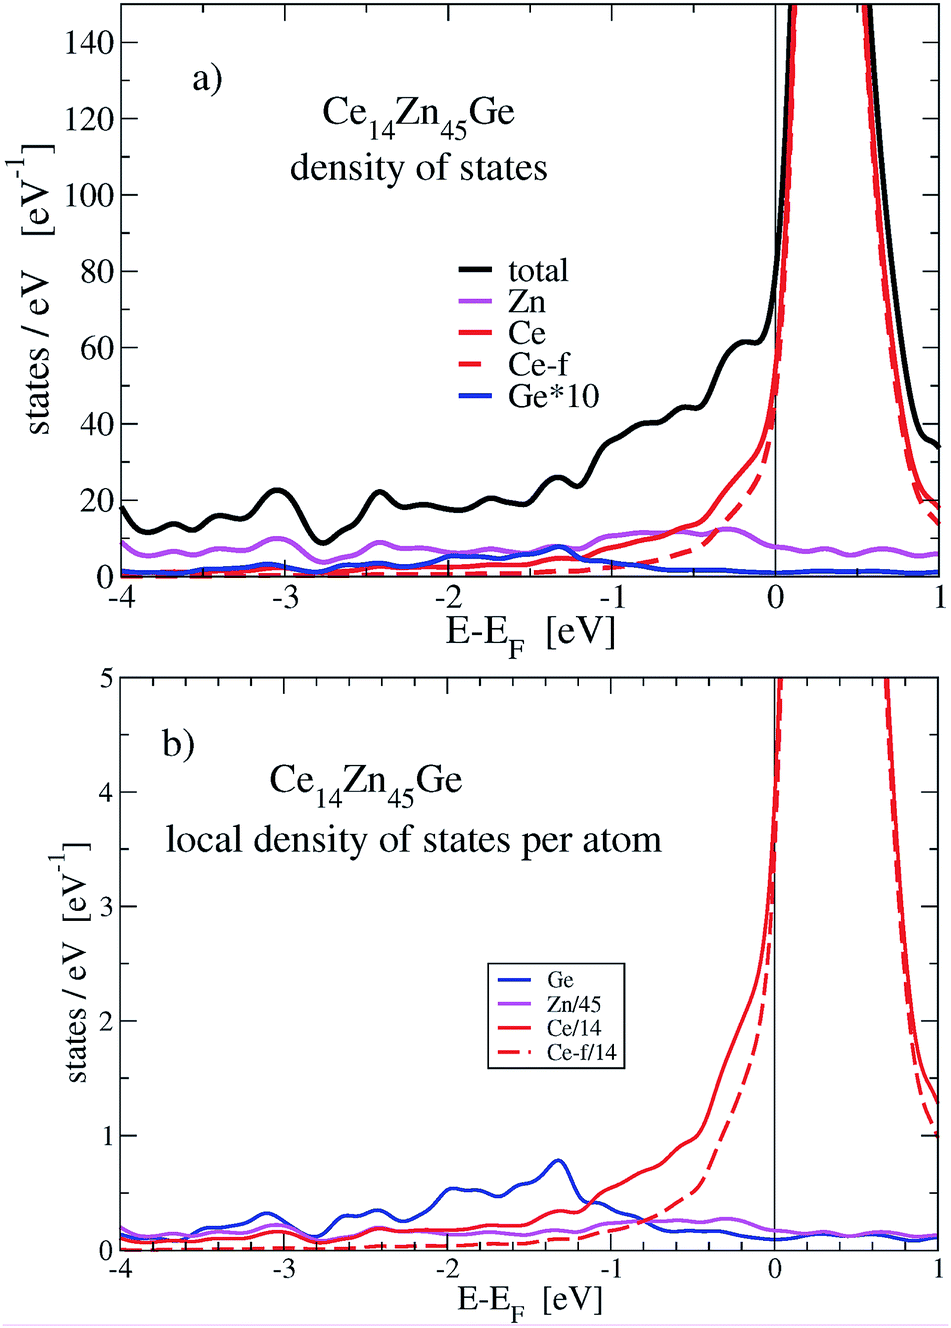 | ||
| Fig. 6 Panel (a): total and local density of states (DOS) for non spin-polarized Ce7Ge0.5Zn22.5. Panel (b): local DOS per atom. For better visibility, the local DOS for Ge is multiplied by a factor of 10. | ||
The stabilization property of Ge-substitution can be understood by inspecting Fig. 7 showing a reduction of the total DOS at Fermi energy when one Zn is replaced by Ge. This is mainly due to the reduction of the f-like DOS for Ce14Zn45Ge1. The corresponding γ values of the electronic specific heat are 3.43 (DOS at EF = 87.3 states per eV for Ce14Zn46) and 3.25 mJ mol−1 K−2 (DOS at EF = 82.7 states per eV for Ce14Zn45Ge1) indicating poor metals. Analyzing the Ce-f states it turns out that the magnetic moments break down upon Ge substitution, which is responsible for the DOS reduction. The reduction is due to the destruction of the magnetic moment of Ce atoms in the 2c position, because these states are predominant at the Fermi energy for spin polarized Ce14Zn46. They carry the largest magnetic moment of all Ce atoms and are therefore the most localized f-states with the largest uprise of all f-DOSes and therefore the largest value at Fermi energy. For Ce14Zn46 the local f-moments are 0.27, 0.21, and 0μB for the 4-fold coordinated atoms, and 0.74μB for the Ce atoms in the 2c position. The breakdown of the magnetic moment upon substitution indicates also a weaker localization and consequently the DOS at Fermi energy is lowered: this leads to the reduction of the total DOS and indicates the thermodynamic stabilization of Ce14Zn45Ge1. Summarizing, the more pronounced covalent bonding between Ce and Ge seems to be the main factor for the stabilization. By substituting 4 Ge atoms the stabilization with respect to the tie-line is considerably enhanced.
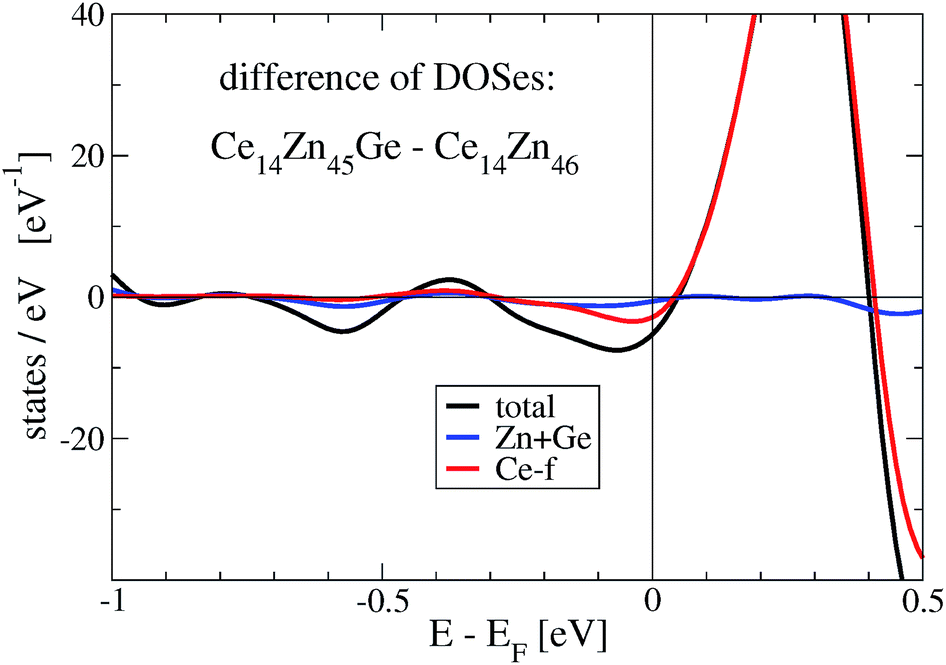 | ||
| Fig. 7 Differences of total and local density of states, Ce7Ge0.5Zn22.5 minus Ce7Zn23. | ||
3.4. Partial isothermal section at 600 °C for less than 33.3 at.% Ce
The partial isothermal section at 600 °C in the Ce-poor part of the ternary system Ce–Zn–Si was established from EPMA and X-ray powder diffraction of about 45 alloys (see Fig. 8). Considering the high stability of the phase Ce(Si1−xZnx)2 with the αThSi2 type and the relatively slow reaction kinetic at 600 °C (diffusion in cast alloys) the samples were prepared by powder metallurgical techniques i.e. via isothermal reaction synthesis starting from compacts of powder/filings in order to ensure establishment of true phase relations at this temperature.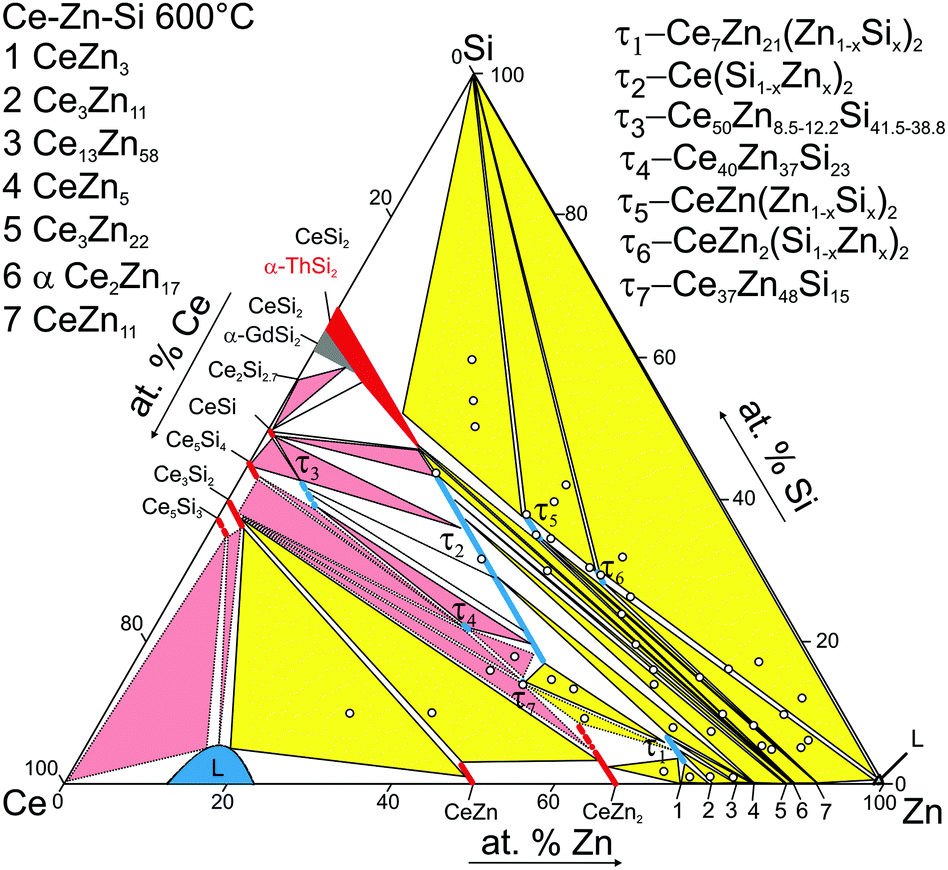 | ||
| Fig. 8 Partial isothermal section at 600 °C (<33.3 at% Ce). The circles represent nominal compositions of alloys. The pink three phase fields are taken from ref. 8. | ||
In addition to the ternary compounds τ1-Ce7Zn21(Zn1−xSix)2, 0.45 ≤ x ≤ 0.99 and τ2-Ce(Si1−xZnx)2, 0.36 ≤ x ≤ 0.73, both established previously in the 800 °C isothermal section (for details see ref. 8), three new phases, which previously were not encountered at 800 °C,8 were found to exist at 600 °C: τ5-CeZn(Zn1−xSix)2, τ6-CeZn2(Si1−xZnx)2, and τ7-Ce37Zn48Si15. Moreover binary CeZn11 enters the phase equilibria at 600 °C. Similar to 800 °C, solubility of Si is negligible for all binary compounds CeZnx with x > 2. Extended homogeneity regions were established for τ1 and τ2, as well as for τ5 and τ6 (Table 1 for details see Table 5). The homogeneity range of τ1-Ce7Zn21(Zn1−xSix)2 becomes slightly smaller at 600 °C as compared to 800 °C. The maximum concentration of Si in this phase practically remained the same, while the minimum amount of Si required to stabilize this phase slightly increased from x = 0.28 (1.9 at.% Si) at 800 °C to x = 0.45 (3.0 at.% Si) at 600 °C. The homogeneity range of τ1 at 800 °C, studied by combination of XRPD, XRSC, and EPMA contradicts the claim of Hoos et al.10 regarding 3.5 at.% Si as minimum amount of Si in this phase. The three-phase regions involving binary Ce–Zn phases with more than 75 at.% Zn at 600 °C resemble those observed at 800 °C.
| Phase region | Phases | Structure type | EPMA (at.%) | Lattice parameters (nm) | ||||
|---|---|---|---|---|---|---|---|---|
| Ce | Zn | Si | a | b | c | |||
| a The values are calculated from compositional dependence of corresponding lattice parameters (Fig. 9). | ||||||||
| τ5 + τ6 + Si | τ5 | CeNiSi2 | 25 | 36.8 | 38.2 | 0.4209(1) | 1.7662(5) | 0.4177(1) |
| τ6 | ThCr2Si2 | 20.5 | 49.8 | 29.7 | 0.41881(6) | — | 1.0560(4) | |
| Si | Cdiamond | — | — | — | 0.54297(5) | — | — | |
| CeSi2 + τ5 + Si | CeSi2 | ThSi2 | 33.0 | 15.2 | 51.8 | 0.42025(3) | — | 1.4172(4) |
| τ5 | CeNiSi2 | 24.8 | 38.1 | 37.1 | 0.42046(7) | 1.7699(3) | 0.41713(3) | |
| Si | Cdiamond | 0.3 | 0.5 | 99.2 | ||||
| τ6 + L(Zn) + Si | τ6 | ThCr2Si2 | 19.9 | 52.0 | 28.1 | 0.41848(3) | — | 1.05615(6) |
| L(Zn) | Mg | — | — | — | ||||
| Si | Cdiamond | 0.0 | 0.4 | 99.6 | 0.54298(4) | — | — | |
| τ6 + L(Zn) + CeZn11 | τ6 | ThCr2Si2 | 19.8 | 51.9 | 28.3 | 0.41830(6) | — | 1.0558(3) |
| L(Zn) | Mg | 0.4 | 99.3 | 0.3 | — | — | — | |
| CeZn11 | BaCd11 | 8.6 | 91.1 | 0.3 | 1.0662(1) | — | 0.6866(1) | |
| τ5 + CeZn11 + Ce2Zn17 | τ5 | CeNiSi2 | — | — | — | 0.4210(1) | 1.767(1) | 0.4165(1) |
| CeZn11 | BaCd11 | — | — | — | 1.0661(1) | — | 0.6865(1) | |
| αCe2Zn17 | TbCu7 | 10.8 | 88.8 | 0.4 | 0.5253(1) | — | 0.4433(1) | |
| τ5 + τ6 + CeZn11 | τ5 | CeNiSi2 | — | — | — | 0.42173(1) | 1.75258(2) | 0.41738(1) |
| τ6 | ThCr2Si2 | — | — | — | 0.41872(7) | — | 1.0558(1) | |
| CeZn11 | BaCd11 | — | — | — | 1.0662(1) | — | 0.6868(2) | |
| τ2 + CeSi2 + Ce2Zn17 | τ2 | AlB2 | 33.3 | 25.6 | 41.1a | 0.41365(5) | — | 0.42967(5) |
| CeSi2 | ThSi2 | 33.3 | 19.4 | 47.3a | 0.42029(6) | — | 1.4258(4) | |
| αCe2Zn17 | TbCu7 | — | — | — | 0.52571(3) | — | 0.44397(7) | |
| τ2 + Ce3Zn22 + Ce2Zn17 | τ2 | AlB2 | 33.3 | 28.8 | 37.9a | 0.41816(1) | — | 0.42592(2) |
| Ce3Zn22 | Ce3Zn22 | 12.1 | 87.7 | 0.2 | 0.89375(2) | — | 2.13790(2) | |
| αCe2Zn17 | TbCu7 | 10.7 | 89.0 | 0.3 | 0.52482(6) | — | 0.44295(2) | |
| τ2 + CeZn5 + Ce3Zn22 | τ2 | AlB2 | 33.3 | 28.9 | 37.8a | 0.41857(7) | — | 0.4260(2) |
| CeZn5 | CaCu5 | 16.7 | 82.8 | 0.5 | — | — | — | |
| Ce3Zn22 | Ce3Zn22 | 12.2 | 87.4 | 0.4 | 0.8937(4) | — | 2.138(1) | |
| τ2 + CeZn5 + τ1 | τ2 | AlB2 | 33.3 | 31.3 | 35.4a | 0.42206(5) | — | 0.42334(6) |
| CeZn5 | CaCu5 | — | — | — | 0.54236(4) | — | 0.42553(5) | |
| τ1 | Ce7Zn23−x | 22.8 | 70.6 | 6.6 | — | — | — | |
| τ1 + CeZn5 + Ce13Zn58 | τ1 | Ce7Zn23−x | 23.1 | 70.8 | 6.1 | 1.4882(2) | 1.7238(4) | 0.4491(1) |
| CeZn5 | CaCu5 | 16.6 | 83.3 | 0.1 | 0.54256(9) | — | 0.42542(8) | |
| Ce13Zn58 | Gd13Zn58 | 18.0 | 81.9 | 0.1 | 1.4622(2) | — | 1.4178(3) | |
| τ1 + Ce13Zn58 + Ce3Zn11 | τ1 | Ce7Zn23−x | 23.1 | 72.4 | 4.4 | — | — | — |
| Ce13Zn58 | Gd13Zn58 | 17.9 | 81.9 | 0.2 | — | — | — | |
| Ce3Zn11 | La3Al11 | 21.5 | 78.3 | 0.2 | — | — | — | |
| τ1 + Ce3Zn11 + CeZn3 | τ1 | Ce7Zn23−x | 23.1 | 73.6 | 3.3 | — | — | — |
| Ce3Zn11 | La3Al11 | 21.4 | 78.4 | 0.2 | 0.4514(1) | 0.8879(2) | 1.3463(3) | |
| CeZn3 | CeZn3 | 24.7 | 75.1 | 0.2 | — | — | — | |
| τ1 + CeZn2 + CeZn3 | τ1 | Ce7Zn23−x | 23.3 | 72.8 | 4.0 | 1.5498(4) | 1.7107(4) | 0.4502(1) |
| CeZn3 | CeZn3 | 25.2 | 74.5 | 0.3 | 0.46254(6) | 1.0448(5) | 0.6641(1) | |
| CeZn2 | CeCu2 | 32.9 | 63.8 | 3.3 | 0.46417(6) | 0.7596(7) | 0.7508(1) | |
| τ1 + τ7 + τ2 | τ1 | Ce7Zn23−x | 23.3 | 71.1 | 5.6 | — | — | — |
| τ2 | AlB2 | 33.3 | 48.4 | 18.3 | 0.4388(1) | — | 0.39738(7) | |
| τ7 | Unknown | 36.9 | 48.5 | 14.6 | — | — | — | |
Despite all these three-phase equilibrium triangles are narrow, we were able to prepare corresponding samples and to define by EPMA the composition of the equilibrium phases involved. Ternary phases Ce(Si1−xZnx)2 (α-ThSi2 type), τ2, and τ5 that coexist in three-phase equilibria with binary CeZnx (x ≥ 5) crystallized in fine microstructures, which made quantitative analyses by EPMA unreliable. The fine grains could not be agglomerated even with longer annealing time (more than two weeks). Therefore the ternary phases Ce(Si1−xZnx)2 with α-ThSi2 type, τ2, and τ5, and their composition were determined via Rietveld refinement in combination with the compositional dependence of lattice parameters presented in Fig. 9.
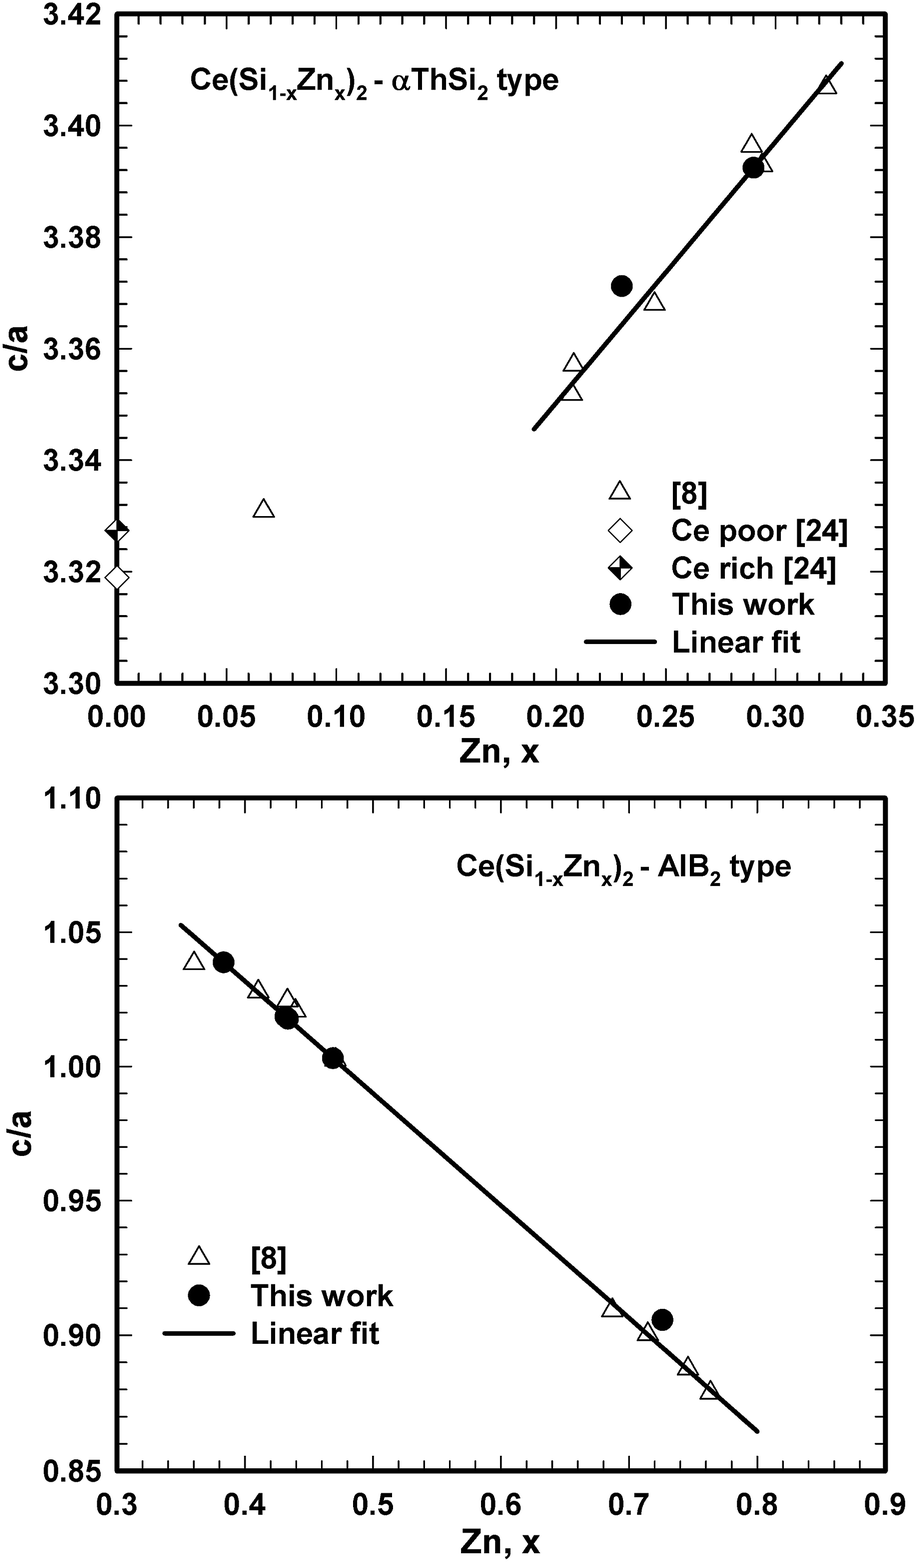 | ||
| Fig. 9 Compositional dependence of c/a ratio for Ce(Si1−xZnx)2 with αThSi2 (left) and AlB2 (right) type. | ||
Microstructures of selected three-phase equilibria are given in Fig. 10. Alloys in equilibrium with Si, which were prepared from CeSix master alloys containing CeSi2, did not reach complete equilibrium even after re-powderization followed by hot pressing and/or long term annealing. Ce(Si1−xZnx)2, x ≤ 0.25, with α-ThSi2 type was always observed in those alloys. Moreover, long term annealing generally shifted the overall alloy composition due to unavoidable evaporation of Zn, especially for alloys in the Zn-rich corner. However, equilibrated samples were easily obtained in case binary Ce–Si precursors with Ce content above 40 at.% were used.
 | ||
| Fig. 10 Selected micrograph of Ce–Zn–Si alloys annealed at 600 °C: (a) Ce32Zn54Si14, (b) Ce18Zn81Si1, (c) Ce21Zn78Si1, (d) Ce23Zn76Si1, (e) diffusion couple Ce70Si30–Zn (12 hours), and (f) diffusion couple Ce50Si50–Zn (12 hours) (nominal composition in at.%). | ||
Table 5 summarizes data on composition and lattice parameters of all phases coexisting in equilibrium at 600 °C. The only uncertainty concerns the maximal solubility of Si in binary CeZn2. Our various attempts to prepare samples in the corresponding three-phase region τ7 + CeZn2 + τ1 resulted in non-equilibrium alloys with about 5 at.% Si in the CeZn2-phase. It is noteworthy that the phase triangulation in this part of the phase diagram at 600 °C is different from that established at 800 °C (ref. 8) and this is essentially due to the formation of τ7. Thus, two three-phase regions: Ce(Zn1−xSix)2(CeCu2-type) + τ2 + τ1 and Ce(Zn1−xSix)2(CeCu2-type) + τ2 + τ4, which were observed at 800 °C are now changed into two three-phase regions: τ7 + τ2 + τ1 and τ7 + Ce(Zn1−xSix)2 (CeCu2-type) + τ1, possibly due to the peritectoid formation of τ7 (τ2 + τ4 + Ce(Zn1−xSix)2 ⇔ τ7), and a U-type reaction (τ2 + Ce(Zn1−xSix)2 ⇔ τ1 + τ7) in the temperature interval 600 °C < T < 800 °C.
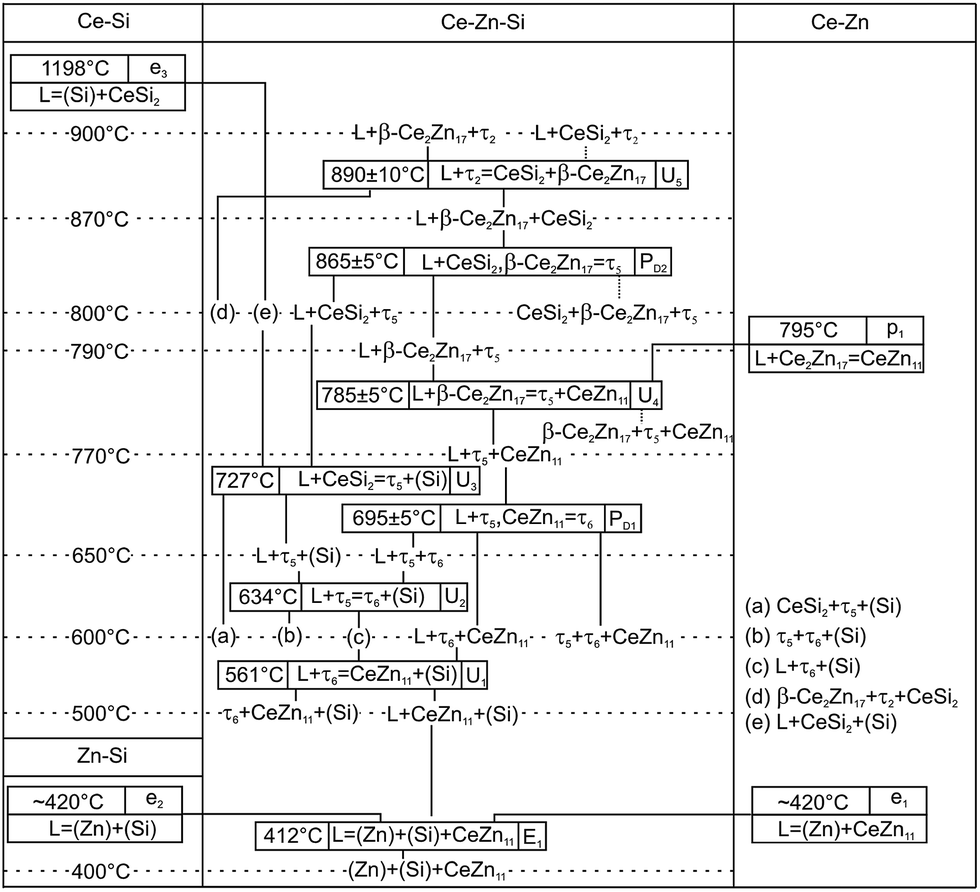
3.5. Formation of τ5 and τ6 and partial Schulz–Scheil diagram
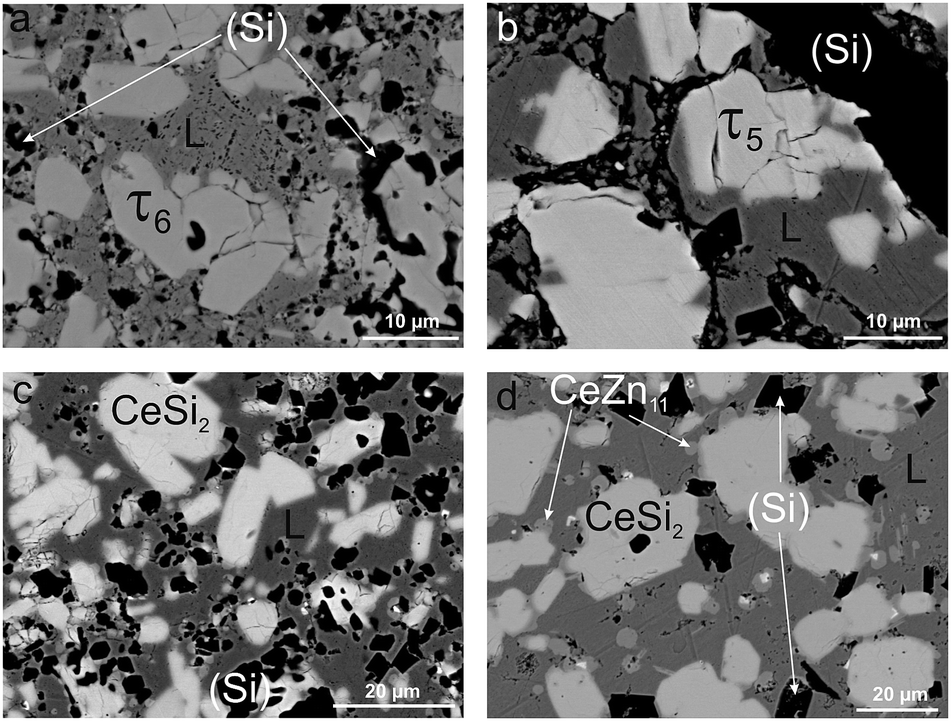
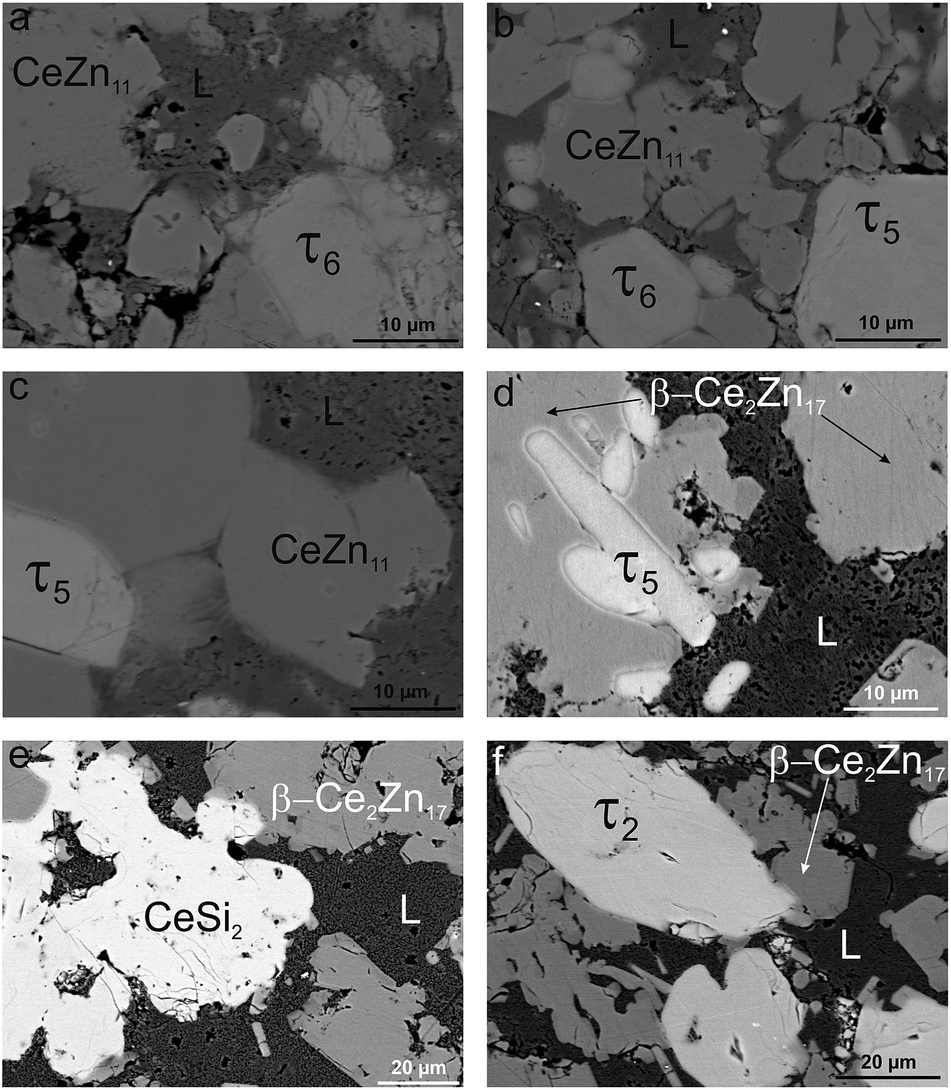
Due to the high melting point of cerium silicides Ce(Si1−xZnx)2 and the high vapour pressure of Zn at elevated temperatures, it is difficult to obtain homogeneous cast alloys for the determination of the crystallization behaviour of alloys. On the other hand, the established isothermal section at 600 °C shows that three-phase regions involved in equilibria with binary Ce–Zn compounds are very narrow and our attempts to equilibrate the samples at higher temperature resulted in a significant change of the overall compositions. Filling the ampoules with argon slightly suppressed the Zn losses, but even in this case samples were heterogeneous, which at first did not allow us to reliably determine the change in phase equilibria via annealing at different temperatures. This shift of the compositions during thermal treatment also hinders the interpretation of DTA. For instance, DTA measurements on single-phase τ5 and τ6 resulted in a sequence of several thermal effects that are difficult to reconcile with the phase triangulation. Investigation of the specimens after DTA by SEM/EDX showed that samples became heterogeneous and contained regions with different phases (see Fig. 11). Reliable temperatures for isothermal reactions were only obtained for wide three-phase regions: CeSi2 + τ5 + (Si), τ5 + τ6 + (Si), τ6 + CeZn11 + (Si), CeZn11 + (Zn) + (Si). The temperatures of invariant reactions that correspond to these fields were derived as follows: 727 °C, 634 °C, 561 °C and 412 °C, respectively. These four isothermal reaction temperatures were confirmed by DTA from the Zn-rich sample that contains τ6, (Si), and CeZn11 (close to the tie line (Si) + CeZn11) (see Fig. 12). After three DTA runs the sample contains additionally τ5, (Zn), and CeSi2, which suggests incongruent formation of both τ5 and τ6. | ||
| Fig. 11 Micrograph of τ5 after DTA, showing sequence of crystallization: CeSi2-τ5–τ6. | ||
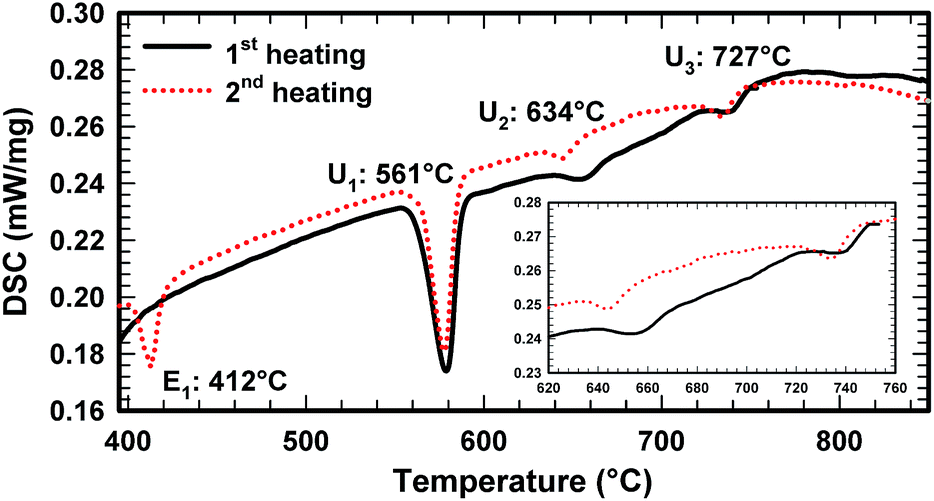 | ||
| Fig. 12 DTA curve of alloy Ce5.9Zn59.8Si34.3. | ||
All invariant reactions determined are summarized in the Scheil reaction scheme in Fig. 13 along with the partial isothermal sections (Fig. 14) at temperatures between the thermal effects established by DTA. Selected microstructures of alloys are presented in Fig. 15 and 16. Comparing the phase equilibria at 500 °C (Fig. 14a) with those observed at 600 °C (Fig. 14b) we conclude on the existence of a transition type reaction U1 (561 °C after DTA): L + τ6 ⇔ CeZn11 + (Si).
 | ||
| Fig. 13 Scheil diagram for the Zn-rich corner. | ||
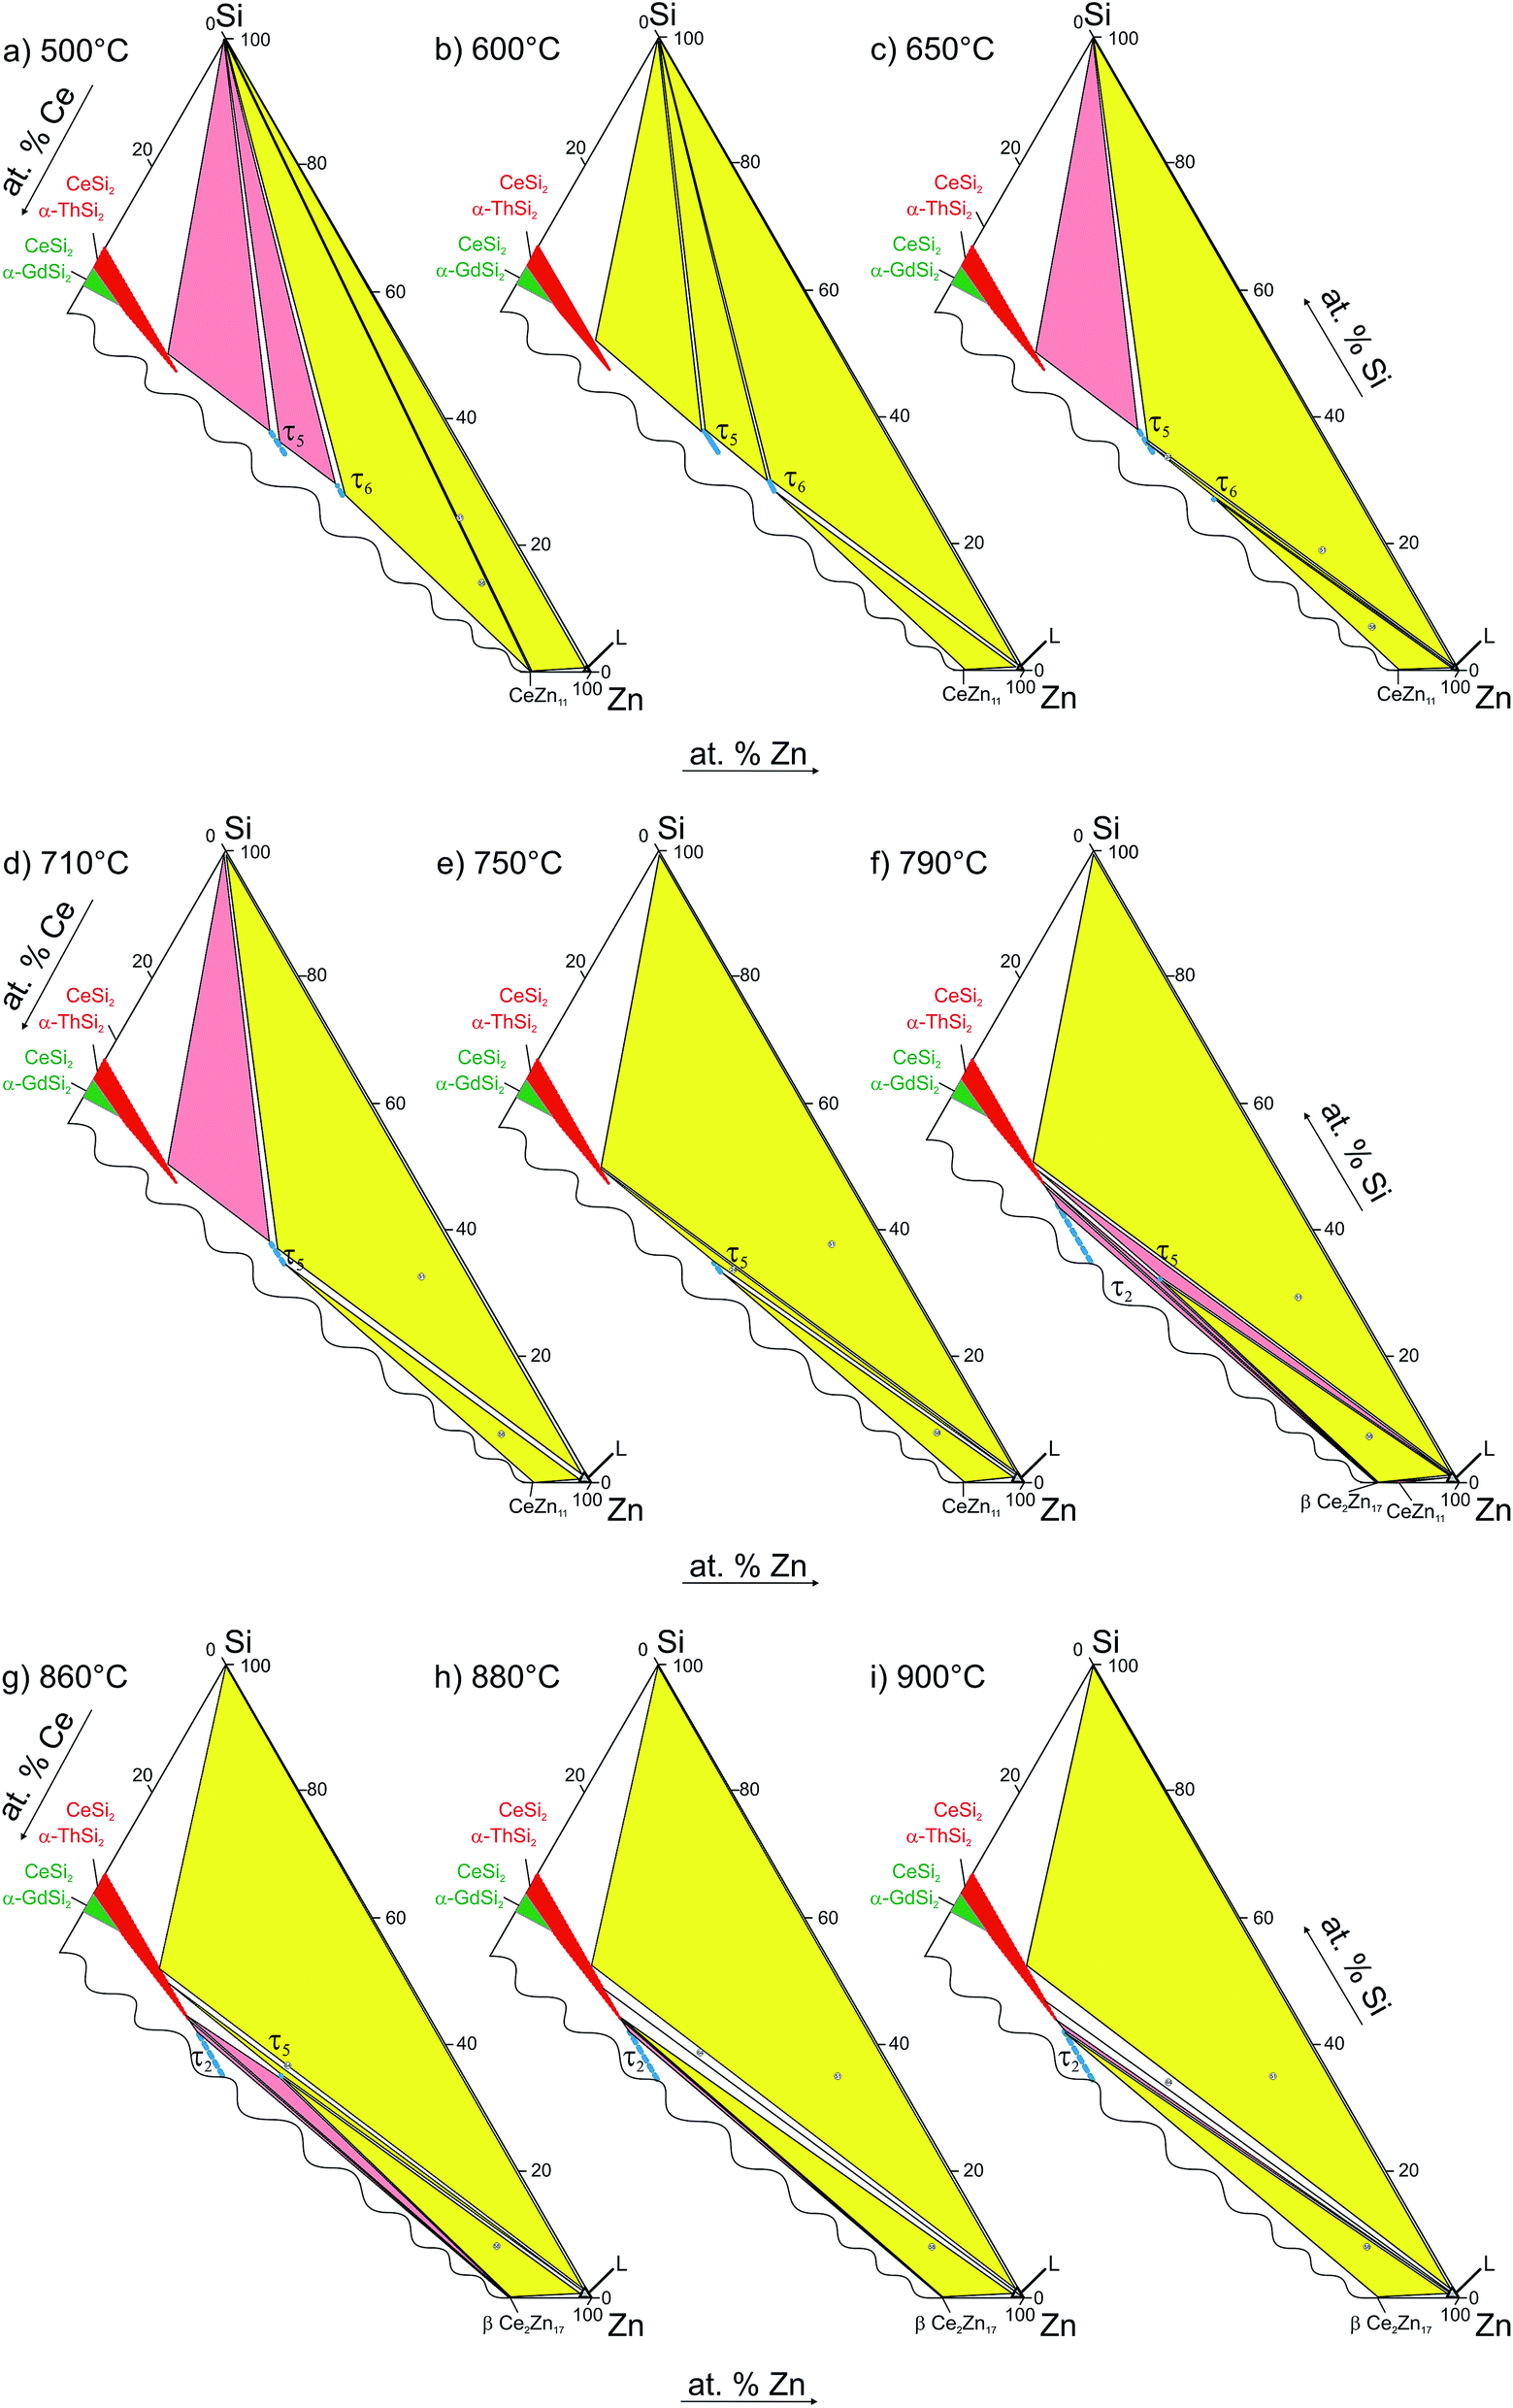 | ||
| Fig. 14 Partial isothermal sections in the Zn-corner at various temperatures. | ||
 | ||
| Fig. 15 Microstructure of alloy Ce5.9Zn59.8Si34.3 annealed at different temperatures: (a) 600 °C, (b) 650 °C, (c) 750 °C, (d) 900 °C for one day each under argon. | ||
 | ||
| Fig. 16 Microstructure of alloy Ce7.6Zn78.4Si14 annealed at different temperatures: (a) 650 °C, (b) 710 °C, (c) 750 °C, (d) 790 °C, (e) 880 °C, and (f) 900 °C for one day each under argon. | ||
The characterization of sample Ce5.9Zn59.8Si34.3 shows that τ6 coexists in equilibrium with (Si) and L(Zn) at 600 °C (Fig. 15a), however after annealing at 650 °C τ6 was not observed in this sample, instead τ5 enters the equilibrium with L(Zn) and silicon (Fig. 14c and 15b). Such a change of phase equilibria requests another transition type reaction U2: L + τ5 ⇔ τ6 + (Si) to occur between 600 and 650 °C (634° after DTA).
Although τ6 was observed in the sample Ce7.6Zn78.4Si14 annealed at this temperature, τ6 does not participate in the equilibria at 710 °C (Fig. 14d). It has to be noted that the microstructure of this sample contains four phases (τ6, τ5, CeZn11, and L(Zn), see Fig. 16b) and one of these phases has to be considered as non-equilibrium phase. Comparing this microstructure with the three-phase structure (τ5, CeZn11 and L(Zn)) obtained for this sample annealed at 750 °C (Fig. 16c) we may safely conclude that τ6 is the non-equilibrium phase that forms during quenching from 710 °C. On the other hand, the same sample annealed at 690 °C showed only 3 phases (τ6, CeZn11 and L(Zn)). Based on these observations, the invariant reaction for the formation of τ6 is supposed to occur in the temperature range between 690 and 700 °C (see Fig. 13).
Three peritectic-type reactions may be responsible for the formation of this phase: (i) L + τ5 ⇔ τ6, (ii) L + τ5 + CeZn11 ⇔ τ6 and (iii) L + τ5 + (Si) ⇔ τ6. The latter reaction requests the existence of a three-phase field τ5 + τ6 + (Si) at a temperature just below this invariant reaction. However, this three-phase field is not observed at 650 °C (see Fig. 14c), and thus rules out reaction (iii). Rietveld analysis of a sample with composition of Ce24.5Zn37.5Si38.0 annealed at 650 °C showed three phases: L(Zn) + τ5 + τ6. However due to porosity of the sample it was not possible to reliably analyze the microstructure. Due to a strong degeneracy of the three-phase field L(Zn) + τ5 + τ6 (compositions of these phases lie almost on one line; (see Fig. 14c), the two remaining possible invariant reactions (i) and (ii) are almost identical from a thermodynamic point of view.
The existence of a maximum on the solidus in the two-phase field τ5 + τ6 would infer a three-phase invariant peritectic L + τ5 ⇔ τ6, but due to the difficulties in the interpretation of DTA we cannot provide such evidence. Thus the type of this reaction remains uncertain and is therefore denoted as a degenerated peritectic: L + τ5, CeZn11 ⇔ τ6 in the temperature range 690 ≤ T ≤ 700 °C (PD1: Fig. 13). The invariant reaction recorded by DTA at 727 °C (Fig. 12) is defined as transition type reaction U3, L + CeSi2 ⇔ τ5 + (Si). Confirmation is available from a comparison of the isothermal sections and microstructures of the alloys annealed at 710 (the micrograph is not shown due to its similarity to 650 °C) and 750 °C (Fig. 14d and e and 15b and c). Similar to the narrow three-phase field L(Zn) + τ5 + τ6, Rietveld analysis of sample Ce22.7Zn42.9Si34.4 annealed at 750 °C revealed three phase constituents: L(Zn), τ5, and CeSi2 consistent with the three-phase field L(Zn) + τ5 + CeSi2.
The previously reported isothermal section at 800 °C (ref. 8) suggested that τ5 is unstable at this temperature and decomposes into Ce(Si1−xZnx)2 with α-ThSi2 type, L(Zn), and possibly CeZn11 or β-Ce2Zn17. Indeed DTA runs of sample Ce7.6Zn78.4Si14 up to 850 °C gave two signals between 780–790 °C. Surprisingly EPM analysis of this sample after three DTA runs did not show any trace of Ce(Si1−xZnx)2. In order to confirm these observations the remaining pieces of Ce7.6Zn78.4Si14 alloys were heat treated at 770, 790, 810, 850, 860, 870, 880 and 900 °C.
Rietveld refinement and EPM analysis clearly showed that τ5 is still stable up to 850 °C and is in equilibrium with L(Zn) and β-Ce2Zn17, while at 900 °C it disappears completely yielding a three-phase field L(Zn) + β-Ce2Zn17 + τ2. Such a peritectic reaction involving τ2 is not compatible with the existence of the three-phase field τ2 + CeSi2 + β-Ce2Zn17. Careful heat treatment between 850–900 °C followed by XRPD and EPM analysis showed that an alloy annealed at 860 °C gives the same phase constituents as in 850 °C, while at 870 °C Ce(Si1−xZnx)2 with α-ThSi2 type is additionally present in this sample. This fact narrows down the decomposition temperature of τ5 to 865 ± 5 °C, and confirms the participation of Ce(Si1−xZnx)2 with α-ThSi2 type in the peritectic formation of τ5. Taking into consideration similar arguments, as discussed above for the formation of τ6, a degenerated invariant reaction of peritectic type PD2: L + CeSi2, β-Ce2Zn17 ⇔ τ5 is assigned. The equilibria observed at 900 °C could be explained by a transition type reaction U5: L + τ2 ⇔ CeSi2 + β-Ce2Zn17 that occurs at 890 ± 10 °C.
One of the afore-mentioned thermal effects observed between 780–790 °C could be attributed to a transition type reaction U4: L + β-Ce2Zn17 ⇔ τ5 + CeZn11. The phase field L(Zn) + τ5 + CeZn11 was still observed up to 770 °C, while at 790 °C it changed to L(Zn) + τ5 + β-Ce2Zn17. Note that in some samples CeZn11 and/or τ6 were observed as the fourth or fifth phase. Based on the amount and morphology, those phases were considered to be formed during the quenching process.
The stability of τ5 at 800 °C has been incorporated in the new isothermal section shown in Fig. 17. It supersedes the older version by Malik et al.8 In addition to the three-phase field L(Zn) + τ5 + β-Ce2Zn17, two narrow three-phase fields are required to complete the section: CeSi2 + τ5 + β-Ce2Zn17 and L(Zn) + τ5 + CeSi2. Note that the three-phase field L(Zn) + CeSi2 + (Si) is still stable up to 900 °C. Such narrow phase fields are complicated to investigate, and without careful control of the overall sample composition it may earlier have led to a wrong conclusion regarding the stability of τ5.
 | ||
| Fig. 17 Isothermal section at 800 °C (modified after ref. 8; see text). | ||
The results on the phase equilibria are consistent (i) with the single crystal growth experiments, which reveal a large crystallization field of the αThSi2-type phase Ce(Si1−xZnx)2 extending far into the Zn-rich corner (up to 95 at.% Zn), and consequently (ii) with a rather steep liquidus surface in the Zn-rich region, which infers a high degeneracy in the isothermal reactions involving the Zn-rich liquid.
3.6. Physical properties of τ5-CeZn(Zn1−xSix)2 and τ6-CeZn2(Zn0.28Si0.72)2
Ac magnetic susceptibility measurements on a polycrystalline sample of τ5 CeZn(Zn0.32Si0.68)2 revealed a δ-shape magnetic anomaly near TC ∼ 5 K (see Fig. 18) which is indicative of a ferromagnetic transition. Accordingly, we performed dc magnetisation and dc susceptibility measurements on a few freely rotating, flux-grown single crystals of τ5 (with a total mass of 0.8 mg). Field dependent isothermal (see Fig. 19) as well as temperature dependent magnetisation (Fig. 20) measurements confirm ferromagnetic ordering below about 4.4 K with a saturation moment near 1μB at 1.9 K and 6 T. The slightly lower TC of the flux-grown single crystals as compared to the polycrystalline bulk samples relates to slightly different compositions of τ5 bulk samples as compared to flux grown τ5 crystals CeZn(Zn0.29Si0.71)2.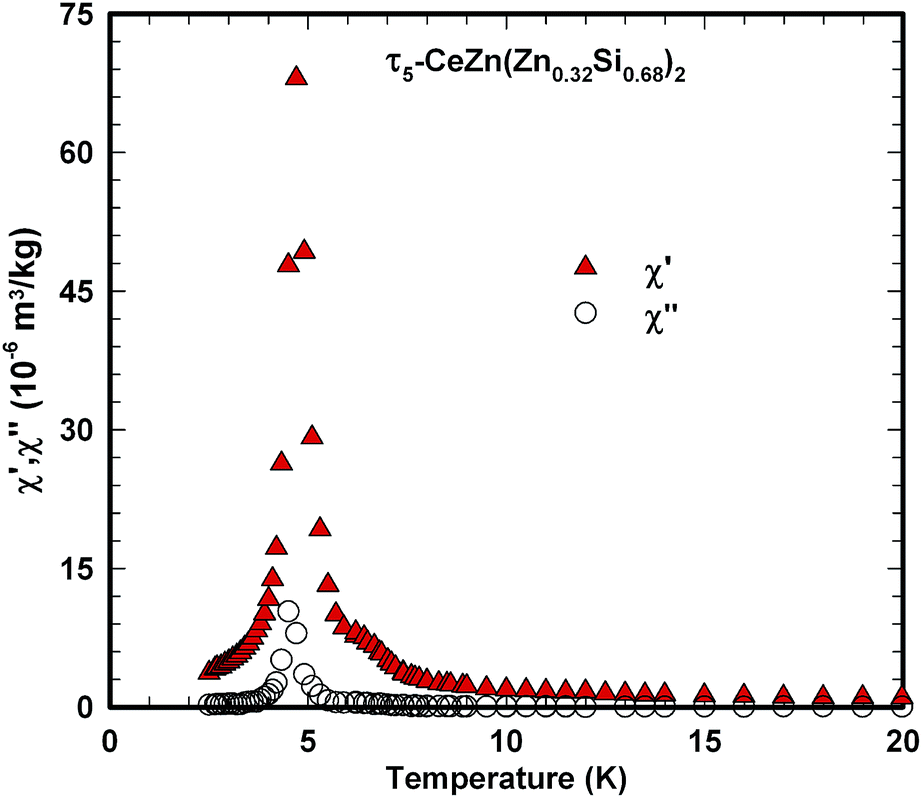 | ||
| Fig. 18 Temperature dependent in-phase and out-of-phase ac susceptibility components, χ′ and χ′′, measured on polycrystalline τ5-CeZn(Zn0.32Si0.68)2 with a field amplitude of 325 A m−1 and frequency of 100 Hz. | ||
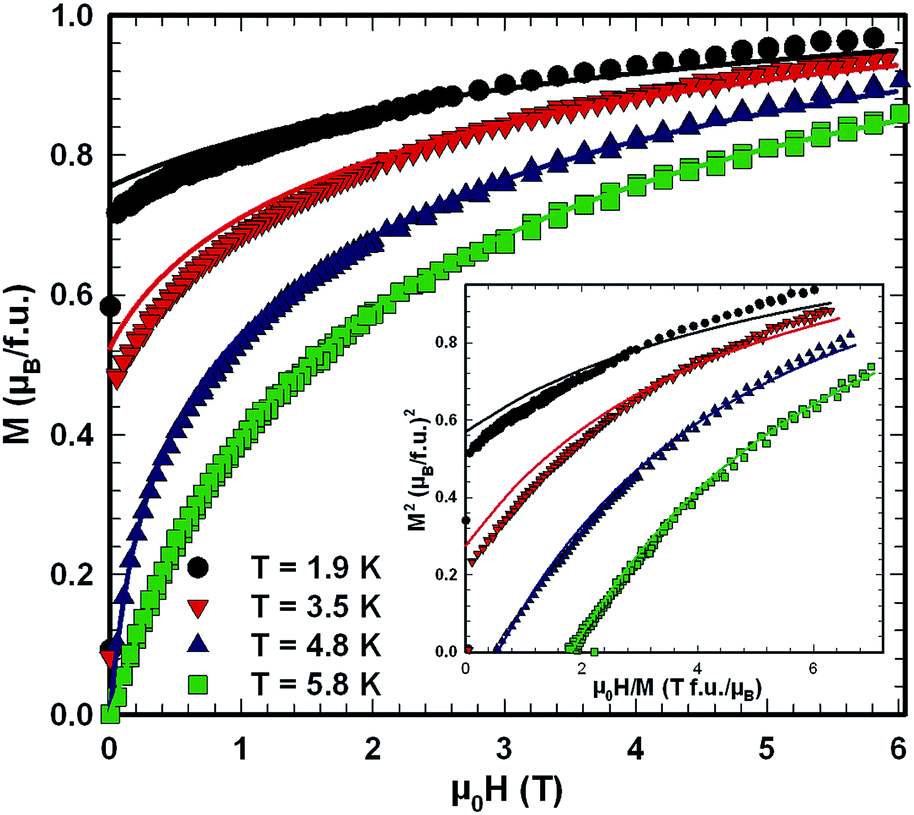 | ||
| Fig. 19 Isothermal magnetisation measurements of single crystalline τ5-CeZn(Zn0.29Si0.71)2; the inset shows the corresponding Arrott plot, M2vs. H/M. The solid lines display a model calculation in terms of the resonant level model by Schotte and Schotte. | ||
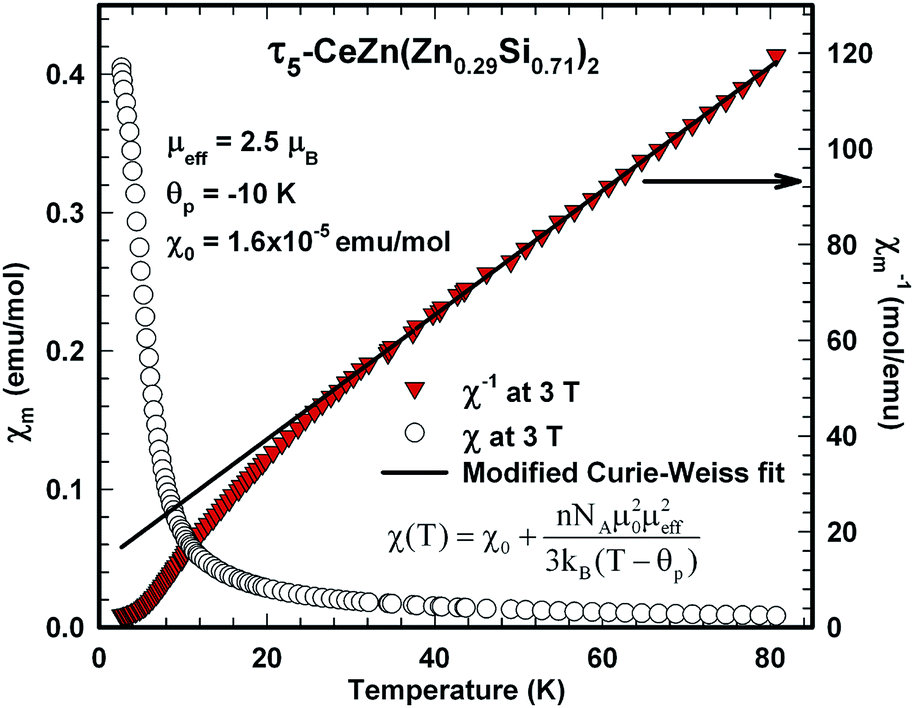 | ||
| Fig. 20 Temperature dependent dc magnetic susceptibility, χ(T) at left axis, and inverse magnetic susceptibility, 1/χ(T) at right axis, of freely rotating τ5-CeZn(Zn0.29Si0.71)2 single crystals measured at 3 T; the solid line displays a modified Curie–Weiss fit of the inverse susceptibility. | ||
The ferromagnetic phase transition at TC ∼ 4.4 K is corroborated by distinct anomalies of the specific heat and electrical resistivity in Fig. 21 and 22, respectively.
 | ||
| Fig. 21 Temperature dependent specific heat of τ5-CeZn(Zn0.29Si0.71)2 single crystals and polycrystalline τ6-CeZn2(Zn0.28Si0.72)2; the solid and dotted lines refer to the analysis of τ5 data in terms of the resonant level model by Schotte and Schotte and a tentative phonon contribution represented by a Debye function, respectively. | ||
 | ||
| Fig. 22 Temperature dependent electrical resistivity of polycrystalline τ5-CeZn(Zn0.32Si0.68)2. Bottom right inset shows the kink at the ordering temperature; top left inset shows the Seebeck coefficient above room temperature. | ||
The analysis of the inverse dc magnetic susceptibility in terms of a modified Curie–Weiss fit, χ(T) = χ0 + C/(T − Θp), in Fig. 20 reveals an effective paramagnetic moment of Ce near 2.5μB which is close to the effective moment of free Ce3+ (2.54μB). The negative value of the paramagnetic Curie temperature of −10 K obtained from analysing the data of freely rotating crystals refers to Kondo correlations rather than to a specific type of magnetic coupling (whether antiferro- or ferromagnetic). The relevance of Kondo correlations for τ5 is further revealed by the temperature dependence of the electrical resistivity in Fig. 22, showing typical Kondo lattice features, and by the specific heat data in Fig. 21. The magnitude of the specific heat anomaly at TC of τ5-CeZn(Zn0.29Si0.71)2 single crystals is significantly reduced as compared to the value expected from a basic local moment mean-field approach. We thus analyse the temperature dependence and magnitude of the magnetic specific heat contribution in terms of a simple model for a ferromagnetic Kondo lattice system based on the resonant level model by Schotte and Schotte.39,40 The details of this model calculations are explained e.g. in ref. 41.
The corresponding fit to the experimental data, indicated as solid line in Fig. 21, yields a ferromagnetic exchange coupling J = 14.6 K and a Kondo temperature TK = 5 K, thus, suggesting a ferromagnetic Kondo lattice ground state of τ5-CeZn(Zn0.32Si0.68)2. The largest deviation between the applied model and the experimental data is observed right above the ferromagnetic phase transition and relates to short range order and phonon contributions which are not included in the model. Using the same values for J and TK and an effective Landé factor g = 2 to adjust the model for the unknown 4f wave function of the crystal field ground state doublet, we calculated the temperature and field dependent magnetisation displayed as solid lines in Fig. 19. The approximate agreement with the experimental data further supports the validity of a ferromagnetic Kondo model.
The magnetic ground state properties of polycrystalline bulk samples of τ6 CeZn2(Zn0.28Si0.72)2 were studied by means of specific heat as well as dc and ac magnetic susceptibility measurements at temperatures down to 3 K. Within the experimental temperature range the τ6 phase displays a Curie–Weiss type paramagnetic behaviour as demonstrated by the dc magnetic susceptibility depicted in Fig. 23. A modified Curie–Weiss fit of the inverse susceptibility in the temperature interval 80–300 K is indicated as solid line in Fig. 23 and yields a temperature independent Pauli component χ0 = 1.0 × 10⁻⁴ emu mol−1, a paramagnetic Curie–Weiss temperature Θp = −0.5 K being indicative for weak antiferromagnetic or very weak Kondo correlations. Via the Curie constant of this fit an effective paramagnetic moment μeff = 2.34μB is calculated, which is markedly reduced as compared to the Ce3+ free ion value (2.54μB). The heat capacity data of τ6 CeZn2(Zn0.28Si0.72)2 in Fig. 21 display an upturn at lowest temperatures, which may either refer to short range correlations above a magnetic phase transition taking place below 3 K or refer to Kondo correlations with a rather small characteristic energy of the order of one Kelvin.
 | ||
| Fig. 23 Temperature dependent dc magnetic susceptibility, χ(T) at left axis, and inverse magnetic susceptibility, 1/χ(T) at right axis, of polycrystalline τ6-CeZn2(Zn0.28Si0.72)2 measured at 3 T; the solid line displays a modified Curie–Weiss fit of the inverse susceptibility. | ||
Consistent with the small Seebeck coefficient (see top left inset in Fig. 22) electrical resistivity of τ5 indicates metallic type behaviour ruling out any thermoelectrically interesting behaviour.
4. Conclusions
As the Ce–Zn–Si system is an important part of multinary Mg-based Mg–Zn–Mn–RE–(Si) high strength lightweight alloys for automotive applications, we have explored the constitution of the Ce–Zn–Si subsystem and particularly have determined in this work the phase equilibria for the isothermal section at 600 °C in the region with <33.3 at.% Ce. Five ternary compounds (τ1, τ2, τ5 to τ7) exist at the investigated region at 600 °C. Several four-phase reactions in the Zn rich corner were detected by DTA, including the peritectic decomposition temperatures of τ5 and τ6 at 865 ± 5 °C and 695 ± 5 °C, respectively. To provide details on the solidification of Ce-poor alloys, a Schultz–Scheil diagram was constructed from DTA measurements and partial isothermal sections determined at various temperatures. The crystal structures of τ5 (CeNiSi2-type, Cmcm, a = 0.42079(1), b = 1.76522(3), c = 0.41619(1) nm), and τ6 (ThCr2Si2-type, I4/mmm, a = 0.41757(1), c = 1.05073(2) nm) were solved from X-ray single crystal diffraction data. An interesting case was met in the stabilization by extremely small amounts of Ge (less than ∼2 atom percent of Ge) of the ternary phases {La,Ce}7Zn21(Zn1−xGex)2, both isotypic with the structure of Ce7Zn21(Zn1−xSix)2. DFT calculations elucidated the extent and nature of the stabilizing effect of Ge in Ce7Zn23−xGex discussing the electronic structure in terms of the density of states (DOS) and determining enthalpies of formation for Ce7Zn23−xGex (x = 0, 0.5, 2) as well as for several neighbouring binary Ce–Zn phases.Physical property measurements document that neither τ5 nor τ6 are near a metal to insulator transition and thus exhibit rather metallic than semiconducting (thermoelectric) behaviour. Magnetic measurements as well as specific heat and electrical resistivity data reveal interesting ferromagnetic Kondo lattice behavior for τ5-CeZn(Zn1−xSix)2 with a Curie temperature TC = 4.4 K, whereas τ6 displays Curie–Weiss type paramagnetic behavior down to 3 K. The effective paramagnetic moments of Ce obtained from Curie–Weiss fit of τ5 (2.50μB) and τ6 (2.34μB) suggest that the ground state of Ce-ions in these compounds is trivalent or close to 3+.
Acknowledgements
The research reported herein was supported by the Austrian Federal Ministry of Science and Research (BMWF) under the scholarship scheme: Technology Grant Southeast Asia (Ph.D) in the frame of the ASEA UNINET. DFT calculations were done on the facilities of the Vienna Scientific Cluster (VSC). The authors are also grateful for the support by the OeAD WTZ Austria-Czech Republic CZ12/2013 and by the Ministry of Education, Youth and Sports of the Czech Republic under the project 7AMB13AT019. The financial support by the project “CEITEC – Central European Institute of Technology” (CZ.1.05/1.1.00/02.0068) from the European Regional Development Fund and by the Grant Agency of the Czech Republic (Project no. GA14-15576S) is gratefully acknowledged by P. Brož.References
- E. Bauer, G. Hilscher, H. Michor, C. Paul, E. W. Scheidt, A. Gribanov, Y. Seropegin, H. Noël, M. Sigrist and P. Rogl, Phys. Rev. Lett., 2004, 92, 027003 CrossRef CAS PubMed.
- E. Bauer and P. Rogl, in Non-Centrosymmetric Superconductors, ed. E. Bauer and M. Sigrist, Springer, Berlin, Heidelberg, 2012, pp. 3–33 Search PubMed.
- R. Küchler, P. Gegenwart, C. Geibel and F. Steglich, Sci. Technol. Adv. Mater., 2007, 8, 428 CrossRef.
- B. Chevalier, P. Rogl, K. Hiebl and J. Etourneau, J. Solid State Chem., 1993, 107(2), 327–331 CrossRef CAS.
- A. Amato and J. Sierro, J. Magn. Magn. Mater., 1985, 47–48, 526–528 CrossRef CAS.
- P. Rogl, in Handbook on the Physics and Chemistry of Rare Earths, ed. K. A. Gschneidner Jr and L. Eyring, Elsevier, 1984, vol. 7, pp. 1–264 Search PubMed.
- H. Kido, T. Hoshikawa, M. Shimada and M. Koizumi, Phys. Status Solidi A, 1983, 80, 601–605 CrossRef CAS.
- Z. Malik, A. Grytsiv, P. Rogl and G. Giester, Intermetallics, 2013, 36, 118–126 CrossRef CAS.
- N.-T. Suen and S. Bobev, Inorg. Chem., 2013, 52, 12731–12740 CrossRef CAS PubMed.
- J. Hoos, N.-T. Suen and S. Bobev, Acta Crystallogr., Sect. C: Struct. Chem., 2014, 70, 945–948 CAS.
- P. Villars and K. Cenzual, Pearson's Crystal Data–Crystal Structure Database for Inorganic Compounds, release 2014/15, ASM International, Materials Park, OH, USA, 2014 Search PubMed.
- J. Rodriguez-Carvajal, Satellite Meeting on Powder Diffraction of the XV Congress of the IUCR, Toulouse, France, 1990 Search PubMed.
- APEXII Software Suite, Bruker AXS Inc., Madison, Wisconsin, USA, 2005 Search PubMed.
- G. M. Sheldrick, Acta Crystallogr., Sect. A: Found. Crystallogr., 2007, 64, 112–122 CrossRef PubMed.
- L. J. Farrugia, J. Appl. Crystallogr., 1999, 32, 837–838 CrossRef CAS.
- L. M. Gelato and E. Parthé, J. Appl. Crystallogr., 1987, 20, 139–143 CrossRef.
- G. Kresse and J. Furthmüller, Phys. Rev. B: Condens. Matter Mater. Phys., 1996, 54, 11169–11186 CrossRef CAS.
- G. Kresse and D. Joubert, Phys. Rev. B: Condens. Matter Mater. Phys., 1999, 59, 1758–1775 CrossRef CAS.
- P. Blöchl, Phys. Rev. B: Condens. Matter Mater. Phys., 1994, 50, 17953–17979 CrossRef.
- J. Perdew, K. Burke and M. Ernzerhof, Phys. Rev. Lett., 1996, 77, 3865–3868 CrossRef CAS PubMed.
- H. Monkhorst and J. Pack, Phys. Rev. B: Solid State, 1976, 13, 5188–5192 CrossRef.
- Pauling File Binary Edition, Version 1.0, Release 2002/1, ASM international, Materials Park, OH, USA, 2002 Search PubMed.
- Z. Malik, O. Sologub, G. Giester and P. Rogl, J. Solid State Chem., 2011, 184, 2840–2848 CrossRef CAS.
- M. V. Bulanova, P. N. Zheltov, K. A. Meleshevich, P. A. Saltykov and G. Effenberg, J. Alloys Compd., 2002, 345, 110–115 CrossRef CAS.
- P. Schobinger-Papamantellos and K. H. J. Buschow, J. Alloys Compd., 1993, 198, 47–50 CrossRef CAS.
- A. Wosylus, K. Meier, Y. Prots, W. Schnelle, H. Rosner, U. Schwarz and Y. Grin, Angew. Chem., 2010, 122, 9187–9191 CrossRef.
- A. Berche, P. Benigni, J. Rogez and M. C. Record, Thermochim. Acta, 2011, 523, 70–78 CrossRef CAS.
- I. Oshchapovsky, V. Pavlyuk, G. Dmytriv and A. Griffin, Acta Crystallogr., Sect. C: Cryst. Struct. Commun., 2012, 68, i37–i40 CAS.
- O. I. Bodak, Y. M. Kalychak and E. I. Gladyshevskii, Izv. Akad. Nauk SSSR, Neorg. Mater., 1974, 10, 450–455 CAS.
- O. I. Bodak, E. I. Gladyshevskii and Y. M. Kalychak, Tezizy Dokl. Vses. Konf. Kristallokhim. Intermet. Soeden, 1st edn, 1971 Search PubMed.
- N. M. Norlidah, G. Venturini, B. Malaman and E. Ressouche, J. Alloys Compd., 1998, 265, 77–80 CrossRef CAS.
- A. Grytsiv, D. Kaczorowski, A. Leithe-Jasper, P. Rogl, C. Godart, M. Potel and H. Noël, J. Solid State Chem., 2002, 163, 37–43 CrossRef CAS.
- L. Pauling and B. Kamb, Proc. Natl. Acad. Sci. U. S. A., 1986, 83, 3569–3571 CrossRef CAS.
- A. Grytsiv, A. Leithe-Jasper, H. Flandorfer, P. Rogl, K. Hiebl, C. Godart and T. Velikanova, J. Alloys Compd., 1998, 266, 7–12 CrossRef CAS.
- I. M. Opainich, Ph.D. Thesis (in Ukrainian), University of L'viv, 1996.
- C. P. Wang, X. Chen, X. J. Liu, F. S. Pan and K. Ishida, J. Alloys Compd., 2008, 458, 166–173 CrossRef CAS.
- P. Chiotti and J. T. Mason, Trans. Am. Inst. Min., Metall. Pet. Eng., 1965, 233, 786–795 CAS.
- I. Johnson and R. M. Yonco, Metall. Trans., 1970, 1, 905–910 CAS.
- K. D. Schotte and U. Schotte, Phys. Lett. A, 1975, 55, 38–40 CrossRef.
- C. D. Bredl, F. Steglich and K. D. Schotte, Z. Phys. B: Condens. Matter, 1978, 29, 327–340 CAS.
- L. Peyker, C. Gold, E.-W. Scheidt, W. Scherer, J. G. Donath, P. Gegenwart, F. Mayr, T. Unruh, V. Eyert, E. Bauer and H. Michor, J. Phys.: Condens. Matter, 2009, 21, 235604 CrossRef CAS PubMed.
Footnote |
| † Electronic supplementary information (ESI) available. See DOI: 10.1039/c5ra02789f |
| This journal is © The Royal Society of Chemistry 2015 |