 Open Access Article
Creative Commons Attribution 3.0 Unported Licence
Surface-modified spherical activated carbon materials for pre-combustion carbon dioxide capture
Nannan
Sun
ac,
Chenggong
Sun
*a,
Jingjing
Liu
a,
Hao
Liu
*a,
Colin E.
Snape
a,
Kaixi
Li
b,
Wei
Wei
c and
Yuhan
Sun
c
aFaculty of Engineering, University of Nottingham, University Park, Nottingham NG7 2RD, UK. E-mail: cheng-gong.sun@nottingham.ac.uk; Liu.Hao@nottingham.ac.uk
bKey Laboratory of Carbon Materials, Institute of Coal Chemistry, Chinese Academy of Sciences, Taiyuan 030001, PR China
cCAS Key Lab of Low-Carbon Conversion Science and Engineering, Shanghai Advanced Research Institute, Chinese Academy of Sciences, Shanghai 201203, PR China
First published on 2nd April 2015
Abstract
Surface modification of activated carbon beads via HNO3 oxidation and subsequent amination at elevated temperatures was investigated as a means to improve their performance for CO2 capture, and the effects of the resultant changes in porosity and surface chemistry on adsorption characteristics of the samples were studied. Characterisations conducted with elemental analysis, physical adsorption, X-ray photoelectron spectroscopy and scanning electron microscope demonstrate that both the porosity and surface chemistry of the carbon beads were tuned by the modification without any alteration of the integrity of the desirable spherical morphology. Adsorption evaluation with both thermogravimetric analysis and high pressure volumetric analysis under various conditions indicate that one of the modified samples had a high CO2 adsorption capacity (8.64 mmol g−1 at 20 bar and 30 °C) with fast adsorption/desorption kinetics, superior durability and good selectivity over N2 and H2. Both the unique spherical form (diameter = 1.2 ± 0.2 mm) and the superior adsorption performance render the modified carbon beads a promising candidate for CO2 capture especially in pre-combustion capture using pressure swing adsorption.
1. Introduction
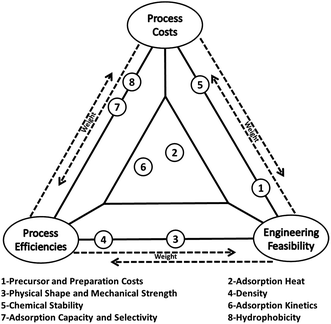
Various world energy outlooks suggest that in spite of the great efforts and heavy investments that have been made to improve energy efficiency and increase the share of renewable energy in primary energy supply, fossil fuels will continue to dominate the world primary energy supply for the coming decades.1–4 Consequently, significant contributions from carbon capture and storage (CCS) will be required to combat climate change to increase the opportunity for the continual use of fossil fuels.5–7 However, the current state-of-the-art aqueous amine scrubbing technology for CO2 capture is prohibitive for wide deployment due to its high operational costs and high energy penalty associated with absorbent regeneration.8,9 On the other hand, solid adsorbents looping technology (SALT) offers a viable alternative that has many advantages over solution-based technologies, including substantially reduced energy consumption, greatly minimised health, safety and environmental hazards and greater structural variability of the adsorbents that can be selected.Over recent years, a wide array of solid adsorbents have been used for CO2 capture, those including zeolites, carbon materials, inorganic oxides, amine modified silicates and more recently, the more niche metal–organic frameworks (MOFs) and covalent organic frameworks (COFs) materials.10–12 In previous investigations, a high adsorption capacity is the most pursued parameter among many others.10,11 In practical carbon capture applications however, the so-called “working capacity” should be more important as it concerns both material and engineering issues. Other challenges facing real carbon capture applications, such as the large volume of flue gas at high flow rate, complicated chemical compositions of the flue gas and fast capture rate that is required, should also be emphasized.13 Therefore, one needs to consider process costs, process efficiencies and engineering feasibilities for a real carbon capture process, and these criteria impose further requirements for applicable CO2 adsorbents as illustrated in Fig. 1. For example, the factor of adsorption/desorption kinetics (factor 6 in Fig. 1) is located on the left-bottom of the triangle in Fig. 1 because adsorbents with fast kinetics can increase the efficiencies of a capturing process and lowering related costs by accelerating the adsorption/desorption cycles for a given carbon capture facility. Meanwhile, faster cycling requires a better designed and integrated adsorption/desorption subunit, giving rise to further challenges in process engineering and limitations in adsorbents selection. The comprehensive requirements for CO2 adsorbents are also discussed in a recent review by Sayari et al.14
A screening of the possible adsorbents for CO2 capture indicates that carbon based adsorbents represent a good option to balance all the factors in Fig. 1 due to its promising properties such as low cost for preparation, chemical inertness, easy-to-regeneration, etc.10,11,14,15 As a result, the development of effective carbon-based adsorbent materials for CO2 capture has received significant attentions over recent years,15 related works including: (i) preparation of carbons by templating methods16,17 or direct carbonization of coal,18 polymers19,20 and biomass residuals;21–25 (ii) chemical activation of carbon by KOH21 and K2CO3;22,26 and (iii) modification of carbon by N doping,17,20,27 S doping28 and amine loading.29,30 More recently, some carbon materials with exceptionally high CO2 uptake were reported. For example, Srinivas et al.31 prepared MOF-derived porous carbons with CO2 adsorption capacities as high as 27.0 mmol g−1 at 27 °C and 30 bar. By carbonation and activation of selected coal tar pitches, a CO2 uptake of 20.5 mmol g−1 was obtained by Shao et al. at 25 °C and 18 bar.23 In addition to these results, Sjostrom et al.32 has reached the conclusion that carbon can be the viable adsorbents for practical CO2 capture especially if their CO2 uptake can be improved, which emphasized again that carbon-based materials have great potential in CO2 capture, particularly for pre-combustion capture where the CO2 partial pressure in the gas stream is much higher than in post-combustion flue gases.
Although many carbon-based adsorbents currently under development have superior adsorption capacity, they are produced predominantly in low-density powder form which is unsuitable for practical applications and therefore needs to be further fabricated via pelletisation or granulation process with the aid of binders or additives, which can often lead to significant loss of their adsorption performance.33–38 To address this issue, some researchers tried to prepare carbon monolith/honeycomb adsorbents using purpose-designed molding processes,20,39,40 however these methodologies often involves the use of complicated processes, and the fabricated materials, mostly in their cylindrical and/or rod shapes, are not particularly suitable for use in SALT processes (e.g. circulating fluidized bed) due to serious attrition problems that may arise from the undesirable material morphology.
In our previous work, a cost-effective and easy-to-scale-up hydrothermal technique has successfully been developed to produce spherical active carbon materials from a variety of polymeric precursors. The prepared porous carbon beads possess the most favourable properties for applications in continuous CO2 capture using circulating fluidised bed, such as their tuned porosity, high mechanical strength and desirable spherical forms with uniform diameters.41 In this paper, different post-treatments, including HNO3 oxidation and amination were investigated as an effective means to further improve the CO2 adsorption performance of the carbon beads, the adsorption behaviour of the samples was rationalized based on extensive characterization tests, and their application potential in CO2 capture was evaluated based on the analysis of adsorption capacity, selectivity, kinetics and reusability.
2. Experimental
2.1 Preparation of the original carbon beads
The parent carbon beads were prepared from phenolic resins using a novel hydrothermal process. Typically, novolac-type phenolic resins were first dissolved in a formulated solvent to form a solution which was later mixed with aqueous polyvinyl alcohol (PVA) and sealed in an autoclave. The mixture was then heated to 130 °C at a rate of 5 °C min−1 and held at this temperature for 1 h with rigorous stirring (400 rpm). The autoclave reactor was then cooled down to ambient temperature to allow the formed resin beads to be recovered. The resin beads was first washed adequately with distilled water and dried at 110 °C for 24 h before it was carbonised in N2 at 800 °C for 1 h to yield the carbon beads (sample AC, hereafter) for further treatments.2.2 Surface modification of sample AC
The AC sample was further submitted to HNO3 oxidation by mixing 10 g of AC and 250 mL of concentrated HNO3 in a beaker at room temperature (25 °C) for 1 h (sample oxAC), after washing and drying, the obtained oxAC was aminated in a tube furnace under NH3 at 300, 600 and 800 °C to afford sample oxAC-300NH3, oxAC-600NH3 and oxAC-800NH3, respectively. For comparison, a sample thermally treated at 800 °C in N2 after HNO3 oxidation was also prepared (oxAC-800N2).2.3 Characterization
Textural properties of the samples were measured by N2 physisorption on an Micromeritics ASAP 2420 instrument at −196 °C and CO2 at 0 °C. Prior to any measurements, all samples were first degassed at 120 °C overnight. The apparent surface area (SBET) was calculated according to the method suggested by Parra et al.42 The cumulative pore volumes (Vtotal) were calculated from the amount of nitrogen adsorbed at P/P0 of ca. 0.99, and the average pore diameter (Davg) was calculated by 4Vtotal/SABET. The micropore volume (Vmicro) and surface area (SAmicro) were determined by the t-plot method. Narrow micropore volumes (W0) of the samples were calculated by the Dubinin–Radushkevich (DR) method43 from CO2 isotherms obtained at 0 °C. In theory, the DR method allows the calculation of average width of the narrow micropores (L0) based on the empirical relationship between L0 and the characteristic adsorption potential (E0) in the DR equation.44 However, it was reported that this relationship is influenced by the surface chemistry of samples.45 Therefore, L0 was not calculated here due to the significant differences in the surface properties of the samples.X-Ray photoelectron spectroscopy (XPS) was carried out using a Kratos AXIS ULTRA instrument with an Al Kα source (energy 1486.6 eV). The high resolution scans were charge corrected to the main C1s peak (284.8 eV). Morphology of the samples was examined with a QUANTA 600 scanning electron microscope (SEM) instrument. An elemental analyser (Thermo EA1112 series) was used to determine the carbon, hydrogen, and nitrogen contents of the samples.
2.4 Evaluation of the CO2 adsorption performance
The CO2 capture behaviors of the samples were measured by a TA Q500 thermal gravimetric analyser (TGA) under ambient pressure. In brief, 20–30 mg of the samples were loaded in a platinum pan, heated to 115 °C and held at this temperature in flowing N2 (100 mL min−1) for 10 min to remove any physisorbed moisture and/or CO2, and the temperature was then decreased (10 °C min−1) to and equilibrated at 30 °C. To start the adsorption tests, the gas flow was switched to 100 mL min−1 of pure CO2 or 15 vol% CO2 in N2 to perform CO2 adsorption tests and the temperature was held at 30 °C for 30 min in order for the adsorption to reach equilibrium. The samples were then heated to 115 °C at a ramp rate of 0.5 °C min−1. The use of such a slow ramp allows the adsorption to change with temperature in a quasi-equilibrium state and the mass change recorded can be used to assess the influence of temperature on CO2 adsorption capacity. Reversibility of CO2 adsorption/desorption was previously checked to make sure the as-obtained data is valid.High pressure CO2 adsorption tests were carried out with a High Pressure Volumetric Analyser (Particulate Systems HPVA-100). Prior to any tests, the sample was first degassed in vacuum at 120 °C overnight to remove any physisorbed moisture and/or CO2.
3. Results and discussion
3.1 Characterization
| Elemental analysis | XPS | |||||||||||
|---|---|---|---|---|---|---|---|---|---|---|---|---|
| Ca | Ha | Na | Oa | H/Nb | N/Cb | O/Cb | Ca | Na | Oa | N/Cb | O/Cb | |
| a Weight percentage in wt%. b Mass ratio, a.u. | ||||||||||||
| AC | 93.6 | 0.52 | 0.00 | 5.84 | 0.006 | 0.000 | 0.062 | — | — | — | — | — |
| oxAC | 68.6 | 1.91 | 1.85 | 27.7 | 0.028 | 0.027 | 0.404 | 87.0 | 1.74 | 11.3 | 0.023 | 0.173 |
| oxAC-300NH3 | 74.7 | 2.11 | 1.44 | 21.8 | 0.028 | 0.019 | 0.291 | 90.0 | 2.03 | 8.34 | 0.026 | 0.124 |
| oxAC-600NH3 | 82.5 | 1.34 | 1.13 | 15.0 | 0.016 | 0.014 | 0.181 | 91.8 | 1.64 | 6.53 | 0.021 | 0.095 |
| oxAC-800NH3 | 83.0 | 0.87 | 1.37 | 14.7 | 0.010 | 0.017 | 0.178 | 91.3 | 1.98 | 6.75 | 0.025 | 0.099 |
| oxAC-800N2 | 88.8 | 0.90 | 0.42 | 9.90 | 0.010 | 0.005 | 0.112 | — | — | — | — | — |
| SABET (m2 g−1) | V total (cm3 g−1) | D avg (nm) | Microporosity | |||
|---|---|---|---|---|---|---|
| SAmicroa (m2 g−1) | V micro a (cm3 g−1) | W 0 b (cm3 g−1) | ||||
| a Calculated by t-plot method. b Calculated from CO2 adsorption at 0 °C by applying DR method. | ||||||
| AC | 972 | 0.45 | 1.84 | 907 | 0.36 | 0.238 |
| oxAC | 788 | 0.39 | 1.99 | 707 | 0.28 | 0.245 |
| oxAC-300NH3 | 936 | 0.41 | 1.77 | 891 | 0.35 | 0.277 |
| oxAC-600NH3 | 1020 | 0.45 | 1.75 | 974 | 0.38 | 0.262 |
| oxAC-800NH3 | 1106 | 0.49 | 1.76 | 1052 | 0.41 | 0.237 |
| oxAC-800N2 | 1058 | 0.47 | 1.76 | 1009 | 0.40 | 0.247 |
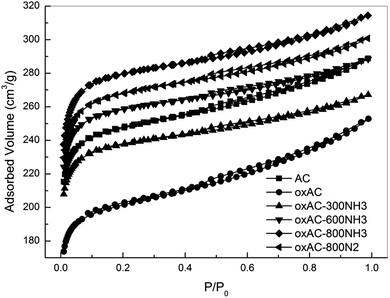
As shown in Table 2, the parent carbon beads (sample AC) have a moderate surface area (SABET) of 972 m2 g−1 with a total pore volume (Vtotal) of 0.45 cm3 g−1. After HNO3 oxidation, the SABET and Vtotal of oxAC decreased with slightly increased average pore diameter (Davg). Upon removal of the generated oxygen-containing groups by thermal treatment in N2, a significant improvement in porosity can be observed for oxAC-800N2, which has a surface area comparable to that of the parent sample AC. It has been frequently reported that HNO3 oxidation can reduce the porosity of carbon materials,47,48 due to either the blockage of micropores by the formed oxygen-containing functionalities or partial destruction of the carbon framework by damaging the basal planes.49 Although pore blockage cannot be ruled out based on the present data, the high microporosity of the oxAC-800N2 convinced us that extra micropores, which could be recovered by the removal of oxygen-containing functionalities during thermal treatment, were formed via the penetration of the carbon framework by the oxidant. As shown in Table 2, both oxAC and oxAC-800N2 exhibit W0 values similar to that of the parent sample AC of ca. 0.24 cm3 g−1, suggesting that the influence of HNO3 treatment on the narrow micropores is small. This can be expected, given the difficulty for the oxidant to enter these narrow micropores as a result of the high surface tension of the aqueous solution and the hydrophobic nature of the carbon surface.
A substantial increase in microporosity was observed for the 300 °C aminated sample (oxAC-300NH3). It is interesting to note that while the total micropore volume of the oxAC300NH3 increased by over 20% as compared with oxAC (from 0.28 to 0.35 cm3 g−1), the total pore volume of this sample remained relatively unchanged (0.41 versus 0.39 cm3 g−1). This implies that the mesopores in the sample oxAC diminished due to pore narrowing during the amination, which might be trigged by the reactions of NH3 with the oxygenate groups.50–52 Similar assumption can be applied to explain the increase of W0 for this sample because carbon activation by NH3 becomes less effective under temperatures as low as 300 °C. With increasing the amination temperature from 300 to 800 °C, further activation/surface modification of the carbon beads can be achieved, which imposed a range of changes on the porosity of the samples such as formation of new narrow-micropores, widening/blocking of the existing wide- and narrow-micropores, etc.18,27 These synergetic effects led to a gradual increase in Smicro/Vmicro and a decrease in W0. Consequently, both the SABET and Vtotal increased for the oxAC-600NH3 and oxAC-800NH3 samples. It seems that the increase was most likely induced by the enhancement of wide-microporosity as indicated by the similar increasing of Vtotal and Vmicro. Similar results, namely the increased wide-microporosity during enhanced activation, were also observed by An et al. during their attempts to carbonise activated carbon fibre-phenolic resin composites.39
Fig. 4 presents the N1s spectra and the peak fitting results of the N-containing samples, for the sample oxAC, peaks at 399.4, 401.0, and 406.0 eV can be attributed to pyridinic, quaternary and nitro-nitrogen according to the NIST XPS Database. After amination, a new peak was detected at 400.0 eV, which is attributable to pyrrolic and/or pyridone nitrogen. Although these two functionalities cannot be effectively differentiated by XPS, it was reported that pyridone nitrogen is more stable than pyrrolic nitrogen at elevated temperatures,55 therefore pyridone has a higher opportunity to survive on the aminated samples. Among the identified groups, pyridinic nitrogen has lone pair of electrons, which may enhance the alkaline character of the surface, and thus would facilitate the adsorption of acidic CO2. As for the pyridone nitrogen, Fan et al. has reported that the p–π conjugation between the –OH and the aromatic rings endows the ortho-N with a higher electron density, which can lead to higher affinity for CO2 adsorption.26 It is noteworthy that the delocalization and conjugation effects from electrons of nitrogen, aromatic rings and other atoms have a significant impact on the basicity of nitrogen-containing groups, therefore it is arbitrary to allege the relative importance of these groups in terms of their affinity to acid gases such as CO2.56,57 For the quaternary and nitro-nitrogen on the other hand, they are partially positive charged due to the adjacent oxygen and aromatic rings, therefore it is reasonable to assume a limited contribution for these functionalities to the adsorption of CO2.
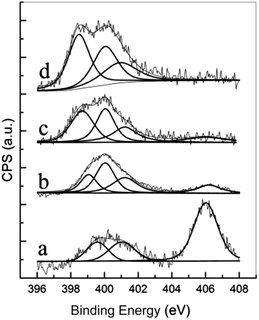 | ||
| Fig. 4 XPS spectra of the oxidized and aminated samples (a) oxAC, (b) oxAC-300NH3, (c) oxAC-600NH3, (d) oxAC-800NH3. | ||
The relative fractions of the identified nitrogen functionalities are tabulated in Table 3. It can be observed that with the increase of amination temperature, the fraction of nitro-nitrogen decreased notably due to the removal and/or reduction of these functionalities, while the relative abundance of pyridone and quaternary nitrogen were less affected due to their higher thermal stability as compared with nitro-nitrogens. A higher fraction of pyridinic nitrogen can be seen for the samples aminated at higher temperatures, which is indicative of the enhanced surface amination by the formed N-radicals and further cleavage of the N–H bonds at higher temperatures as has been discussed in Section 3.1.1.
| Samples | Fractions (%) | |||
|---|---|---|---|---|
| Pyridine | Pyridone | Quaternary | –NO2 | |
| oxAC | 16.4 | — | 20.4 | 63.2 |
| oxAC-300NH3 | 20.8 | 37.0 | 27.1 | 15.1 |
| oxAC-600NH3 | 33.8 | 31.0 | 22.4 | 12.9 |
| oxAC-800NH3 | 42.5 | 32.4 | 25.1 | — |
3.2 CO2 adsorption behaviour
![[double bond, length as m-dash]](https://www.rsc.org/images/entities/char_e001.gif) N–C. At a CO2 partial pressure of 1 bar, the CO2 uptake of all the aminated samples were higher than that of oxAC, suggesting the greater importance of textural properties on adsorption capacity. The sample oxAC-300NH3 showed the highest uptake (2.57 mmol g−1), most probably due to its highest narrow micropore volume (W0). It has been reported that at atmospheric pressure, only pores with diameters lower than 5 times of the molecular size of the adsorbate are effective for gas adsorption.18 As for CO2, the dynamic molecular diameter is 0.209 nm, it is therefore expected that the narrow micropores are the major locations that accommodate CO2 at 1 bar.39 The combinative effect of surface chemistry and textural properties on CO2 adsorption of surface-modified carbon materials has been well-demonstrated in open literatures,41,54 and it is believed that the surface chemistry, rather than the textural properties, governs the CO2 capture performance at lower (partial) pressures, while the textural properties becomes more important at higher CO2 pressures as the adsorption process becomes controlled by the micropore filling mechanism.
N–C. At a CO2 partial pressure of 1 bar, the CO2 uptake of all the aminated samples were higher than that of oxAC, suggesting the greater importance of textural properties on adsorption capacity. The sample oxAC-300NH3 showed the highest uptake (2.57 mmol g−1), most probably due to its highest narrow micropore volume (W0). It has been reported that at atmospheric pressure, only pores with diameters lower than 5 times of the molecular size of the adsorbate are effective for gas adsorption.18 As for CO2, the dynamic molecular diameter is 0.209 nm, it is therefore expected that the narrow micropores are the major locations that accommodate CO2 at 1 bar.39 The combinative effect of surface chemistry and textural properties on CO2 adsorption of surface-modified carbon materials has been well-demonstrated in open literatures,41,54 and it is believed that the surface chemistry, rather than the textural properties, governs the CO2 capture performance at lower (partial) pressures, while the textural properties becomes more important at higher CO2 pressures as the adsorption process becomes controlled by the micropore filling mechanism.
| Sample | 15 vol% CO2 (mmol g−1) | 100 vol% CO2 (mmol g−1) | ||
|---|---|---|---|---|
| 30 °C | 45 °C | 30 °C | 45 °C | |
| AC | 0.73 | 0.48 | 2.36 | 1.71 |
| oxAC | 0.91 | 0.59 | 2.34 | 1.72 |
| oxAC-300NH3 | 0.85 | 0.56 | 2.57 | 1.90 |
| oxAC-600NH3 | 0.76 | 0.50 | 2.44 | 1.78 |
| oxAC-800NH3 | 0.74 | 0.49 | 2.42 | 1.75 |
| oxAC-800N2 | 0.73 | 0.48 | 2.39 | 1.74 |
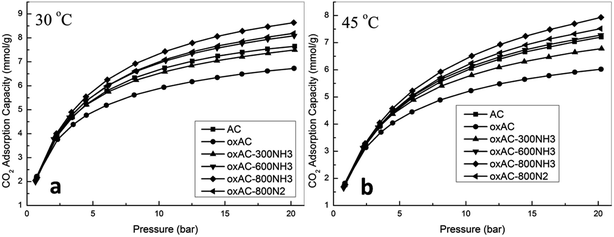
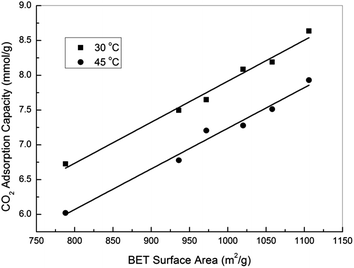
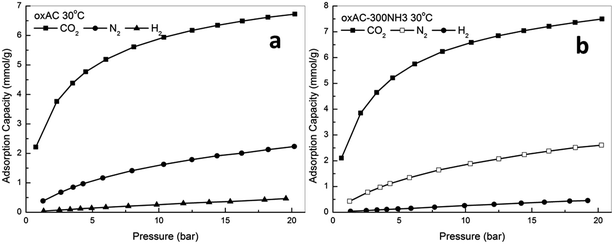
In fact, activated carbons in general are well known for their capability to achieve higher adsorption capacities at pressures higher than atmospheric, and this together with their moderate adsorption strength makes them the ideal adsorbents for CO2 capture at high pressures (such as pre-combustion capture).21,23,31 In this study, the high pressure CO2 adsorption performance of the samples was measured using a high pressure volumetric method, and the obtained isotherms are presented in Fig. 5. Note that all the reported high pressure adsorption capacities are absolute loadings, calculated from the experimentally obtained excess loadings and Vtotal by using Peng–Robinson equation of state as suggested by Myers and Wang.60,61 For all the samples, CO2 uptake increased with the increasing of pressure, and the highest uptakes of 8.64 and 7.93 mmol g−1 were achieved over sample oxAC-800NH3 at 30 and 45 °C, respectively. These high uptakes together with the unique spherical form and good mechanical strength make the current carbon beads a promising option for CO2 capture applications. Fig. 6 illustrates the adsorption capacities at a pressure of 20.2 bar as a function of the BET surface areas of the samples, and the obtained good linear relationship highlighted the vital importance of the above mentioned pore filling mechanism where textural properties are expected to be the key driver of CO2 uptake at elevated pressures.
Table 5 presented a comparison of the CO2 adsorption capacity of the carbon beads with those phenolic resin-derived carbons reported in the literature. It can be seen that the adsorption capacity of samples reported here is only slightly lower than those non-KOH activated carbon adsorbents in a powder form. Together with the uniform spherical form, we thus believe these carbon beads may represent a potential option for practical CO2 capture. We are currently working on the effect of KOH activation on the adsorption performance as well as the morphological integrity of the carbon beads.
To examine the effectiveness of the carbon beads as an adsorbent for pre-combustion CO2 capture by pressure swing adsorption, the working capacity of the carbon adsorbents, which is defined as the difference in equilibrium capacities at given adsorption and desorption pressures (in the present case, 20 and 2 bar for adsorption and desorption, respectively), were obtained as shown in Table 6. Of all the samples examined, the sample oxAC-800NH3 showed the highest working capacity of 4.94 mmol g−1, which is nearly 20% higher than that of the parent AC. It is also interesting to highlight that the working capacities of all the carbon beads at 45 °C are slightly higher than those achieved at 30 °C, this is a phenomenon that has rarely been reported in previous studies on activated carbons, but is fairly meaningful because carbon-based materials are normally regarded as a highly temperature-sensitive adsorbents that rapidly lost their capacities with increasing temperatures, and thus the current observations are persuasive to demonstrate the feasibility of using the current carbon-based materials for pre-combustion CO2 capture by pressure swing adsorption.
4. Conclusion
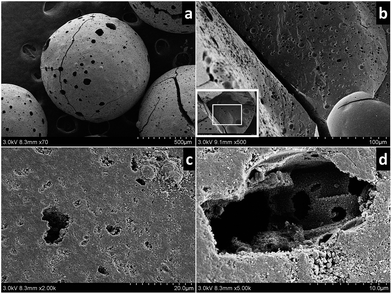
The effectiveness of using surface amination treatments as a means to improve the CO2 capture performance of carbon beads produced from a novel cost-effective hydrothermal process has been investigated. It was found that the surface modifications hardly compromised the desirable spherical morphology and mechanical strength of the activated carbon beads while their adsorption performance for CO2 was enhanced. In specific, HNO3 oxidation and low temperature amination with NH3 appear to be significantly more effective in improving the low pressure CO2 adsorption performance of the carbon beads, while the modification with NH3 at high temperatures was found instead to be more effective to boost their capture capacity at high pressures. Comprehensive characterisations demonstrate that the CO2 uptake capacity of the carbons at low CO2 partial pressures was more related to their surface chemistry and narrow micropores, while the high pressure adsorption capacity was found to have a linear relationship with the BET surface areas, indicating a pore-filling dominated adsorption mechanism. The highest working capacity of ca. 4.9 mmol g−1 was achieved for the sample oxAC-800NH3 and little variation was observed with the adsorption temperatures examined in this investigation. The results demonstrate the great potential of the spherical carbon beads as CO2 adsorbents particularly suitable for pre-combustion capture by pressure swing adsorption systems.Acknowledgements
The authors wish to acknowledge the financial support of the UK EPSRC Grants (EP/I010955/1, EP/G063176/1), and the National Natural Science Foundation of China (51061130536, 51172251).References
- IEA, World energy outlook 2012, OECD/IEA, France, 2012 Search PubMed.
- IEA, World energy outlook 2013, OECD/IEA, France, 2013 Search PubMed.
- ExxonMobil, The outlook for energy: A view to 2040, USA, 2013 Search PubMed.
- BP, BP energy outlook 2013, UK, 2013 Search PubMed.
- Climate change, The scientific basis, Contribution of working group I to the third assessment report of the intergovernmental panel on climate change, Cambridge University Press, Cambridge (United Kingdom) and New York (NY, USA), 2001 Search PubMed.
- L. Christian, Science, 2010, 330, 595–596 CrossRef PubMed.
- M. O. Franklin, Energy Environ. Sci., 2009, 2, 449–458 Search PubMed.
- T. R. Gary, Science, 2009, 325, 1652–1654 CrossRef PubMed.
- M. E. Boot-Handford, J. C. Abanades, E. J. Anthony, M. J. Blunt, S. Brandani, N. Mac Dowell, J. R. Fernandez, M. C. Ferrari, R. Gross, J. P. Hallett, R. S. Haszeldine, P. Heptonstall, A. Lyngfelt, Z. Makuch, E. Mangano, R. T. J. Porter, M. Pourkashanian, G. T. Rochelle, N. Shah, J. G. Yao and P. S. Fennell, Energy Environ. Sci., 2014, 7, 130–189 CAS.
- S. Choi, J. H. Drese and C. W. Jones, ChemSusChem, 2009, 2, 796–854 CrossRef CAS PubMed.
- Q. Wang, J. Luo, Z. Zhong and A. Borgna, Energy Environ. Sci., 2011, 4, 42–55 CAS.
- S. Wang, S. Yan, X. Ma and J. Gong, Energy Environ. Sci., 2011, 4, 3805–3819 CAS.
- P. Markewitz, W. Kuckshinrichs, W. Leitner, J. Linssen, P. Zapp, R. Bongartz, A. Schreiber and T. E. Mueller, Energy Environ. Sci., 2012, 5, 7281–7305 CAS.
- A. Sayari, Y. Belmabkhout and R. Serna-Guerrero, Chem. Eng. J., 2011, 171, 760–774 CrossRef CAS PubMed.
- S. S. Mohammad, W. M. A. W. Daud, A. Houshmand and A. Shamiri, J. Anal. Appl. Pyrolysis, 2010, 89, 143–151 CrossRef PubMed.
- S.-Y. Lee, D. Jang, S.-T. Bae and S.-J. Park, Int. J. Hydrogen Energy, 2014, 39, 12347–12352 CrossRef CAS PubMed.
- Y. Xia, R. Mokaya, G. S. Walker and Y. Zhu, Adv. Energy Mater., 2011, 1, 678–783 CrossRef CAS PubMed.
- M. M. Maroto-Valer, Z. Tang and Y. Zhang, Fuel Process. Technol., 2005, 86, 1487–1502 CrossRef CAS PubMed.
- J. Ludwinowicz and M. Jaroniec, Carbon, 2015, 82, 297–303 CrossRef CAS PubMed.
- G. P. Hao, C. W. Li, D. Qian and A. H. Lu, Adv. Mater., 2010, 22, 853–857 CrossRef CAS PubMed.
- L. K. C. De Souza, N. P. Wickramaratne, A. S. Ello, M. J. F. Costa, C. E. F. Da Costa and M. Jaroniec, Carbon, 2013, 65, 334–340 CrossRef CAS PubMed.
- T. C. Drage, A. Arenillas, K. M. Smith, C. Pevida, S. Piippo and C. E. Snape, Fuel, 2007, 86, 22–31 CrossRef CAS PubMed.
- X. Shao, Z. Feng, R. Xue, C. Ma, W. Wang, X. Peng and D. P. Cao, AIChE J., 2011, 57, 3042–3051 CrossRef CAS PubMed.
- G. K. Parshetti, S. Chowdhury and R. Balasubramanian, Fuel, 2015, 148, 246–254 CrossRef CAS PubMed.
- X. Zhang, S. Zhang, H. Yang, Y. Feng, Y. Chen, X. Wang and H. Chen, Chem. Eng. J., 2014, 257, 20–27 CrossRef CAS PubMed.
- X. Fan, L. Zhang, G. Zhang, Z. Shu and J. Shi, Carbon, 2013, 61, 423–430 CrossRef CAS PubMed.
- S. M. Mahurin, J. Górka, K. M. Nelson, R. T. Mayes and S. Dai, Carbon, 2014, 67, 457–464 CrossRef CAS PubMed.
- H. Seema, K. C. Kemp, N. H. Le, S. W. Park, V. Chandra, J. W. Lee and K. S. Kim, Carbon, 2014, 66, 320–326 CrossRef CAS PubMed.
- L. Zhao, Z. Bacsik, N. Hedin, W. Wei, Y. H. Sun, M. Antonietti and M. M. Titirici, ChemSusChem, 2010, 3, 840–845 CrossRef CAS PubMed.
- M. L. Gray, Y. Soong, K. J. Champagne, J. Baltrus, R. W. Stevens, P. Toochinda and S. S. C. Chuang, Sep. Purif. Technol., 2004, 35, 31–36 CrossRef CAS.
- G. Srinivas, V. Krungleviciute, Z. Guo and T. Yildirim, Energy Environ. Sci., 2014, 7, 335–342 CAS.
- S. Sjostrom and H. Krutka, Fuel, 2010, 89, 1298–1306 CrossRef CAS PubMed.
- M. E. Davis, Nature, 2002, 417, 813–821 CrossRef CAS PubMed.
- G. P. Hao, W. C. Li, D. Qian, G. H. Wang, W. P. Zhang, T. Zhang, A. Q. Wang, F. Schuth, H. J. Bongard and A. H. Lu, J. Am. Chem. Soc., 2011, 133, 11378–11388 CrossRef CAS PubMed.
- M. R. Lohe, M. Rose and S. Kaskel, Chem. Commun., 2009, 40, 6056–6058 RSC.
- A. E. Kadib, R. Chimenton, A. Sachse, F. Fajula, A. Galarneau and B. Coq, Angew. Chem., Int. Ed., 2009, 48, 4969–4972 CrossRef PubMed.
- J. L. Williams, Catal. Today, 2001, 69, 3–9 CrossRef CAS.
- J. J. Wen, F. N. Gu, F. Wei, Y. Zhou, W. G. Lin, J. Yang, J. Y. Yang, Y. Wang, Z. G. Zou and J. H. Zhu, J. Mater. Chem., 2010, 20, 2840–2846 RSC.
- H. An, B. Feng and S. Su, Carbon, 2009, 47, 2396–2405 CrossRef CAS PubMed.
- Y. Jin, S. C. Hawkins, C. P. Huynh and S. Su, Energy Environ. Sci., 2013, 6, 2591–2596 CAS.
- N. N. Sun, C. G. Sun, H. Liu, J. J. Liu, L. Stevens, T. Drage, C. E. Snape, K. X. Li, W. Wei and Y. H. Sun, Fuel, 2013, 113, 854–862 CrossRef CAS PubMed.
- J. B. Parra, J. C. Sousa, R. C. Bansal, J. J. Pis and J. A. Pajares, Adsorpt. Sci. Technol., 1995, 12, 51–66 CAS.
- M. M. Dubinin, Chemistry and physics of carbon, Marcel Dekker Inc., USA, 1966 Search PubMed.
- F. Stoeckli and L. Ballerini, Fuel, 1991, 70, 557–559 CrossRef CAS.
- R. Ghosal and D. M. Smith, J. Porous Mater., 1996, 3, 247–255 CrossRef CAS.
- J. W. Shim, S. J. Park and S. K. Ryu, Carbon, 2001, 39, 1635–1642 CrossRef CAS.
- K. S. W. Sing, D. H. Everett, R. A. W. Haul, L. Moscou, R. A. Pierotti, J. Rouquerol and T. Siemieniewska, Pure Appl. Chem., 1985, 57, 603–619 CrossRef CAS.
- P. Chingombe, B. Saha and R. J. Wakeman, Carbon, 2005, 43, 3132–3143 CrossRef CAS PubMed.
- P. Vinke, M. Van Der Eijk, M. Verbree, A. F. Voskamp and H. Van Bekkum, Carbon, 1994, 32, 675–686 CrossRef CAS.
- C. Pevida, M. G. Plaza, B. Arias, J. Fermoso, F. Rubiera and J. J. Pis, Appl. Surf. Sci., 2008, 254, 7165–7172 CrossRef CAS PubMed.
- B. Stöhr and H. P. Boehm, Carbon, 1991, 29, 707–720 CrossRef.
- H. P. Boehm, G. Mair, T. Stoehr, A. R. De Rincon and B. Tereczki, Fuel, 1984, 63, 1061–1063 CrossRef CAS.
- S. Araki, H. Doi, Y. Sano, S. Tanaka and Y. Miyake, J. Colloid Interface Sci., 2009, 339, 382–389 CrossRef CAS PubMed.
- A. Arenillas, T. C. Drage, K. Smith and C. E. Snape, J. Anal. Appl. Pyrolysis, 2005, 74, 298–306 CrossRef CAS PubMed.
- A. W. Marek, J. R. Pels and J. A. Moulijn, Fuel, 1995, 74, 507–516 CrossRef.
- G. Sethia and A. Sayari, Energy Fuels, 2014, 28, 2727–2731 CrossRef CAS.
- A. Zukal, I. Dominguez, J. Mayerová and J. Čejka, Langmuir, 2009, 25, 10314–10321 CrossRef CAS PubMed.
- Z. Xiang, S. Leng and D. Cao, J. Phys. Chem. C, 2012, 116, 10573–10579 CAS.
- F. Karadas, M. Atilhan and S. Aparicio, Energy Fuels, 2010, 24, 5817–5828 CrossRef CAS.
- A. L. Myers and P. A. Monson, Langmuir, 2002, 18, 10261–10273 CrossRef CAS.
- J. Wang, A. Heerwig, M. R. Lohe, M. Oschatz, L. Borchardt and S. Kaskel, J. Mater. Chem., 2012, 22, 13911–13913 RSC.
- C. F. Martin, M. G. Plaza, S. Garcia, J. J. Pis, F. Rubiera and C. Pevida, Fuel, 2011, 90, 2064–2072 CrossRef CAS PubMed.
- L. Liu, Q. F. Deng, T. Y. Ma, X. Z. Lin, X. X. Hou, Y. P. Liu and Z. Y. Yuan, J. Mater. Chem., 2011, 21, 16001–16009 RSC.
- J. Choma, K. Jedynak, W. Fahrenholz, J. Ludwinowicz and M. Jaroniec, Appl. Surf. Sci., 2014, 289, 592–600 CrossRef CAS PubMed.
- M. G. Plaza, K. J. Thurecht, C. Pevida, F. Rubiera, J. J. Pis, C. E. Snape and T. C. Drage, Fuel Process. Technol., 2013, 110, 53–60 CrossRef CAS PubMed.
- J. Wei, D. Zhou, Z. Sun, Y. Deng, Y. Xia and D. Zhao, Adv. Funct. Mater., 2013, 23, 2322–2328 CrossRef CAS PubMed.
- N. P. Wickramaratne and M. Jaroniec, J. Mater. Chem. A, 2013, 1, 112–116 CAS.
| This journal is © The Royal Society of Chemistry 2015 |

