Bao Zhang,
Hui Li and
Jia-feng Zhang*
School of Metallurgy and Environment, Central South University, Changsha, Hunan 410083, China. E-mail: csuzjf@vip.163.com; Tel: +86-731-88877248
First published on 31st March 2015
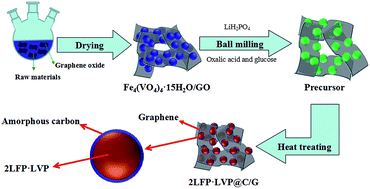
2LiFePO4·Li3V2(PO4)3@carbon/graphene (2LFP·LVP@C/G) as a cathode material, based on an in situ grown Fe4(VO4)4·15H2O precursor on the surface of graphene oxide, was synthesized by a solid-state process. The X-ray diffraction Rietveld refinement and Raman spectroscopy results indicated that multi-phase structural 2LiFePO4·Li3V2(PO4)3 with a carbon/graphene coating was obtained. The morphology is characterized by HRTEM tests, which reveal well crystallized 2LFP·LVP@C/G with bridging graphene nanosheets, forming an effective three-dimensional conducting network. Compared with 2LiFePO4·Li3V2(PO4)3@carbon (2LFP·LVP@C), the electrochemical results demonstrate that the 2LFP·LVP@C/G electrode measured at 0.1 C and 10 C can deliver a high specific discharge capacity of 151.2 mA h g−1 and 125.4 mA h g−1, respectively, and has a discharge capacity of 100.2 mA h g−1 at −30 °C at 0.1 C, indicating better rate capability and thermal properties.
Recently, graphene, with one-atom thick layer in 2D structure,38 has been implemented as a new and promising electron conducting additive for cathode materials of LIBs. Graphene can offer an improved interfacial contact because of its superior conductivity, flexible structure, especially, high surface area (2630 m2 g−1 of theoretical value),39 which can form a 2D electron conducting network in cathode materials to increase electron conductivity.40 Ding et al. reported LiFePO4/graphene composites prepared through a co-precipitation method,41 and Zhou et al. synthesized graphene modified LiFePO4 composites with excellent electrochemical properties by spray-drying and annealing processes.42 Liu et al. prepared Li3V2(PO4)3/graphene composite with a high specific discharge capacity of 82 mA h g−1 at 50 C rate in the potential range of 3.0–4.3 V.43
However, the interfacial interaction between cathode materials and graphene is inefficiency and graphene was difficult to be uniformly dispersed, which is led to quite limitation about the enhancement in electrical conductivity. Consequently, it remains necessary to develop an approach to construct effective graphene networks for fully utilizing its potential properties.
In this paper, a novel in situ growing Fe4(VO4)4·15H2O precursor on the surface of graphite oxide are developed to a novel 3D hierarchical 2LiFePO4·Li3V2(PO4)3@carbon/graphene (2LFP·LVP@C/G) composite cathode in situ for the first time. The composite showed enhanced electrochemical performance as cathode material for Li-ion battery compared with 2LiFePO4·Li3V2(PO4)3@C (2LFP·LVP@C).
V4O124− + 4Fe3+ + 8OH− + 15H2O + GO → Fe4(VO4)4·15H2O/GO |
The 2LFP·LVP@C/G was prepared by mixing stoichiometric amounts of as-prepared Fe4(VO4)4·15H2O/GO, LiH2PO4, oxalic acid and glucose in ethanol medium under high-energy ball milling for 5 h. The as-obtained powders were sintered in a horizontal quartz tube at 700 °C for 18 h under a 5:
95 hydrogen–argon atmosphere, then the 2LFP·LVP@C/G composites were finally obtained. The synthesis process for the 2LFP·LVP/G composites is schematically illustrated in Fig. 1. Meanwhile, the material 2LFP·LVP@C was prepared via the same process without using graphene oxide as precursor for comparison.
Structural and crystalline phase analyses of the products were taken from the powder X-ray diffraction (XRD, Rint-2000, Rigaku) using Cu Kα. Residual carbon content in both samples was determined by a carbon sulfur analyzer (CS600, LECO, US). The samples were observed by SEM (JEOL, JSM-5600LV) and a Tecnai G12 transmission electron microscope (TEM). Thermogravimetric (TG) analysis of the precursor was measured on a SDT Q600 TG-DTA apparatus at the temperature between 25 °C and 800 °C with a heating rate of 10 °C min−1 under air flow. Raman scattering (RS) spectra were recorded on a HORIBA Scientific LabRAM HR Raman spectrometer system.
The electrochemical characterizations were performed using CR2025 coin-type cell. Typical positive electrode loadings were in the range of 2–2.5 mg cm−2, and an electrode diameter of 14 mm was used. For positive electrode fabrication, the prepared powders were mixed with 10% of carbon black and 10% of polyvinylidene fluoride in N-methyl pyrrolidinone until slurry was obtained. And then, the blended slurries were pasted onto an aluminum current collector, and the electrode was dried at 120 °C for 12 h in the air. The test cell consisted of the positive electrode and lithium foil negative electrode separated by a porous polypropylene film, and 1.0 mol L−1 (0.9LiBF4–0.1LiBOB) in PC–EC–EMC (1:
1
:
1 in volume) was used as the electrolyte. The assembly of the cells was carried out in a dry Ar-filled glove box. Electrochemical tests were carried out using an automatic galvanostatic charge–discharge unit, NEWARE battery cycler, between 2.5 V and 4.5 V versus Li/Li+ electrode at room temperature. Cyclic voltammograms (CV) were measured on a LK9805 electrochemical interface at a scanning rate of 0.1 mV s−1. Electrochemical impedance spectroscopy (EIS) was conducted using an electrochemical analyzer (Zahner) at frequencies from 100 kHz to 10 mHz with a perturbation amplitude.
![]() | ||
Fig. 2 (a) TG-DTA curves of Fe4(VO4)4·15H2O/GO. (b) XRD patterns of Fe4(VO4)4 and FeVO4. (c) SEM images of Fe4(VO4)4·15H2O/GO. |
The XRD patterns of 2LFP·LVP@C/G and 2LFP·LVP@C are shown in Fig. 3, it indicates that two different 2LiFePO4·Li3V2(PO4)3 composites are all composed of orthorhombic LiFePO4 (space group Pnmb, PDF #83-20921) and monoclinic Li3V2(PO4)3 (space group P21/n, PDF #78-1465) phases without other impurities. There is no evidence of diffraction peaks for the carbon in all samples, indicating graphene. The Rietveld refinement result indicates the sample consists of two phases: LFP [46.5% w/w] and LVP [53.5% w/w]. The residual carbon contents of 2LFP·LVP@C/G and 2LFP·LVP@C measured using carbon sulfur analysis are 13.7 wt% and 14.0 wt%, respectively. The weight ratio of amorphous carbon to graphene in 2LFP·LVP@C/G composite is calculated to be 3:
1.
![]() | ||
Fig. 3 (a) XRD patterns of 2LFP·LVP@C/G and 2LFP·LVP@C. (b) Rietveld refinement performed with X-ray diffraction pattern of 2LFP·LVP@C/G. |
The TEM images of 2LFP·LVP@C/G is shown in Fig. 4. It can be seen from Fig. 4a that 2LFP·LVP@C/G nanoparticles with the size of about 180 nm are anchored on the surface of graphene sheets, which have tight contact surface with flexible graphene sheets. The Fig. 4b reflects the HRTEM images of 2LFP·LVP@C/G. It is found that there are two kinds of lattice fringes in the composite, one is the lattice fringe of LiFePO4 with an interplanar spacing of 0.278 nm, which corresponds to the (0 3 1) lattice planes, and the other is lattice fringe of Li3V2(PO4)3 with an interplanar spacing of 0.238 nm, which corresponds to the (1 4 2) lattice plane. The results imply that LiFePO4 unit cell, Li3V2(PO4)3 unit cell and 2LiFePO4·Li3V2(PO4)3 unit cell coexist in the composite materials.
![]() | ||
Fig. 4 (a) TEM image of 2LFP·LVP@C/G particles, (b) corresponding HRTEM images from the marked region I. |
Fig. 5a shows the first charge–discharge curves of the different 2LFP·LVP@C samples at 0.1 C rate. At such rate, 2LFP·LVP@C/G exhibited the optimal initial discharge capacity of 152.1 mA h g−1 with a average voltage of 3.66 V over a voltage of 2.5–4.5 V, while 2LFP·LVP@C are only 130.7 mA h g−1 with a average voltage of 3.58 V over a voltage of 2.5–4.5 V, indicating unique structure (particles growth on grapheme) has positive effects on the electrochemical performances. To the best of our knowledge, the graphene oxide consists of sufficient oxygen containing groups, such as carboxyl, hydroxyl, and epoxide groups,45 which provide sites for the adsorption of Fe3+ and nanoparticles nucleation to achieve uniform Fe4(VO4)4 on the surface of graphene oxide. The resulting nanoparticles could be bonded to the partial GO by Fe–O–C bonds at the remaining oxygen sites and by van der Waals interactions with the aromatic regions of the partial GO.
Fig. 5b shows cycle performance of 2LFP·LVP@C/G and 2LFP·LVP@C at different rates. The cells were cycled at different rates from 0.1 C to 10 C and then returned to 0.1 C (10 cycles for each rate). It can be clearly seen that the discharge capacity of both samples gradually decreases with increasing rate because of the increased polarization and the decreased utilization of active materials at high current density. However, the highly stable reversible capacity of 125.4 mA h g−1 has been obtained at 10 C with a average voltage of 3.50 V over a voltage of 2.5–4.5 V for 2LFP·LVP@C/G compared with only a value of 44.5 mA h g−1 for LFP·LVP@C. Moreover, it is remarkable that the 2LFP·LVP@C/G electrode still remains a good discharge capacity of 151.2 mA h g−1 at 0.1 C after 50 cycles, which shows better electrochemical performance.
The rate capability of 2LFP·LVP@C/G at different rates is presented in Fig. 5c. The discharge capacities of the composites at the different rate of 0.1 C, 1 C, 2 C, 5 C and 10 C are 152.1 mA h g−1, 142.4 mA h g−1, 136.6 mA h g−1, 131.7 mA h g−1 and 126.2 mA h g−1, respectively. Fig. 5d shows high and low temperature property of 2LFP·LVP@C/G. The thermal and chemical stabilities of graphene guarantee the safety when it is used in harsh environments. The discharge capacities of the composites at the temperature of 55 °C, −10 °C, −20 °C and −30 °C are 167.5 mA h g−1, 128.8 mA h g−1, 116.0 mA h g−1 and 100.2 mA h g−1, respectively. The excellent performance of material 2LFP·LVP@C/G at high rate and extreme temperature could be attributed to 3D electron conducting network formed in the samples when precursors were mixed properly, which may increases electron conductivity so as to enhance rate capability and cycle ability.
The cyclic voltammetry curves of the different composites at a scan rate of 0.1 mV s−1 between 2.5–4.5 V are presented in Fig. 6a. The cathodic and anodic peaks indicate the potential difference between the oxidation and reduction processes, which was ascribed to the lithium extraction and insertion, respectively. The oxidation curve in the 2LFP·LVP@C/G consist of 4 anodic peaks at approximately 3.519 V, 3.617 V, 3.695 V and 4.114 V, while the reduction curve include corresponding cathodic peaks at 3.339 V, 3.549 V, 3.627 V and 4.007 V. Compared with 2LFP·LVP@C, it is noticeable that 2LFP·LVP@C/G exhibits more symmetrical and shaper of peaks and the voltage gap between the redox peaks is obviously much smaller, which indicate that 2LFP·LVP@C/G presents much better reversibility for Li+ extraction/insertion. These results are in accordance with the charge and discharge curves obtained previously.
![]() | ||
Fig. 6 (a) Cyclic voltammetry profiles of the 2LFP·LVP@C/G and 2LFP·LVP@C. (b) Electrochemical impedance spectroscopy of 2LFP·LVP@C/G and 2LFP·LVP@C. (c) Raman spectra of 2LFP·LVP@C/G and 2LFP·LVP@C. |
Fig. 6b shows the electrochemical impedance spectroscopy of different composites after the first charge–discharge rate at 0.1 C. Each spectrum consists of a semicircle in the high-frequency region and a straight line in the low-frequency region. The depressed semicircle in high-frequency region was attributed to the charge-transfer resistance (Rct) of the electrochemical reaction while the straight line was related to the diffusion-controlled Warburg impedance. It clearly shows that 2LFP·LVP@C/G exhibits a smaller semicircle than that of 2LFP·LVP@C, which indicates that reduced graphene oxide reduces charge transfer resistance and thus improves the electronic conductivity.
Raman spectroscopy has been recognized as one of the most sensitive tools for studying the structural properties of carbonaceous materials, and the result of the 2LFP·LVP@C/G composite material is shown in Fig. 6c. Two broad bands were detected at around 1586 cm−1 and 1358 cm−1 in the spectrum, which are ascribed to D band and G band, respectively. As D band is a breathing mode of k-point phonons of A1g symmetry and G band is usually assigned to E2g phonon of C sp2 hybridized atoms,46 the sp3/sp2 bond quantity in material can be estimated by measuring the ratio of D and G band intensities ID/IG. This helps to evaluate the amount of graphene relative to other carbon materials, as it is known that carbon atoms in graphene are sp2 hybridized. Compared with the ID/IG ratio of 0.898 for 2LFP·LVP@C, the 2LFP·LVP@C/G displays a lower ratio of 0.827, indicating that the presence of graphene in 2LFP·LVP@C/G. Most of the studies suggest that lower ID/IG ratios provide higher cathode discharge capacity at high discharge rates.47–50
The excellent electrochemical performance of the composites may be due to the tightly contact between 2LFP·LVP@C and graphene. From the view of synergy effects, the resultant composite is not merely the sum of 2LFP·LVP@C and graphene, but rather a new material with new functionalities and properties. On the one hand, 2LFP·LVP@C anchored on grapheme suppress the agglomeration and restacking of graphene that increase the available surface area of the grapheme, accompanied with high electrochemical activity. On the other hand, as a support, graphene can induce nucleation, growth and formation of 2LFP·LVP@C, which is uniform dispersion and controlled morphology on the surface of graphene with high chemical functionality. Therefore, 2LFP·LVP@C/G can form an excellent integrated structure with a 3D electron conductive net work.
This journal is © The Royal Society of Chemistry 2015 |