Dissection of the binding of L-ascorbic acid to trypsin and pepsin using isothermal titration calorimetry, equilibrium microdialysis and spectrofluorimetry

Xiangrong Li* and Zhijun Yang
Department of Chemistry, School of Basic Medicine, Xinxiang Medical University, Xinxiang, Henan 453003, P. R. China. E-mail: 1842457577@qq.com; Tel: +86-373-3029128

Received 10th February 2015 , Accepted 17th March 2015

First published on 17th March 2015


Abstract

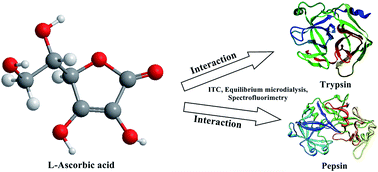
L-Ascorbic acid is an essential nutrient for a variety of biological functions. In this study, the binding of L-ascorbic acid to trypsin and pepsin was investigated using isothermal titration calorimetry (ITC) and equilibrium microdialysis in combination with spectrofluorimetry. Thermodynamic investigations reveal that the L-ascorbic acid binding to trypsin/pepsin is driven by favorable enthalpy and unfavorable entropy. The major driving forces come from the hydrogen bonds and van der Waals forces. ITC and equilibrium microdialysis experiments suggest that L-ascorbic acid binds to trypsin more firmly than to pepsin, and one molecule of L-ascorbic acid combines with one molecule of trypsin/pepsin. Fluorescence experiments suggest that L-ascorbic acid can quench the fluorescence of trypsin/pepsin through a static quenching mechanism. In addition, as shown by synchronous fluorescence spectroscopy, L-ascorbic acid may induce microenvironmental changes in trypsin and pepsin.
1. Introduction

L-Ascorbic acid is a reducing agent and also a water soluble vitamin and antioxidant used for pharmaceutical and food preservation or supplementation.1 Humans and other primates have lost the ability to synthesize L-ascorbic acid due to a defect in L-gulono-1,4-lactone oxidase, which is an enzyme that catalyzes the conversion of L-gulonolactone into L-ascorbic acid.2 Humans depend on their diet for the source of L-ascorbic acid to prevent the L-ascorbic acid deficiency disease, including scurvy, and to maintain general health. The current recommended dietary intake (RDI, representing the recommended dietary allowance) of L-ascorbic acid is determined as 90 mg per day for adult men and 75 mg per day for adult women,3 although strong arguments like the preventive functions of L-ascorbic acid in cardiovascular disease and certain cancers favours increased dietary intakes.4,5 The health-promoting effects of L-ascorbic acid can be attributed to its biological functions as a cofactor for a number of enzymes, such as hydroxylases involved in collagen synthesis, and as a water soluble antioxidant.6 Other authors have recently discussed the effects of L-ascorbic acid on cancer chemoprevention7,8 and in the treatment of cancer,9 sepsis,10 and neurodegenerative diseases.11,12 The binding study between L-ascorbic acid and serum albumin has been reported previously.13–15 However, to the best of our knowledge, an accurate and full basic data for clarifying the binding mechanisms of L-ascorbic acid to proteases remain unclear. Proteases play an important role in many biologically relevant processes and provide attractive targets in therapeutic and pharmaceutical research.16 Trypsin (EC 3.4.21.4) is secreted by the pancreas and results from conversion of the inactive trypsinogen.17 It is the most abundant proteases found in nature and plays an essential role in the digestion and deconstruction of food proteins and in other physiological processes, including hemostasis, apoptosis, signal transduction, reproduction, and immune response.18 For this reason trypsin is an attractive target in therapy and pharmaceutical research.19 Pepsin (EC 3.4.23.1) is an enzyme expressed as a prototype of zymogen and pepsinogen and is released by the chief cells in the stomach to degrade food proteins into peptides.20 It is an endopeptidase that catalyzes hydrolytic cleavage of peptidic bonds in the vicinity of hydrophobic or aromatic amino acid residues.21 Pepsin has been widely used in food and pharmaceutical manufacturing processes.22

In addition, the knowledge of the interaction mechanisms between L-ascorbic acid and trypsin/pepsin is very important. First, the binding studies of L-ascorbic acid with trypsin/pepsin can provide useful information on the pharmacokinetic and pharmacodynamic behavior of L-ascorbic acid in further experiments.23 Parameters, such as the mode of interaction, the binding constants and the number of binding sites, may provide some important theoretical information on the metabolism and distribution of L-ascorbic acid in life sciences.24 Second, L-ascorbic acid is considered to be a safe natural product but it may act as an antinutritional factor, in terms of the inhibition of proteases, when ingested in excess. To minimize the antinutritional effects and make full use of L-ascorbic acid, the knowledge of the interaction between L-ascorbic acid and trypsin/pepsin is desirable.25 Third, the conformational changes of trypsin/pepsin induced by its interactions with L-ascorbic acid may reduce its activity. Trypsin/pepsin is responsible for the hydrolysis of proteins into peptides and amino acids; moreover, the reduction in the activity of trypsin/pepsin may be harmful since it can contribute to a reduced absorption of nutrients.26 Thus, the binding study of L-ascorbic acid with trypsin/pepsin is important in the fields of pharmacology and biochemistry and is helpful for understanding the effect of L-ascorbic acid on the function of trypsin/pepsin and it's in vivo biological activity. The clear and quantitative information on the nature of the L-ascorbic acid and trypsin/pepsin interactions should provide a firm base for its rational use in clinical practice. In addition, the study provides a framework for elucidating the mechanism of L-ascorbic acid–protease binding and may throw light on the future studies of the interactions between a particular target protein and drug, which will guide the development of disease prevention and treatment.

In the present study, a comprehensive investigation was performed on the binding properties of L-ascorbic acid to trypsin and pepsin. Binding information, including the thermodynamic parameters, quenching mechanism, binding parameters, and microenvironmental changes of trypsin and pepsin, was investigated using isothermal titration calorimetry (ITC) in combination with equilibrium microdialysis and fluorescence spectroscopy.

2. Experimental

2.1. Materials

Trypsin, pepsin and L-ascorbic acid were purchased from Sigma-Aldrich Chemicals Company (St. Louis, USA). The trypsin solution (1 × 10⁻⁴ mol L−1) was prepared in pH 7.4 phosphate buffer (0.01 mol L−1 PBS) in order to provide physiological conditions for trypsin.27 A disodium hydrogen phosphate–citric acid buffer was used to maintain the pH value at 2.0 for the pepsin solution (1 × 10⁻⁴ mol L−1) in order to provide physiological conditions for pepsin.28 L-Ascorbic acid was directly dissolved in phosphate buffer solution of pH 7.4 or disodium hydrogen phosphate–citric acid buffer of pH 2.0. The stock solutions of L-ascorbic acid were prepared and used immediately to minimize oxidation due to light and air. Double-distilled water was used to prepare all the solutions. The trypsin and pepsin stock solutions were both prepared by extensive overnight dialysis at 4 °C against their respective buffer. pH was determined using a pHS-2C pH-meter (Shanghai DaPu Instruments Co., Ltd, Shanghai, China) at ambient temperature. Sample masses were weighed accurately on a microbalance (Sartorius, BP211D) with a resolution of 0.01 mg. All other reagents were of analytical reagent grade and were used as purchased without further purification.

2.2. Isothermal titration calorimetry (ITC)

The titration of trypsin/pepsin with L-ascorbic acid was performed using a Model Nano-ITC 2G biocalorimetry instrument (TA, USA) at 298 K. All the solutions were thoroughly degassed prior to titrations to avoid the formation of bubbles in the calorimeter cell. The sample cell was loaded with buffer or protein solution and the reference cell was loaded with double-distilled water. In a typical experiment, buffered trypsin/pepsin solution was placed in the 950 μL sample cell of the calorimeter and L-ascorbic acid solution was loaded into the injection syringe. Injections were started after baseline stability had been achieved. L-Ascorbic acid was titrated into the sample cell by means of a syringe via 25 individual injections each of 10 μL. The first 10 μL injection was ignored in the final data analysis. The contents of the sample cell were stirred throughout the experiment at 200 rpm to ensure thorough mixing. Raw data were obtained as a plot of heat (μJ) against injection number, which show a series of peaks corresponding to each injection. These raw data peaks were transformed using the instrument's software to obtain a plot of enthalpy change per mole of injectant (ΔH0, kJ mol−1) against molar ratio. The control experiments included the titration of L-ascorbic acid solution into buffer, buffer into trypsin/pepsin, and buffer into buffer; moreover, the controls were repeated for the same trypsin/pepsin concentration used. The last two controls resulted in small and equal enthalpy changes for each successive injection of buffer and, therefore, were not further considered in the data analysis.29 Corrected data refer to experimental data after the subtraction of the L-ascorbic acid into buffer control data.

Estimated binding parameters were obtained from ITC data using the NanoAnalyze software provided by the manufacturer. Fitting the data according to the independent binding model resulted in the stoichiometry of binding (n), the equilibrium binding constant (K), and enthalpy of complex formation (ΔH0). The standard changes in free energy (ΔG0) and entropy (ΔS0) are calculated using the following equations:30

 
ΔG0 = −RT[thin space (1/6-em)]ln[thin space (1/6-em)]K (1)
 
ΔG0 = ΔH0TΔS0 (2)

2.3. Equilibrium microdialysis

Equilibrium microdialysis was performed with the apparatus reported by our group previously.31 It consists of two chambers separated by a membrane (MWCO 10[thin space (1/6-em)]000), which is impermeable to particles larger than 10[thin space (1/6-em)]000 Da. Equilibrium microdialysis implies the allocation of two interacting agents, trypsin/pepsin and L-ascorbic acid, in two chambers (#1 and #2, respectively) divided by a membrane permeable to L-ascorbic acid and impermeable to trypsin/pepsin. After loading, the microdialysis device was immersed in a water bath at 298 K for 48 hours to allow L-ascorbic acid to equilibrate between chambers #1 and #2.32,33

2.4. Fluorescence measurements

The fluorescence measurements were performed on a Cary Eclipse fluorescence spectrophotometer (VARIAN, USA) equipped with a 1.0 cm quartz cell and a thermostatic bath. Certain volume of the stock solution of trypsin/pepsin and various volumes of the stock solution of L-ascorbic acid were transferred to 10 ml volumetric flasks. The mixture was diluted to the experimental concentration with phosphate buffer solution of pH 7.4 or disodium hydrogen phosphate–citric acid buffer of pH 2.0 to form the working solutions. The trypsin concentration was maintained at 6 × 10⁻⁶ mol L−1 and the pepsin concentration was maintained at 2 × 10⁻⁵ mol L−1. The excitation and emission slit widths were fixed at 5 nm. The excitation wavelength was set at 280 nm (excitation of the Trp and Tyr) and the emission spectra were read at 300–450 nm at a scan rate of 100 nm min−1. The synchronous fluorescence spectra were scanned from 280 to 330 nm (Δλ = 15 nm) and from 320 to 380 nm (Δλ = 60 nm).

The fluorescence measurements are hindered by the inner-filter effect in which small ligands absorb light at the excitation and emission wavelengths of proteins, leading to unreliable results.34 Thus, it is very important to subtract such effects from the raw quenching data. The extent of this effect can be roughly estimated with the following equation:35

 
Fcor = Fobsd10(Aex+Aem)/2 (3)
where Fcor and Fobsd are the corrected and observed fluorescence intensities, respectively, and Aex and Aem are the sum of the absorbance of protein and ligand at the excitation and emission wavelengths, respectively. The fluorescence intensity utilized in this study is the corrected intensity.

3. Results and discussion

3.1. Isothermal titration calorimetry (ITC) studies

Isothermal titration calorimetry (ITC), which directly measures the heat evolved during a reaction, is the method of choice for obtaining thermodynamic information. This is because only ITC allows researchers to directly obtain the variations of enthalpy, ΔH0, and of entropy, ΔS0, as well as the binding constant, K, and the stoichiometry of binding, n, for an association process.36

A representative calorimetric titration profile of 2 × 10⁻² mol L−1 L-ascorbic acid with 4 × 10⁻⁴ mol L−1 trypsin at pH 7.4 and 298 K is shown in Fig. 1A1. The L-ascorbic acid (1 × 10⁻² mol L−1) binding to pepsin (1 × 10⁻³ mol L−1) was also studied at pH 2.0 and 298 K, and the representative calorimetric titration profile is shown in Fig. 1A2. The thermodynamic parameters for the interaction of L-ascorbic acid with trypsin/pepsin obtained from ITC are listed in Table 1. Each peak in the binding isotherm represents a single injection of the L-ascorbic acid into the trypsin/pepsin solution. The exothermicity of the calorimetry peaks in Fig. 1A1 and A2 is believed to be due to the interaction between L-ascorbic acid and trypsin/pepsin. As the sites available on trypsin/pepsin become progressively occupied during titration, the exothermicity of the peaks decreases and eventually saturates. Fig. 1B1 and B2 show the plots of enthalpy change (ΔH0) against [L-ascorbic acid]/[trypsin or pepsin] molar ratio. The solid smooth lines in Fig. 1B1 or B2 represent the best fit of the experimental data using the independent binding sites model. However, for the L-ascorbic acid–bovine serum albumin (BSA) system that we had studied previously by ITC, the data appear to fit well to the more complex multiple binding sites (two sites) model.13


image file: c5ra02592c-f1.tif
Fig. 1 (A1) Raw data for the titration of 2 × 10⁻² mol L−1 L-ascorbic acid with 4 × 10⁻⁴ mol L−1 trypsin at pH 7.4 and 298 K showing the calorimetric response as the successive injections of L-ascorbic acid are added to the sample cell. (B1) Integrated heat profile of the calorimetric titration shown in panel A1. The solid line represents the best nonlinear least-squares fit to the independent binding sites model. (A2) Raw data for the titration of 1 × 10⁻² mol L−1 L-ascorbic acid with 1 × 10⁻³ mol L−1 pepsin at pH 2.0 and 298 K showing the calorimetric response as successive injections of L-ascorbic acid are added to the sample cell. (B2) Integrated heat profile of the calorimetric titration shown in panel A2. The solid line represents the best nonlinear least-squares fit to the independent binding sites model.
Table 1 Thermodynamic parameters for the interaction of L-ascorbic acid with trypsin and pepsin obtained from ITCa
System ΔH0/kJ mol−1 K/L mol−1 n ΔG0/kJ mol−1 ΔS0/J mol−1 K−1
a The listed errors are the asymptotic 95% confidence intervals.
L-Ascorbic acid–trypsin −31.56 ± 2.35 (1.086 ± 0.415) × 104 1.07 ± 0.40 −22.83 ± 0.98 −29.29 ± 4.60
L-Ascorbic acid–pepsin −49.34 ± 2.63 (1.337 ± 0.596) × 103 1.14 ± 0.31 −17.56 ± 1.19 −106.64 ± 4.48


The binding parameters of L-ascorbic acid with trypsin/pepsin are very important to understand the distribution and function of L-ascorbic acid in the digestive system, since the binding ability of L-ascorbic acid with trypsin/pepsin will provide direct insight into molecular mechanisms concerning the changes in the function of digestive proteases.37 The binding constants of trypsin and pepsin with L-ascorbic acid are (1.086 ± 0.415) × 104 and (1.337 ± 0.596) × 103 L mol−1, respectively. They are moderate compared to other strong protein–ligand complexes with binding constants ranging from 107 to 108 L mol−1.38 From the sequence of K, it is clear that L-ascorbic acid interacts with trypsin with a larger binding constant, K, i.e., the extent of binding for the L-ascorbic acid–trypsin complex is stronger than for the L-ascorbic acid–pepsin complex. For the L-ascorbic acid–BSA system that we studied by ITC, the data was explained using the multiple binding sites model; the high-affinity site has a binding constant, K1, of 1.858 × 10⁵ L mol−1, while the low-affinity site has a binding constant, K2, of 1.486 × 10⁴ L mol−1.13 The binding constants of BSA, trypsin and pepsin with L-ascorbic acid are in the following order of magnitude: L-ascorbic acid–BSA > L-ascorbic acid–trypsin > L-ascorbic acid–pepsin. These results indicate L-ascorbic acid binds BSA more firmly than trypsin/pepsin. The values of the stoichiometric binding number, n, of the two systems approximate to 1, suggesting that one molecule of L-ascorbic acid combines with one molecule of trypsin/pepsin and no further L-ascorbic acid binding to trypsin/pepsin occurs at the concentration ranges used in this study. The significant difference between the L-ascorbic acid–trypsin/pepsin system and the L-ascorbic acid–BSA system is in the effective value of the stoichiometric binding number, n. For the L-ascorbic acid–BSA system, the interaction is characterized by a high number of binding sites (n = 52.7), which suggests that binding occurs by a surface adsorption mechanism that leads to coating of the BSA surface.13 The negative values of free energy (ΔG0) and enthalpy (ΔH0) support that the binding of L-ascorbic acid to trypsin/pepsin is spontaneous and exothermic. Ross and Subramanian have characterized the sign and magnitude of the thermodynamic parameter associated with various types of interaction, which may take place in the protein binding process.39 The negative entropy (ΔS0) and negative enthalpy (ΔH0) values of the L-ascorbic acid–trypsin/pepsin system indicate that the major driving forces are hydrogen bond and van der Waals force. There are several types of weak interactions that simultaneously contribute to the negative enthalpy (ΔH0) values for the L-ascorbic acid–trypsin/pepsin system. (i) When the L-ascorbic acid molecule partially inserts itself into a hydrophobic cavity of the trypsin/pepsin molecule formed by the folding and twisting of the peptide chain, the hydrophobic interaction between the L-ascorbic acid molecule and the cavity would be an exothermic process.40 (ii) The expulsion of water molecules from the hydrophobic cavity to bulk solution is also exothermic,41 which leads to more evident negative heat effect because the energy of water molecules in hydrophobic microenvironments is more than that in the bulk aqueous solution. (iii) The direct electrostatic interaction of dipolar groups of the L-ascorbic acid molecules with the peptidic sections of trypsin/pepsin molecules also contributes to the exothermic effect.42 By eqn (2), the change of Gibbs free energy (ΔG0) is the comprehensive embodiment of the changes of enthalpy (ΔH0) and entropy (ΔS0). The binding of L-ascorbic acid to trypsin/pepsin is driven by favorable enthalpy and unfavorable entropy. These results are consistent with the results of the L-ascorbic acid–BSA system that we have reported.13

3.2. Equilibrium microdialysis studies

In the general case, when the number of binding modes is not known a priori, the use of equilibrium microdialysis can give information about the number of binding modes, binding sites and binding constants of each mode.32,33,43 If all the ligand binding sites on a receptor are identical and independent of each other, the binding constant of the ligand to receptor (K) is determined by the ratio of the ligand–receptor complex concentration, i.e. concentration of bound ligand (Cb), to the product of the concentration of free binding sites of receptor (nCpCb) and concentration of free ligand (Cf):
 
image file: c5ra02592c-t1.tif(4)
where Cp is the receptor concentration and n is the number of ligand binding sites on the receptor. Consequently, nCp is the concentration of binding sites. In our case, the solution of trypsin/pepsin with an initial concentration, Cp, was placed in chamber #1, and the solution of L-ascorbic acid in the same buffer with an initial concentration, C0, was placed in chamber #2. After equilibration, the concentrations of free L-ascorbic acid in chambers #1 and #2 become equal (Cf), while the total L-ascorbic acid concentration in chamber #1 is greater than that in chamber #2 by the concentration of the bound L-ascorbic acid (Cb) thus:
 
Cb = C0 − 2Cf (5)

The initial concentration of L-ascorbic acid in chamber #2 (C0) and the L-ascorbic acid concentration in this chamber after equilibration (Cf), which equals the concentration of free L-ascorbic acid in chamber #1, can be determined by absorption spectrophotometry. The concentration of L-ascorbic acid bound to trypsin/pepsin can be determined on the basis of eqn (5).

Equilibrium microdialysis was performed for a large number of different initial L-ascorbic acid concentrations (C0) with the subsequent spectrophotometric determination of the free (Cf) and, on the basis of eqn (5), bound (Cb) L-ascorbic acid concentration. Traditionally, these data are presented as Scatchard plot:

 
image file: c5ra02592c-t2.tif(6)

For a binding equilibrium system, binding parameters can be calculated according to the Scatchard plot. Only if the Scatchard plot is a straight line, it is an indication that all binding sites have the same affinities and a simple binding reaction occurs. If it binds to more than one type of site or if there is cooperativity in binding, the result will be a curved Scatchard plot.44

The Scatchard plots for L-ascorbic acid which relate the value of Cb/Cp to the value of (Cb/Cp)/Cf are presented in Fig. 2A and B. The Scatchard plots for the L-ascorbic acid–trypsin and L-ascorbic acid–pepsin systems are both straight line, which means that L-ascorbic acid binds independently to a set of equivalent sites on trypsin/pepsin.


image file: c5ra02592c-f2.tif
Fig. 2 Scatchard plots for trypsin (A) and pepsin (B) interaction with L-ascorbic acid. Experimental data (squares) and best fit curve with binding constant (K) and number of binding site (n) given on the panel.

The binding constant (K) equals 1.368 × 10⁴ L mol−1 for the L-ascorbic acid–trypsin system and 1.031 × 10³ L mol−1 for the L-ascorbic acid–pepsin system. The binding constants (K) obtained from equilibrium microdialysis are of the same order of magnitude as that obtained from the ITC technique. The value of the binding sites, n, of the L-ascorbic acid–trypsin and the L-ascorbic acid–pepsin systems obtained by equilibrium microdialysis equal 1.23 and 1.11, respectively. They are consistent with the results obtained from ITC.

3.3. Fluorescence spectroscopic studies

3.3.1. Effect of L-ascorbic acid on trypsin/pepsin fluorescence. Fig. 3A and B show the fluorescence emission spectra obtained for trypsin/pepsin with the addition of L-ascorbic acid. It can be seen that the fluorescence intensity of trypsin/pepsin decreased in the presence of L-ascorbic acid, indicating that the binding of L-ascorbic acid to trypsin/pepsin quenched the intrinsic fluorescence of trypsin/pepsin.45 Furthermore, a small red shift is observed with increasing L-ascorbic acid concentration, which suggests that the fluorophore of trypsin/pepsin is placed in a more hydrophilic environment after the addition of L-ascorbic acid.46
image file: c5ra02592c-f3.tif
Fig. 3 (A) Emission spectra of trypsin in the presence of different concentrations of L-ascorbic acid at 298 K and pH 7.4. c(trypsin) = 6.0 × 10⁻⁶ mol L−1; c(L-ascorbic acid)/10−4 mol L−1, (a–i) 0; 0.2; 0.4; 0.6; 0.8; 1.0; 1.2; 1.6; 2.4. The inset corresponds to the molecular structure of L-ascorbic acid. (B) Emission spectra of pepsin in the presence of different concentrations of L-ascorbic acid at 298 K and pH 2.0. c(pepsin) = 2.0 × 10⁻⁵ mol L−1; c(L-ascorbic acid)/10−3 mol L−1, (a–i) 0; 0.2; 0.4; 0.6; 0.8; 1.2; 1.6; 2.4; 3.2.
3.3.2. Fluorescence quenching mechanisms. The different mechanisms of quenching are usually classified as either dynamic or static. For fluorescence quenching, the decrease in intensity is usually described by the Stern–Volmer equation:47
 
F0/F = 1 + kqτ0[Q] = 1 + KSV[Q] (7)
where F0 and F represent the steady-state fluorescence intensities in the absence and presence of quencher, respectively. kq is the bimolecular quenching constant. τ0 is the lifetime of the fluorescence in the absence of quencher. The τ0 of the trypsin/pepsin is 10−8 s.48 [Q] is the concentration of the quencher, and KSV is the Stern–Volmer quenching constant. Fig. 4A and B show the Stern–Volmer plots for trypsin/pepsin fluorescence quenching by L-ascorbic acid. The values of KSV and kq for the interaction of L-ascorbic acid with trypsin/pepsin at four different temperatures are given in Table 2. In the present case, a linear Stern–Volmer plot is observed for L-ascorbic acid, which means that only one type of quenching mechanism occurs (dynamic or static). Dynamic and static quenching can be distinguished by their different dependence on temperature. For dynamic quenching, higher temperatures result in faster diffusion and greater quenching. The dynamic quenching constant increases with increasing temperature but the reverse effect is observed for static quenching.49 Our results show that the KSV values decrease with increasing temperature, and the values of kq are greater than the limiting diffusion rate constant of the trypsin/pepsin (2 × 10¹⁰ L mol−1 s−1)50 (Table 2), which suggests that the mechanism is static quenching.51 In our previous experiment, we found that L-ascorbic acid quenched the fluorescence of human serum albumin (HSA) through a combined static–dynamic quenching mechanism.14

image file: c5ra02592c-f4.tif
Fig. 4 Stern–Volmer plots of trypsin (A) and pepsin (B) fluorescence quenched by L-ascorbic acid at four different temperatures.
Table 2 The quenching constants (Ksv) and bimolecular quenching constants (kq) of the L-ascorbic acid–trypsin and L-ascorbic acid–peptin systems at different temperatures
System T (K) KSV (L mol−1) kq (L mol−1 s−1) Ra S.D.b
a R is the correlation coefficient.b S.D. is standard deviation.
L-Ascorbic acid–trypsin 293 1.783 × 10⁴ 1.783 × 10¹² 0.9995 0.0421
298 1.746 × 10⁴ 1.746 × 10¹² 0.9995 0.0424
303 1.426 × 10⁴ 1.426 × 10¹² 0.9921 0.1388
313 1.362 × 10⁴ 1.362 × 10¹² 0.9963 0.0899
L-Ascorbic acid–pepsin 293 6.269 × 10² 6.269 × 10¹⁰ 0.9929 0.0844
298 5.724 × 10² 5.724 × 10¹⁰ 0.9963 0.056
303 5.462 × 10² 5.462 × 10¹⁰ 0.9960 0.0557
310 4.981 × 10² 4.981 × 10¹⁰ 0.9981 0.0344


3.3.3. Binding parameters. When small molecules bind independently to a set of equivalent sites on a macromolecule and the equilibrium between the free and the bound molecules has been reached, the fluorescence intensities obey the following equation:52,53
 
image file: c5ra02592c-t3.tif(8)

F0 and F are the fluorescence intensities before and after the addition of the quencher, respectively. Ka is the apparent binding constant to a set of sites, and n is the average number of binding sites per trypsin molecule. [Q] and [P] are the total quencher concentration and the total protein concentration, respectively. By the plot of log(F0F)/F vs. log(1/([Q] − (F0F)[P]/F0)), the number of binding sites, n, and the binding constant, Ka, can be obtained (Fig. 5 and Table 3).


image file: c5ra02592c-f5.tif
Fig. 5 The plots of log(F0F)/F vs. log(1/([Q] − (F0F)[P]/F0)) for L-ascorbic acid–trypsin (A) and L-ascorbic acid-pepsin (B) systems at four different temperatures.
Table 3 The binding constants (Ka) and the number of binding sites (n) of the L-ascorbic acid–trypsin and L-ascorbic acid–peptin systems at different temperatures
System T (K) Ka (L mol−1) n Ra S.D.b
a R is the correlation coefficient.b S.D. is standard deviation.
L-Ascorbic acid–trypsin 293 1.681 × 10⁴ 1.25 0.9972 0.0348
298 1.457 × 10⁴ 1.18 0.9968 0.0405
303 1.285 × 10⁴ 1.14 0.9899 0.0684
313 1.279 × 10⁴ 1.12 0.9862 0.0768
L-Ascorbic acid–pepsin 293 1.157 × 10³ 1.09 0.9944 0.0509
298 1.085 × 10³ 1.13 0.9948 0.0497
303 1.023 × 10³ 1.17 0.9936 0.0581
310 0.976 × 10³ 1.22 0.9931 0.0628


Binding parameters calculated from eqn (8) show that L-ascorbic acid binds to trypsin and pepsin with binding affinities of the order 104 L mol−1 and 103 L mol−1, respectively. The number of binding sites, n, approximates to 1. These results are consistent with the results of ITC and equilibrium microdialysis. The decreasing trend of Ka with increasing temperature is in accordance with KSV's dependence on temperature, which supports the static quenching mechanism. The value of Ka decreases with the increase in temperature, which also indicates that rising temperature decreases the stability of the L-ascorbic acid–trypsin and L-ascorbic acid–pepsin complexes. It can be noted that the binding reactions between L-ascorbic acid and trypsin/pepsin are both exothermic.14 These results are validated by the enthalpy change, as shown in Table 1. We have studied the L-ascorbic acid–HSA system by spectroscopic methods.14 The binding constant of the L-ascorbic acid–HSA system equals 1.504 × 10⁴ L mol−1; moreover, it is of the same order of magnitude (104 L mol−1) as the L-ascorbic acid–trypsin system (1.457 × 10⁴ L mol−1) but larger than the L-ascorbic acid–pepsin system (1.085 × 10³ L mol−1). The stoichiometric binding number of the L-ascorbic acid–HSA system equals 1.43, it is larger than the L-ascorbic acid–trypsin system (n = 1.18) and the L-ascorbic acid–pepsin system (n = 1.13). These results suggest that L-ascorbic acid binds HSA more firmly than pepsin but with almost the same affinity for trypsin.

3.3.4. Synchronous fluorescence. Synchronous fluorescence spectra can supply characteristic information about the molecular environment in the vicinity of fluorophore molecules, such as Trp or Tyr, and have several advantages such as spectral simplification, reduction of the spectral bandwidth, and avoidance of different perturbing effects.54 The spectrum is obtained through the simultaneous scanning of the excitation and emission monochromators, while maintaining a constant wavelength interval between them. When the wavelength intervals (Δλ) are stabilized at 15 nm or 60 nm, the synchronous fluorescence gives the characteristic information for Tyr or Trp, respectively.55

The effects of L-ascorbic acid on the synchronous fluorescence spectra of trypsin/pepsin are shown in Fig. 6, wherein the quenching of fluorescence intensity of Trp is seen to be stronger than that of Tyr, suggesting that Trp contributes more to the quenching of intrinsic fluorescence. As the concentration of L-ascorbic acid is increased gradually, the fluorescence intensities decreases and the maximum emission wavelength of Trp was observed to have an obvious red shift (Fig. 6A1 and A2) along with a red shift of Tyr (Fig. 6B1 and B2). The red shift of the maximum emission wavelength indicates that the conformations of trypsin and pepsin are changed and the polarity around the Trp and Tyr is increased.46 In Fig. 6C1 and C2, the curve of Δλ = 60 nm is lower than the curve of Δλ = 15 nm, which leads to the conclusion that Trp plays an important role during fluorescence quenching of trypsin/pepsin by L-ascorbic acid. This signifies that L-ascorbic acid approaches the Trp more than the Tyr.


image file: c5ra02592c-f6.tif
Fig. 6 Synchronous fluorescence spectra of trypsin in the presence of different concentrations of L-ascorbic acid (Δλ = 60 nm (A1) and Δλ = 15 nm (B1)) at 298 K and pH 7.4. c(trypsin) = 6.0 × 10⁻⁶ mol L−1; c(L-ascorbic acid)/10−4 mol L−1, (a–k) 0; 0.12; 0.2; 0.4; 0.6; 0.8; 1.0; 1.2; 1.6; 2.0; 2.4. (C1) Quenching of trypsin synchronous fluorescence by L-ascorbic acid. Synchronous fluorescence spectra of pepsin in the presence of different concentrations of L-ascorbic acid (Δλ = 60 nm (A2) and Δλ = 15 nm (B2)) at 298 K and pH 2.0. c(pepsin) = 2.0 × 10⁻⁵ mol L−1; c(L-ascorbic acid)/10−3 mol L−1, (a–k) 0; 0.2; 0.4; 0.6; 0.8; 1.0; 1.2; 1.6; 1.8; 2.4; 3.2. (C2) Quenching of pepsin synchronous fluorescence by L-ascorbic acid.

4. Conclusions

The binding mechanisms of L-ascorbic acid interacting with trypsin and pepsin were investigated using ITC as well as equilibrium microdialysis and fluorescence spectroscopy. Data from ITC experiments suggest that the binding of L-ascorbic acid to trypsin/pepsin is driven by favorable enthalpy and unfavorable entropy, and the major driving forces are hydrogen bond and van der Waals force. ITC and equilibrium microdialysis experiments suggest that the binding ability of L-ascorbic acid with trypsin/pepsin is in the intermediate range and L-ascorbic acid binds trypsin more firmly than pepsin. The stoichiometric binding number, n, approximates to 1, suggesting that one molecule of L-ascorbic acid combines with one molecule of trypsin/pepsin and no more L-ascorbic acid binding to trypsin/pepsin occurs at the concentration ranges used in this study. Fluorescence experiments suggest that L-ascorbic acid can bind to trypsin/pepsin and quench the fluorescence of trypsin/pepsin through a static quenching mechanism. The binding constants and the binding sites obtained from fluorescence experiments are consistent with the results of ITC and equilibrium microdialysis studies. Synchronous fluorescence spectroscopy suggests that the interaction between L-ascorbic acid and trypsin/pepsin decreases the hydrophobicity of the microenvironment of the Trp and Tyr residues.

Acknowledgements

This study was supported by the Foundation for Fostering of Xinxiang Medical University (2014QN122).

Notes and references

  1. C. D. Pérez, E. N. Fissore, L. N. Gerschenson, R. G. Cameron and A. M. Rojas, Hydrolytic and Oxidative Stability of L-(+)-Ascorbic Acid Supported in Pectin Films: Influence of the Macromolecular Structure and Calcium Presence, J. Agric. Food Chem., 2012, 60, 5414–5422 CrossRef PubMed.
  2. M. G. Traber and J. F. Stevens, Vitamins C and E: Beneficial effects from a mechanistic perspective, Free Radical Biol. Med., 2011, 51, 1000–1013 CrossRef CAS PubMed.
  3. A. I. R. N. A. Barros, F. M. Nunes, B. Gonçalves, R. N. Bennett and A. P. Silva, Effect of cooking on total vitamin C contents and antioxidant activity of sweet chestnuts (Castanea sativa Mill.), Food Chem., 2011, 128, 165–172 CrossRef CAS PubMed.
  4. A. T. Diplock, J. L. Charleux, G. Crozier-Willi, F. J. Kok, C. Rice-Evans, M. Roberfroid, W. Stahl and J. Viña-Ribes, Functional food science and defence against reactive oxygen species, Br. J. Nutr., 1998, 80, S77–S112 CrossRef CAS.
  5. A. C. Carr and B. Frei, Toward a new recommended dietary allowance for vitamin C based on antioxidant and health effects in humans, Am. J. Clin. Nutr., 1999, 69, 1086–1107 CAS.
  6. C. D. Pérez, E. N. Fissore, L. N. Gerschenson, R. G. Cameron and A. M. Rojas, Hydrolytic and Oxidative Stability of L-(+)-Ascorbic Acid Supported in Pectin Films: Influence of the Macromolecular Structure and Calcium Presence, J. Agric. Food Chem., 2012, 60, 5414–5422 CrossRef PubMed.
  7. P. H. Gann, Randomized trials of antioxidant supplementation for cancer prevention: first bias, now chance-next, cause, JAMA, J. Am. Med. Assoc., 2009, 301, 102–103 CrossRef CAS PubMed.
  8. J. M. Gaziano, R. J. Glynn, W. G. Christen, T. Kurth, C. Belanger, J. MacFadyen, V. Bubes, J. E. Manson, H. D. Sesso and J. E. Buring, Vitamins E and C in the prevention of prostate and total cancer in men: the Physicians' Health Study II randomized controlled trial, JAMA, J. Am. Med. Assoc., 2009, 301, 52–62 CrossRef CAS PubMed.
  9. S. J. Padayatty, A. Y. Sun, Q. Chen, M. G. Espey, J. Drisko and M. Levine, Vitamin C: intravenous use by complementary and alternative medicine practitioners and adverse effects, PLoS One, 2010, 5, e11414 Search PubMed.
  10. J. X. Wilson, Mechanism of action of vitamin C in sepsis: ascorbate modulates redox signaling in endothelium, Biofactors, 2009, 35, 5–13 CrossRef CAS PubMed.
  11. D. A. Butterfield, M. L. Bader-Lange and R. Sultana, Involvements of the lipid peroxidation product, HNE, in the pathogenesis and progression of Alzheimer's disease, Biochim. Biophys. Acta, 2010, 1801, 924–929 CrossRef CAS PubMed.
  12. G. L. Bowman, H. Dodge, B. Frei, C. Calabrese, B. S. Oken, J. A. Kaye and J. F. Quinn, Ascorbic acid and rates of cognitive decline in Alzheimer's disease, J. Alzheimer's Dis., 2009, 16, 93–98 CAS.
  13. X. R. Li, G. K. Wang, D. J. Chen and Y. Lu, Binding of ascorbic acid and a-tocopherol to bovine serum albumin: a comparative study, Mol. BioSyst., 2014, 10, 326–337 RSC.
  14. X. R. Li, D. J. Chen, G. K. Wang and Y. Lu, Study of interaction between human serum albumin and three antioxidants: ascorbic acid, a-tocopherol, and proanthocyanidins, Eur. J. Med. Chem., 2013, 70, 22–36 CrossRef CAS PubMed.
  15. S. Nafisi, G. B. Sadeghi and A. PanahYab, Interaction of aspirin and vitamin C with bovine serum albumin, J. Photochem. Photobiol., B, 2011, 105, 198–202 CrossRef CAS PubMed.
  16. T. Maliar, A. Jedinak, J. Kadrabova and E. Sturdik, Structural aspects of flavonoids as trypsin inhibitors, Eur. J. Med. Chem., 2004, 39, 241–248 CrossRef CAS PubMed.
  17. J. M. Chen, T. Montier and C. Férec, Molecular pathology and evolutionary and physiological implications of pancreatitis-associated cationic trypsinogen mutations, Hum. Genet., 2001, 109, 245–252 CrossRef CAS PubMed.
  18. L. Gombos, J. Kardos, A. Patthy, P. Medveczky, L. Szilagyi, A. Malnasi-Csizmadia and L. Graf, Probing conformational plasticity of the activation domain of trypsin: the role of glycine hinges, Biochemistry, 2008, 47, 1675–1684 CrossRef CAS PubMed.
  19. Y. Wang, H. Zhang, J. Cao and Q. Zhou, Interaction of methotrexate with trypsin analyzed by spectroscopic and molecular modeling methods, J. Mol. Struct., 2013, 1051, 78–85 CrossRef CAS PubMed.
  20. A. Gole, C. Dash, M. Rao and M. Sastry, Encapsulation and biocatalytic activity of the enzyme pepsin in fatty lipid films by selective electrostatic interactions, Chem. Commun., 2000, 16, 297–298 RSC.
  21. T. Kageyama, Pepsinogens, progastricsins, and prochymosins: structure, function, evolution, and development, Cell. Mol. Life Sci., 2002, 59, 288–306 CrossRef CAS.
  22. D. Spelzini, J. Peleteiro, G. Picó and B. Farruggia, Polyethyleneglycol–pepsin interaction and its relationship with protein partitioning in aqueous two-phase systems, Colloids Surf., B, 2008, 67, 151–156 CrossRef CAS PubMed.
  23. H. Li, J. Pu, Y. Wang, C. Liu, J. Yu, T. Li and R. Wang, Comparative study of the binding of Trypsin with bifendate and analogs by spectrofluorimetry, Spectrochim. Acta, Part A, 2013, 115, 1–11 CrossRef CAS PubMed.
  24. H. M. Zhang, Y. Q. Wang and Q. H. Zhou, Fluorimetric study of interaction of benzidine with trypsin, J. Lumin., 2010, 130, 781–786 CrossRef CAS PubMed.
  25. Q. He, Y. Lv and K. Yao, Effects of tea polyphenols on the activities of a-amylase, pepsin, trypsin and lipase, Food Chem., 2006, 101, 1178–1182 CrossRef PubMed.
  26. R. Gonc-alves, N. Mateus and V. D. Freitas, Influence of Carbohydrates on the Interaction of Procyanidin B3 with Trypsin, J. Agric. Food Chem., 2011, 59, 11794–11802 CrossRef CAS PubMed.
  27. R. Wang, X. Kang, R. Wang, R. Wang, H. Dou, J. Wu, C. Song and J. Chang, Comparative study of the binding of trypsin to caffeine and theophylline by spectrofluorimetry, J. Lumin., 2013, 138, 258–266 CrossRef CAS PubMed.
  28. L. A. Campos and J. Sancho, The active site of pepsin is formed in the intermediate conformation dominant at mildly acidic pH, FEBS Lett., 2003, 538, 89–95 CrossRef CAS.
  29. M. A. Dobreva, R. A. Frazier, I. Mueller-Harvey, L. A. Clifton, A. Gea and R. J. Green, Binding of pentagalloyl glucose to two globular proteins occurs via multiple surface sites, Biomacromolecules, 2011, 12, 710–715 CrossRef CAS PubMed.
  30. G. K. Wang, C. L. Yan and Y. Lu, Exploring DNA binding properties and biological activities of dihydropyrimidinones derivatives, Colloids Surf., B, 2013, 106, 28–36 CrossRef CAS PubMed.
  31. Y. Lu, D. J. Chen, G. K. Wang and C. L. Yan, Study of interactions of bovine serum albumin in aqueous (NH4)2SO4 solution at 25 °C by osmotic pressure measurements, J. Chem. Eng. Data, 2009, 54, 1975–1980 CrossRef CAS.
  32. I. M. Kuznetsova, A. I. Sulatskaya, V. N. Uversky and K. K. Turoverov, A new trend in the experimental methodology for the analysis of the thioflavin T binding to amyloid fibrils, Mol. Neurobiol., 2012, 45, 488–498 CrossRef CAS PubMed.
  33. I. M. Kuznetsova, A. I. Sulatskaya1, O. I. Povarova1 and K. K. Turoverov, Reevaluation of ANS binding to human and bovine serum albumins: key role of equilibrium microdialysis in ligand–receptor binding characterization, PLoS One, 2012, 7, e40845 CAS.
  34. H. Wua, X. Zhao, P. Wang, Z. Dai and X. Zou, Electrochemical site marker competitive method for probing the binding site and binding mode between bovine serum albumin and alizarin red S, Electrochim. Acta, 2011, 56, 4181–4187 CrossRef PubMed.
  35. S. Neamtu, M. Mic, M. Bogdan and I. Turcu, The artifactual nature of stavudine binding to human serum albumin. a fluorescence quenching and isothermal titration calorimetry study, J. Pharm. Biomed. Anal., 2013, 72, 134–138 CrossRef CAS PubMed.
  36. D. Burnouf, E. Ennifar, S. Guedich, B. Puffer, G. Hoffmann, G. Bec, F. Disdier, M. Baltzinger and P. Dumas, kinITC: A new method for obtaining joint thermodynamic and kinetic data by isothermal titration calorimetry, J. Am. Chem. Soc., 2012, 134, 559–565 CrossRef CAS PubMed.
  37. H. Zhang, Q. Zhou, J. Cao and Y. Wang, Mechanism of cinnamic acid-induced trypsin inhibition: A multi-technique approach, Spectrochim. Acta, Part A, 2013, 116, 251–257 CrossRef CAS PubMed.
  38. Z. Cheng, Studies on the interaction betweens copoletin and two serum albumins by spectroscopic methods, J. Lumin., 2012, 132, 2719–2729 CrossRef CAS PubMed.
  39. P. D. Ross and S. Subramanian, Thermodynamics of protein association reactions: forces contributing to stability, Biochemistry, 1981, 20, 3096–3102 CrossRef CAS.
  40. D. Z. Sun, L. Li, X. M. Qiu, F. Liu and B. L. Yin, Isothermal titration calorimetry and 1H NMR studies on host-guest interaction of paeonol and two of its isomers with beta-cyclodextrin, Int. J. Pharm., 2006, 316, 7–13 CrossRef CAS PubMed.
  41. D. Z. Sun, S. B. Wang, M. Z. Song, X. L. Wei and B. L. Yin, A microcalorimetric study of hostguest complexes of α-cyclodextrin with alkyl trimethyl ammonium bromides in aqueous solutions, J. Solution Chem., 2005, 34, 701–712 CrossRef CAS.
  42. Q. Zhao, X. Y. Xu, X. J. Sun, M. Liu, D. Z. Sun and L. W. Li, A calorimetric study on interactions of colchicine with human serum albumin, J. Mol. Struct., 2009, 931, 31–34 CrossRef CAS PubMed.
  43. A. I. Sulatskaya, I. M. Kuznetsova and K. K. Turoverov, Interaction of thioflavin T with amyloid fibrils: stoichiometry and affinity of dye binding, absorption spectra of bound dye, J. Phys. Chem. B, 2011, 115, 11519–11524 CrossRef CAS PubMed.
  44. P. Lopes and R. Kataky, Chiral interactions of the drug propranolol and α1-acid-glycoprotein at a micro liquid–liquid interface, Anal. Chem., 2012, 84, 2299–2304 CrossRef CAS PubMed.
  45. H. Shen, Z. Gu, K. Jian and J. Qi, In vitro study on the binding of gemcitabine to bovine serum albumin, J. Pharm. Biomed. Anal., 2013, 75, 86–93 CrossRef CAS PubMed.
  46. F. Samari, B. Hemmateenejad, M. Shamsipur and M. Rashidi, Affinity of two novel five-coordinated anticancer Pt(II) complexes to human and bovine serum albumins: a spectroscopic approach, Inorg. Chem., 2012, 51, 3454–3464 CrossRef CAS PubMed.
  47. J. R. Lakowicz, Principles of Fluorescence Spectroscopy, Springer Science & Business Media, New York, 3rd edn, 2006 Search PubMed.
  48. J. R. Lakowicz and G. Weber, Quenching of fluorescence by oxygen. Probe for structural fluctuations in macromolecules, Biochemistry, 1973, 12, 4161–4170 CrossRef CAS.
  49. G. W. Zhang, L. Wang and J. H. Pan, Probing the binding of the flavonoid diosmetin to human serum albumin by multispectroscopic techniques, J. Agric. Food Chem., 2012, 60, 2721–2729 CrossRef CAS PubMed.
  50. W. R. Ware, Oxygen quenching of fluorescence in solution: An experimental study of the diffusion process, J. Phys. Chem., 1962, 66, 455–458 CrossRef CAS.
  51. H. Shen, Z. Gu, K. Jian and J. Qi, In vitro study on the binding of gemcitabine to bovine serum albumin, J. Pharm. Biomed. Anal., 2013, 75, 86–93 CrossRef CAS PubMed.
  52. S. Bi, L. Ding, Y. Tian, D. Song, X. Zhou, X. Liu and H. Zhang, Investigation of the interaction between flavonoids and human serum albumin, J. Mol. Struct., 2004, 703, 37–45 CrossRef CAS PubMed.
  53. S. Bi, D. Song, Y. Tian, X. Zhou, Z. Liu and H. Zhang, Molecular spectroscopic study on the interaction of tetracyclines with serum albumins, Spectrochim. Acta, Part A, 2005, 61, 629–636 CrossRef PubMed.
  54. P. F. Qin, R. T. Liu, X. R. Pan, X. Y. Fang and Y. Mou, Impact of carbon chain length on binding of perfluoroalkyl acids to bovine serum albumin determined by spectroscopic methods, J. Agric. Food Chem., 2010, 58, 5561–5567 CrossRef CAS PubMed.
  55. N. Ibrahim, H. Ibrahim, S. Kim, J. P. Nallet and F. Nepveu, Interactions between antimalarial indolone-N-oxide derivatives and human serum albumin, Biomacromolecules, 2010, 11, 3341–3351 CrossRef CAS PubMed.

This journal is © The Royal Society of Chemistry 2015