
A new method to prepare vanadium oxide nano-urchins as a cathode for lithium ion batteries
Jichao Wang,
Chaojun Cui,
Guohua Gao*,
Xiaowei Zhou,
Jiandong Wu,
Huiyu Yang,
Qiang Li and
Guangming Wu*
Shanghai Key Laboratory of Special Artificial Microstructure Materials and Technology, Tongji University, Shanghai 200092, P. R. China. E-mail: gao@tongji.edu.cn; wugm@tongji.edu.cn; Fax: +86-21-6598-6071; Tel: +86-21-6598-2762
First published on 8th May 2015
Abstract
Urchin-like vanadium oxide nanotube clusters, abbreviated to VOx-NUs, were synthesized using a new method. Vanadium pentoxide, having a layered structure, was modified by lithium fluoride (LiF) and transformed into bi-phase lithium vanadate as the inorganic precursor. Then, VOx-NUs were prepared by hydrothermal reaction with dodecylamine as a template. This is different from other molecular assembly methods reported. VOx-NUs-350 nano clusters were obtained by annealing VOx-NUs at a temperature of 350 °C in air. Both samples were identified as three dimensional urchin-like nano clusters. Based on the characterization data obtained, a formation mechanism was established. By simply varying the LiF stoichiometric ratio, the nano tube density of the VOx-NUs could be controlled. VOx-NUs presented a higher initial rate capacity of 400 mA h g−1 and VOx-NUs-350 maintained a better capacity of 150 mA h g−1 after 50 cycles at a 100 mA g−1 current density between 1.5 and 4 V versus Li/Li+.
Introduction
Hybrid electric vehicles (HEVs) and electric vehicles (EVs) powered by lithium ion batteries are more and more popular due to their economic and environmental advantages. In particular, EVs that travel remotely become potential substitutes for conventional vehicles. In addition, research of lithium ion battery electrode materials with a large capacity is urgently needed for popular large-screen mobile devices. However, the specific capacity and energy density of current lithium ion batteries are too small to meet the present requirements.Vanadium oxide has been widely studied due to its excellent electrochemical and catalytic performance. Vanadium pentoxide is considered to have the highest theoretical capacity and be a promising cathode material for high-capacity lithium ion batteries.1 However, due to irreversibility of the crystalline phases with ion insertion and extraction, poor ionic conductivity and active material solubility in the electrolyte, modified nanostructured vanadium oxide materials2–4 are used as a new type of electrode material. Nanostructured vanadium oxide can significantly improve these properties because of its higher surface area and shorter Li+ ion diffusion distance.5,6 A variety of one-dimensional nanostructured vanadium oxides have been synthesized.7–9 However, low-dimensional nano-materials are delivering the same disadvantage of dispersibility (self-aggregation) due to their higher surface energy.10–12 More orderly three dimensional vanadium oxide materials, such as nano-flowers,13–16 nano-urchins17–20 and nano-crusts,21 were synthesized by a hydrothermal method or alcothermal method to overcome this problem. By retaining large particles and reducing the contact area between electrodes and electrolytes, less dissolution compared to one-dimensional materials and higher volumetric energy densities are obtained.22 Vanadium oxide nano-urchins have been prepared typically using costly organic vanadium sources23 or complicated cation-induced inorganic vanadium sources18 in combination with templates.
In this study, a new approach with low-cost inorganic precursors is proposed. It is different from the molecular assembly methods mentioned previously. Nano-urchins (VOx-NUs) were synthesized by a hydrothermal method based on a traditional curling mechanism,24 and the nano-tube clusters density was related to the LiF stoichiometric ratio. VOx-NUs was calcined at 350 °C in air to produce urchin-like V2O5 nano crystal clusters abbreviated to VOx-NUs-350. Morphology, structure and electrochemical characterization of VOx-NUs and VOx-NUs-350 were preliminarily determined.
Experimental
The synthesis was performed following the methods of solid-state reaction and hydrothermal treatment. First, starting materials with different stoichiometric proportions (molar ratios of V2O5 and LiF were 1![[thin space (1/6-em)]](https://www.rsc.org/images/entities/char_2009.gif) :0.3 and 1:0.4) were transferred to different porcelain crucibles respectively, and then put in muffle furnaces. The muffle furnaces were heated to 700 °C at a heating rate of 5 °C min−1, and kept at 700 °C for 2–4 h. The melted compounds were left to cool naturally, and then the modified precursors were obtained and denoted by 0.3LiF + VOx and 0.4LiF + VOx.25 These as-synthesized precursors were ground into powder by ball milling. Second, the hydrothermal procedure was similar to those reported in literature.26,27 1 g modified precursors αLiF + VOx powder and 1.04 g dodecylamine were slowly added in 80 mL deionized water under magnetic stirring for about 30 min, which led to the formation of a yellow suspension liquid. The yellow suspension liquid was vigorously stirred for 12 h and transferred into a 100 mL Teflon lined hydrothermal autoclave with a stainless steel shell. The autoclave was kept at 180 °C in an oven for 7 days. The precipitate obtained was filtered and rinsed repeatedly with ethanol and deionized water and then dried at 70 °C under vacuum for 8 h. The resulting black powders were urchin-like vanadium oxide nanotube clusters (VOx-NUs). 0.3VOx-NUs were the product of precursor 0.3LiF + VOx and 0.4VOx-NUs was the product of precursor 0.4LiF + VOx. VOx-NUs-350 nano crystal clusters were obtained by annealing VOx-NUs at a temperature of 350 °C for 3 h in air with a heating rate of 5 °C min−1 and are denoted by 0.3VOx-NUs-350 and 0.4VOx-NUs-350.
:0.3 and 1:0.4) were transferred to different porcelain crucibles respectively, and then put in muffle furnaces. The muffle furnaces were heated to 700 °C at a heating rate of 5 °C min−1, and kept at 700 °C for 2–4 h. The melted compounds were left to cool naturally, and then the modified precursors were obtained and denoted by 0.3LiF + VOx and 0.4LiF + VOx.25 These as-synthesized precursors were ground into powder by ball milling. Second, the hydrothermal procedure was similar to those reported in literature.26,27 1 g modified precursors αLiF + VOx powder and 1.04 g dodecylamine were slowly added in 80 mL deionized water under magnetic stirring for about 30 min, which led to the formation of a yellow suspension liquid. The yellow suspension liquid was vigorously stirred for 12 h and transferred into a 100 mL Teflon lined hydrothermal autoclave with a stainless steel shell. The autoclave was kept at 180 °C in an oven for 7 days. The precipitate obtained was filtered and rinsed repeatedly with ethanol and deionized water and then dried at 70 °C under vacuum for 8 h. The resulting black powders were urchin-like vanadium oxide nanotube clusters (VOx-NUs). 0.3VOx-NUs were the product of precursor 0.3LiF + VOx and 0.4VOx-NUs was the product of precursor 0.4LiF + VOx. VOx-NUs-350 nano crystal clusters were obtained by annealing VOx-NUs at a temperature of 350 °C for 3 h in air with a heating rate of 5 °C min−1 and are denoted by 0.3VOx-NUs-350 and 0.4VOx-NUs-350.
Scanning electron microscopy (SEM: Philips-XL-30FEG) and transmission electron microscopy (TEM: 200 kV JEOL-1230) were introduced to observe the morphologies and characterize the microstructure of samples with very high spatial resolution. X-ray powder diffraction (XRD) patterns were obtained using a RigataD/max-C diffractometer with a CuKα radiation source (λ = 1.5406 Å) in the range of 5–60° for phase identification. FT-IR absorption spectroscopy measurements were carried out using a Bruker-TENSOR27 FTIR spectrometer in the range of 400–4000 cm−1 to characterize surface chemical–physical properties by the KBr disk method. The thermogravimetry (TG) and differential scanning calorimeter (DSC) measurements were performed using a SDT Q600 in the temperature range of 17–650 °C with a heating rate of 10 °C min−1 in air. XPS experiments were conducted using a RBD upgraded PHI-5000C ESCA system (Perkin Elmer) with Mg Kα radiation (hν = 1253.6 eV). Binding energies were calibrated using the containment carbon (C1s = 284.6 eV). The data analysis was carried out using XPS Peak 4.1 software.
The cathode electrodes for electrochemical characterization were prepared by mixing active materials with carbon black and polyvinylidene fluoride (PVDF) binder (70:20:10 wt%) in N-methyl-2-pyrrolidone (NMP) solvent. Then, the obtained slurry was uniformly coated on an aluminum foil current collector. The electrodes were dried in vacuum at 120 °C for 8 h and then cut into a circular wafer for testing, with a microporous film (Celgard 2500) as a membrane and lithium metal as the anode and reference electrode in model CR2025 coin cells. The electrolyte was 1 M LiPF6 dissolved in ethylene carbonate (EC)/dimethyl carbonate (DMC)/diethyl carbonate (DEC) (1:1:1 in volume). The coin cells were assembled in an argon-filled glove box with moisture content and an oxygen level less than 1 ppm. The electrochemical tests were performed using a LAND cell-testing system and a CHI660C electrochemical workstation at room temperature. Cyclic voltammetry (CV) measurements were performed at a scanning rate of 0.1 mV s−1. Electrochemical impedance spectroscopy (EIS) measurements were carried out in a frequency range between 100 kHz and 0.01 Hz at a discharge state of 2.3 V, with 5 mV as the amplitude of the AC signal. The impedance data were analyzed using Z-view software and fitted based on the simple equivalent circuit. Galvanostatic charge/discharge tests were recorded within a voltage range of 1.5–4.0 V (vs. Li/Li+), at a charge/discharge current of 100 mA g−1.
Results and discussion
Fig. 1a and b are SEM and TEM images of 0.3VOx-NUs, respectively, which have been prepared with as-synthesized 0.3LiF + V2O5. As can be seen in Fig. 1a, the 0.3VOx-NUs show a sea urchin-like three-dimensional configuration with pin-like vanadium oxide nanotubes over it. Large quantities of open-end nanotubes (∼1 μm) are evident. These dense nanotube clusters have diameters in the range of 2–3 μm. The internal structure of nano-urchins can be further seen in the TEM images (Fig. 1b). Expanding from a center point with dense nano-tubes uniformly spread out is shown in the inset of Fig. 1b. Fig. 1b shows one single nano-tube from nano-urchins, which maintain a complete nano-tube structure. Its outside diameter is greater than 60 nm and inside diameter is about 20 nm. The interlamellar distance is clearly 2 nm. The interlamellar distance reflects the two-dimensional structure of the VOx layers and the 2 nm spacing corresponds to reflection 001.28 Fig. 1c and d show the SEM and TEM of 0.4VOx-NUs prepared with as-synthesized 0.4LiF + V2O5. Compared with 0.3VOx-NUs, 0.4VOx-NUs also present a three-dimensional configuration of nano-urchins, as shown in the insets of Fig. 1c and d. | ||
| Fig. 1 SEM image (a) and TEM image (b) of 0.3VOx-NUs. SEM image (c) and TEM image (d) of 0.4VOx-NUs. SEM image (e) and TEM image (f) of 0.3VOx-NUs-350. SEM image (g) and TEM image (h) of 0.4VOx-NUs-350. Insets: low magnification TEM images. | ||
However, the nano-tube volumetric density of 0.4VOx-NUs was lower than the 0.3VOx-NUs, as observed in Fig. 1a and c. 0.4VOx-NUs nano-tubes clusters have larger diameters in the range of 15–20 μm and longer nanotubes (∼10 μm). Fig. 1d displays a single nano-tube of 0.4VOx-NUs. Where tube walls locally collapse, the outside diameter was less than 60 nm, and inside diameter was about 27 nm. Nano-tube structure remained intact and the interlamellar distance expands to 2.7 nm. It is illustrated that LiF is influential on the three dimensional structure, but also on the structure of a single nano-tube.
Fig. 1e and f show the urchin-like configuration and building nano-blocks of 0.3VOx-NUs-350. It can be seen that the 0.3VOx-NUs-350 synthesized by sintering 0.3VOx-NUs was composed of small interconnected nano-blocks with a size of 50–100 nm. These nano-urchin clusters also have diameters in the range of 2–3 μm with lower volumetric density nano-tubes over them. The same things happen to 0.4VOx-NUs-350 with larger cluster diameters of 15–20 μm in Fig. 1g and h.
As seen in the FTIR spectrum of Fig. 2, VOx-NUs and VOx-NUs-350 present some differences with the characteristic vibration peaks, especially in region characteristic of end group oxygen.29 The absorption peaks at 1465, 2852, and 2922 cm−1 are assigned to the various bending and stretching modes of C–H vibrations in dodecylamine for the VOx-NUs. These peaks disappear for V2O5-NUs-350, indicating the removal of dodecylamine after sintering. Two peaks at 1627 and 3450 cm−1 are attributed to H–O stretching and H–O–H bending vibration modes. For all samples, the characteristic peaks near 1000 cm−1 (999 and 1022 cm−1), ranging from 700 to 900 cm−1 (831 cm−1) and below 700 cm−1 (499, 626 and 630 cm−1) correspond to the stretching vibration of terminal oxygen bonds (V![[double bond, length as m-dash]](https://www.rsc.org/images/entities/char_e001.gif) O), the vibration of doubly coordinated oxygen bonds (O–V–O), and the asymmetric and symmetric stretching vibrations of triply coordinated oxygen bonds in vanadium oxide (3V–O), respectively.27,30 The shifting of corresponding coordinated oxygen bonds may be caused by the lattice distortion and microscopic stress variation in the coordination geometry. LiF characteristic peaks are not observed in Fig. 2. It is believed that LiF had been removed during the sintering process25 and hydrothermal process. Although nano-urchins do not present additional absorption peaks in contrast to VOx-NTs,30 LiF does modify precursors and has an impact on the final morphology according to the SEM and TEM analysis mentioned above.
O), the vibration of doubly coordinated oxygen bonds (O–V–O), and the asymmetric and symmetric stretching vibrations of triply coordinated oxygen bonds in vanadium oxide (3V–O), respectively.27,30 The shifting of corresponding coordinated oxygen bonds may be caused by the lattice distortion and microscopic stress variation in the coordination geometry. LiF characteristic peaks are not observed in Fig. 2. It is believed that LiF had been removed during the sintering process25 and hydrothermal process. Although nano-urchins do not present additional absorption peaks in contrast to VOx-NTs,30 LiF does modify precursors and has an impact on the final morphology according to the SEM and TEM analysis mentioned above.
 | ||
| Fig. 2 FT-IR spectra of 0.3VOx-NUs (#1), 0.4VOx-NUs (#2), 0.3VOx-NUs-350 (#3) and 0.4VOx-NUs-350 (#4). | ||
Fig. 3 gives the TG-DSC curves of VOx-NUs in air. The weight loss of 10% from the room temperature to about 200 °C is assigned to the thermal evaporation of absorbed water molecules. The thorough oxidative decomposition of organic templates for VOx-NUs was completed at 450 °C, causing a total of 51% weight loss which will describe the approximate content of the organic templates of the VOx-NUs. The exothermic peaks at 240 °C can be ascribed to the decomposition of dodecylamine. Two exothermic peaks at 398 °C and 480 °C can mainly be ascribed to the recrystallization of the VOx layers. The organic templates will mostly be removed at 350 °C and recrystallization will not change the 3D nanostructures.
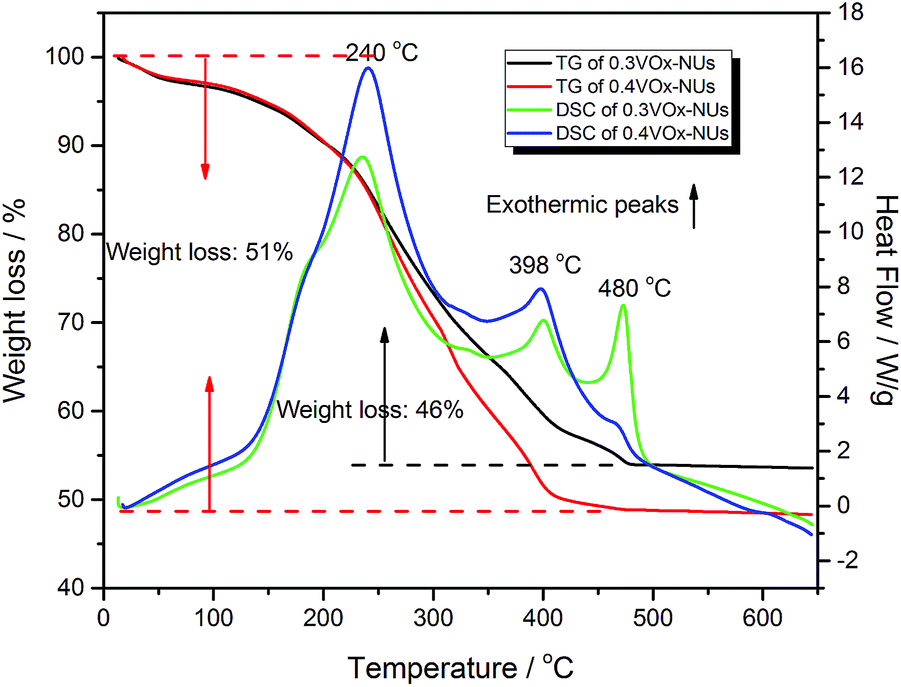 | ||
| Fig. 3 TG-DSC curves of αVOx-NUs (α = 0.3, 0.4) in air. | ||
The XPS technique was employed to identify the elemental composition of αLiF + VOx (α = 0.3, 0.4) and analyze the content of the vanadium element with different valence states. The XPS general spectrum of αLiF + VOx is given in Fig. 4a and c. The F1s peak at about 690 eV originates from LiF is too weak to identify.
 | ||
| Fig. 4 XPS general spectrum and V2p region of 0.3LiF + VOx (a and b) and 0.4LiF + VOx (c and d). | ||
Fig. 4b and d present the V2p region of the XPS spectrum, which includes the V2p3/2 and V2p1/2 peaks; the V2p3/2 peak can be divided into two peaks at binding energies of 517.3 and 516.1 eV, which are ascribed to V5+ and V4+, respectively. As shown in Fig. 4b and d, XPS Peak 4.1 software was applied to fit the experimental data and ascertain the ratio of V5+/V4+ in the αLiF + VOx through the calculation of V5+ peak area/V4+ peak area. The fitted result illustrates that the ratio of V5+/V4+ in 0.3LiF + VOx is 0.29, that is, V5+ and V4+ account for 22.7% and 77.3%. The ratio of V5+/V4+ in 0.4LiF + VOx is 1.02, that is, V5+ and V4+ account for 50.5% and 49.5%, respectively.
Fluorine is believed not to insert into the vanadium oxide layers due to the reaction of fluorine and silicon oxide, which is the main component of the crucible. The reaction has been described in detail in another study.25
XRD patterns are performed to determine the crystalline phases in Fig. 5. The black line (Fig. 5a) is the XRD pattern of sample 0.3LiF + V2O5. The red line (Fig. 5b) is for 0.4LiF + V2O5. It is thought that peaks marked by ○ ascribed to LiV3O8 phase (JCPDS card: no. 35-0437), and other strong peaks are due to the Li0.3V2O5 phase (JCPDS card: 18-0755), marked by Δ. It can be seen that the LiV3O8 phase in 0.4LiF + V2O5 is stronger than 0.3LiF + V2O5.25 The blue line (Fig. 5c) and cyan line (Fig. 5d) are the XRD patterns of the 0.3VOx-NUs and 0.4VOx-NUs, respectively. VOx-NUs samples can be indexed on the basis of the orientation (002), (003), (110), (200), (210), and (310).19,20 The Bragg reflections indicate that VOx-NUs are lamellar intercalated products of amine and vanadium oxide. The peaks (002) and (003) with higher intensity at the small angle region corroborate the interlayer distance and can be used to calculate the distance between VOx layers.27 According to Bragg's law, the distances are 2.8 nm for 0.3VOx-NUs and 3 nm for 0.4VOx-NUs, which are close to the results of the TEM observation. The characteristic reflection peaks (110), (200), (210) and (310) indicate high structural order of vanadate layers, but also intercalated amine groups between these layers.20,31 Remarkably, the positions of the hk0 reflections are the same for all the VOx-NUs samples, indicating that the contents of the wall structure are not affected by LiF. However, the (00l) peaks of 0.4VOx-NUs significantly move to lower degree values than those of 0.3VOx-NUs. The shifts mean that the distance between the layers in 0.3VOx-NUs is smaller than that in 0.4VOx-NUs. Prelithiation of V2O5 makes more lithium ions insert into the vanadium oxide layers, which can increase the layer spacing and is consistent with the TEM images. VOx-NUs-350 samples display a series of characteristic diffraction peaks (200), (001), (101), (110), and (111), (020), which can be indexed to the orthogonal V2O5 phase (JCPDS no. 41-1426, space group: Pmmn, a = 11.516 Å, b = 3.566 Å, c = 4.372 Å), and no LiF peaks were detected, indicating the high purity of V2O5 nano-crystals.12,27 By calculation based on Scherrer formula, the average grain size of V2O5 nano-crystals is ∼40 nm, which is in agreement with the TEM and SEM observations.
 | ||
| Fig. 5 XRD patterns of 0.3LiF + V2O5 (a), 0.4LiF + V2O5 (b), 0.3VOx-NUs (c), 0.4VOx-NUs (d), 0.3VOx-NUs-350 (e), 0.4VOx-NUs-350 (f) and the orthogonal V2O5 standard peaks (JCPDS no. 41-1426, space group: Pmmn, a = 11.516 Å, b = 3.566 Å, c = 4.372 Å). | ||
In Fig. 6, the formation of nano-urchins is simulated. The as-prepared precursors were double-crystal materials known from the XRD in ref. 25. In addition, these precursors are bulk materials in above SEM-1 of Fig. 6. Grain boundaries exist between different crystal substances. With the insertion of the template, the layered materials produce split lines due to unbalanced stress, which are schematically shown in Fig. 6-1. In the hydrothermal process (Fig. 6-2), the fracture layers center on one point and partly curl as VOx-NTs,9 as shown in SEM-2 of Fig. 6. This image is a sectional view of semi-finished VOx-NUs internal structure and nano-urchins forming state has been shown clearly. Basically, it can be speculated that the forming process of nano-tubes began from the outside with a common center. Curling of many super imposed layers eventually forms nano-urchins (Fig. 6-3). These correspond to the SEM and TEM images.
 | ||
| Fig. 6 Schematic diagram showing the formation of VOx-NUs. | ||
Cyclic voltammetry was employed to evaluate the samples' electrochemical properties. Fig. 7 shows the initial three cycles under a low scan rate of 0.1 mV s−1 between 1.5 and 4 V. At the first cycling of 0.3VOx-NUs, two anodic peaks at 2.8 V and 3.1 V were observed. One cathodic peak at 2.2 V related to the lithium ion extraction is observed. At the second and third cycle, the cathodic peaks moved to 2.25 V and 2.3 V, respectively. For 0.3VOx-NUs-350, one anodic peak at 2.5 V is observed and moves to 2.7 V for the following cycles. The cathodic peak is maintained at 2.25 V, indicating a good cycling ability. 0.4VOx-NUs has three anodic peaks at 2.5 V, 3.25 V and 3.75 V at the first cycle, which become two peaks at 2.75 V and 3.4 V at the second cycle and disappears on the third cycle. It does not show a distinct cathodic peak. 0.4VOx-NUs-350 revealed cycling ability as good as 0.3VOx-NUs-350. One anodic peak at 2.5 V was observed that moved to 2.7 V for the subsequent cycles. The cathodic peak was maintained at 2.25 V.
 | ||
| Fig. 7 Cyclic voltammogram of samples at a scan rate of 0.1 mV s−1 between 1.5 and 4.0 V. | ||
Electrochemical impedance spectroscopy (EIS) was introduced to evaluate the electrochemical mechanism of these samples. The typical Nyquist plots at a discharge state of 2.3 V are presented in Fig. 8a and b. The plots show depressed semicircles in the high-frequency region and slope lines in the low-frequency region. Generally, the diameter of the semicircle in the high-frequency region is associated with the charge transfer reaction at the electrolyte/electrode interface. The smaller the diameter the semicircle is, the smaller the charge transfer resistance will be. The slope line in the low-frequency region is related to the Warburg impedance associated with the ion diffusion process in the electrode materials.27,30 As can be seen from the insets of Fig. 8a and b, the semicircle diameters of VOx-NUs-350 are smaller than those of VOx-NUs in the high-frequency region, indicating that VOx-NUs-350 samples had a lower charge transfer resistance compared to the VOx-NUs samples.
 | ||
| Fig. 8 Nyquist plots (a) for 0.3VOx-NUs and 0.4VOx-NUs and (b) for 0.3VOx-NUs-350 and 0.4VOx-NUs-350 with 5 mV amplitude of AC signal at the state of charge of 2.3 V (insets: equivalent circuit used for fitting the Nyquist plots and Nyquist plots magnification of the high frequency region). | ||
The two simple equivalent circuits, shown in the inset of Fig. 8a and b, were designed to analyze the impedance spectra of the samples. In the circuit, Re presents the electrolyte resistance, Rct stands for the charge transfer resistance, CPE is the double layer capacitance, and W is the Warburg impedance. The electrochemical parameters of the samples were fitted by using Z-view software, and a good agreement between the experimental results and the parameters obtained from the equivalent circuit can be seen from the EIS spectra. The fitted electrochemical parameters are listed in Table 1. As can be seen from Table 1, the charge transfer resistances (Rct) for 0.3VOx-NUs and 0.4VOx-NUs at an open circuit potential (Rct1 + Rct2) are 223.1 ohm and 232.74 ohm, respectively. The charge transfer resistances (Rct) for 0.3VOx-NUs-350 and 0.4VOx-NUs-350 are 163 ohm and 163.2 ohm, respectively. It is clear that the Rct values of VOx-NUs-350 samples are considerably smaller than that of VOx-NUs samples, indicating that charge transfer is easier for VOx-NUs-350 samples than VOx-NUs.
| Samples | 0.3VOx-NUs | 0.3VOx-NUs-350 | 0.4VOx-NUs | 0.4VOx-NUs-350 | |
|---|---|---|---|---|---|
| Open circuit potential | Rct1/Ω | 123 | 163 | 88.44 | 163.2 |
| Rct2/Ω | 100.1 | 144.3 | |||
The Bode plots in Fig. 9 can be used to estimate the effectiveness of lithium ion diffusion in the electrode materials. According to previous studies,25,32 the lithium ion diffusion is related to the phase angle in the low-frequency region. The smaller the phase angle is, the faster the lithium ions diffusion is. As shown in Fig. 9, the phase angles of the VOx-NUs-350 samples are considerably smaller than that of VOx-NUs samples in the low-frequency region, indicating that VOx-NUs-350 samples have a more rapid lithium ions diffusion speed than that of the VOx-NUs samples. The improved electrochemical kinetics may be attributed to the removal of the organic template according to the FT-IR in Fig. 2.
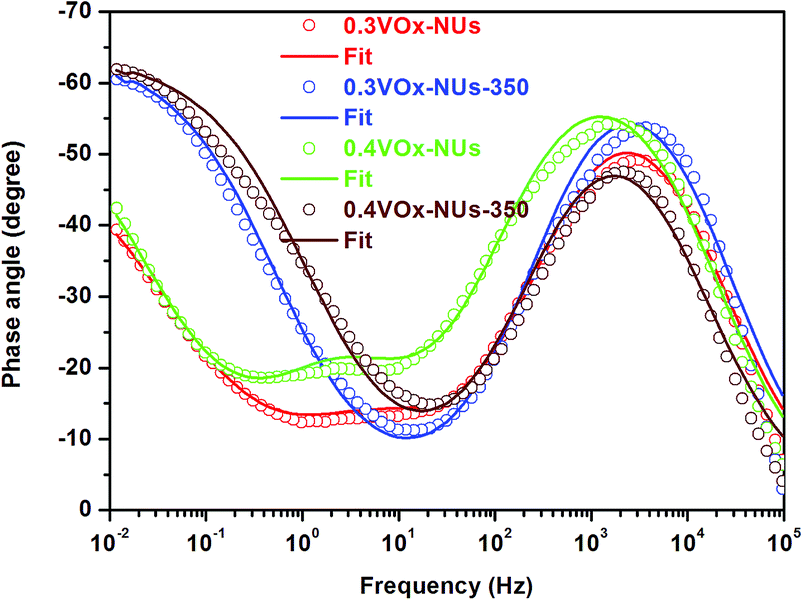 | ||
| Fig. 9 Bode plots of samples at an open circuit potential of 2.3 V. | ||
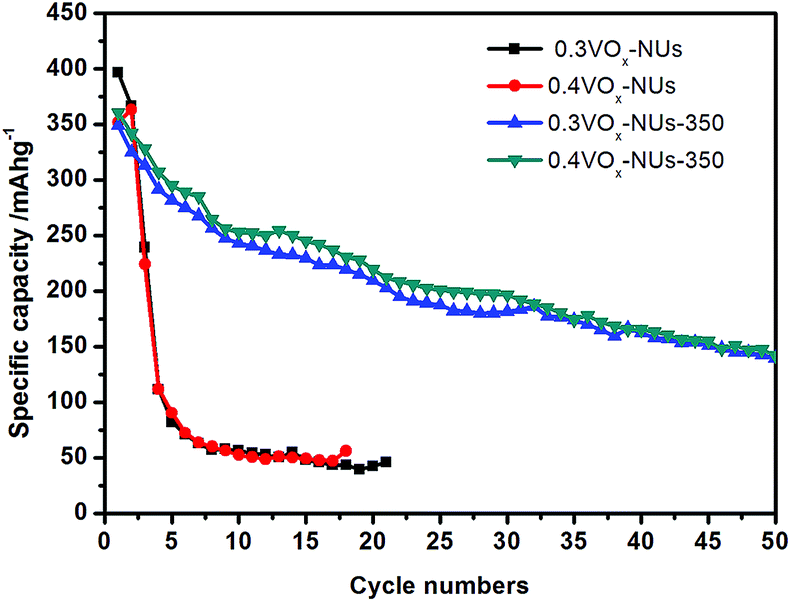
Discharge capacities versus cycle numbers of VOx-NUs and VOx-NUs-350 are plotted in Fig. 10 at a constant current density of 100 mA g−1 between 1.5 and 4.0 V vs. Li/Li+. 0.3VOx-NUs and 0.4VOx-NUs delivered initial specific capacities of 396.4 mA h g−1 and 351.9 mA h g−1, respectively. After 20 cycles, capacities of 40 and 50 mA h g−1 remained. The initial capacity values for 0.3VOx-NUs-350 and 0.4VOx-NUs-350 was 366.3 and 363.5 mA h g−1, respectively. After 50 cycles, both faded to about 150 mA h g−1. The rapid capacity decay of VOx-NUs may be caused by the decomposition of organic dodecylamine and its severe contamination of the electrolyte. It can be concluded that nano urchin-like VOx-NUs-350, which is composed of interconnected V2O5 nanocrystals and free of organic templates, possesses a high specific capacity and superior cycling performance.
 | ||
| Fig. 10 Galvanostatic cycles of 0.3VOx-NUs, 0.4VOx-NUs, 0.3VOx-NUs-350 and 0.4VOx-NUs-350 at the current density of 100 mA g−1 between 1.5 and 4 V. | ||
Conclusions
Two species of nano-urchins of vanadium oxide were prepared by a new method involving bi-phase lithium vanadate materials and a hydrothermal method with dodecylamine. SEM and TEM showed the structure and configuration of nano-urchins. XRD and FT-IR analysis confirmed that components of nano-urchins are nano-tubes, which V2O5 nanocrystals substitute for after sintering. Both the VOx-NUs and VOx-NUs-350 samples exhibited an excellent initial discharge specific capacity of about 400 mA h g−1 at a 100 mA g−1 current density between 1.5 and 4 V versus Li/Li+. However, the VOx-NUs-350 samples possessed outstanding cycling performance and a better capacity of 150 mA h g−1 after 50 cycles due to the removal of organic template.Acknowledgements
The authors gratefully acknowledge the financial support from the Shanghai Committee of Science and Technology (11nm0501300 and 13JC1408700), the National Natural Science Foundation of China (51472182, 51272179 and 51102183).Notes and references
- M. S. Whittingham, Chem. Rev., 2004, 104, 4271–4301 CrossRef CAS.
- X. L. Jia, L. Q. Zhang, R. F. Zhang, Y. F. Lu and F. Wei, RSC Adv., 2014, 4, 21018–21022 RSC.
- Z. L. Li, Q. Y. Zhu, S. N. Huang, S. S. Jiang, S. Lu, W. Chen and G. S. Zakharova, RSC Adv., 2014, 4, 46624–46630 RSC.
- B. Saravanakumar, K. K. Purushothaman and G. Muralidharan, RSC Adv., 2014, 4, 37437–37445 RSC.
- R. S. Devan, R. A. Patil, J. H. Lin and Y. R. Ma, Adv. Funct. Mater., 2012, 22, 3326–3370 CrossRef CAS PubMed.
- M. Shahid, D. S. Rhen, I. Shakir, S. P. Patole, J. B. Yoo, S. J. Yang and D. J. Kang, Mater. Lett., 2010, 64, 2458–2461 CrossRef CAS PubMed.
- J. Livage, Materials, 2010, 3, 4175–4195 CrossRef CAS PubMed.
- F. Sediri, F. Touati and N. Gharbi, Mater. Lett., 2007, 61, 1946–1950 CrossRef CAS PubMed.
- W. Chen, J. F. Peng, L. Q. Mai, Q. Y. Zhu and Q. Xu, Mater. Lett., 2004, 58, 2275–2278 CrossRef CAS PubMed.
- Y. G. Guo, J. S. Hu and L. J. Wan, Adv. Mater., 2008, 20, 2878–2887 CrossRef CAS PubMed.
- L. Q. Mai, L. Xu, C. H. Han, X. Xu, Y. Z. Luo, S. Y. Zhao and Y. L. Zhao, Nano Lett., 2010, 10, 4750–4755 CrossRef CAS PubMed.
- A. Q. Pan, H. B. Wu, L. Yu, T. Zhu and X. W. Lou, ACS Appl. Mater. Interfaces, 2012, 4, 3874–3879 CAS.
- H. Yu, X. Rui, H. Tan, J. Chen, X. Huang, C. Xu, W. Liu, D. Y. W. Yu, H. H. Hng, H. E. Hoster and Q. Yan, Nanoscale, 2013, 5, 4937–4943 RSC.
- Y. X. Tang, X. H. Rui, Y. Y. Zhang, T. M. Lim, Z. L. Dong, H. H. Hng, X. D. Chen, Q. Y. Yan and Z. Chen, J. Mater. Chem. A, 2013, 1, 82–88 CAS.
- H. H. Yin, K. Yu, Z. L. Zhang, M. Zeng, L. Lou and Z. Q. Zhu, Electroanalysis, 2011, 23, 1752–1758 CrossRef CAS PubMed.
- H. Fei, Y. Lin and M. Wei, J. Colloid Interface Sci., 2014, 425, 1–4 CrossRef CAS PubMed.
- M. Roppolo, C. B. Jacobs, S. Upreti, N. A. Chernova and M. S. Whittingham, J. Mater. Sci., 2008, 43, 4742–4748 CrossRef CAS PubMed.
- H. L. Fei, Z. R. Shen, J. G. Wang, H. J. Zhou, D. T. Ding and T. H. Chen, Electrochem. Commun., 2008, 10, 1541–1544 CrossRef CAS PubMed.
- C. O'Dwyer, V. Lavayen, S. B. Newcomb, E. Benavente, M. A. Santa Ana, G. Gonzalez and C. M. S. Torres, Electrochem. Solid-State Lett., 2007, 10, A111–A114 CrossRef PubMed.
- C. O'Dwyer, D. Navas, V. Lavayen, E. Benavente, M. A. Santa Ana, G. Gonzalez, S. B. Newcomb and C. M. S. Torres, Chem. Mater., 2006, 18, 3016–3022 CrossRef.
- Q. Song, H. C. Pang, W. T. Gong, G. L. Ning, S. Gao, X. L. Dong, C. J. Liu, J. Y. Tian and Y. Lin, RSC Adv., 2015, 5, 4256–4260 RSC.
- A. S. Arico, P. Bruce, B. Scrosati, J. M. Tarascon and W. Van Schalkwijk, Nat. Mater., 2005, 4, 366–377 CrossRef CAS PubMed.
- V. Lavayen, C. O'Dwyer, M. A. Santa Ana, S. B. Newcomb, E. Benavente, G. Gonzalez and C. M. S. TorreS, Phys. Status Solidi B, 2006, 243, 3285–3289 CrossRef CAS PubMed.
- M. Niederberger, H. J. Muhr, F. Krumeich, F. Bieri, D. Gunther and R. Nesper, Chem. Mater., 2000, 12, 1995–2000 CrossRef CAS.
- J. Wang, G. Gao, X. Zhou, J. Wu, H. Yang, Q. Li and G. Wu, J. Solid State Electrochem., 2014, 18, 2459–2467 CrossRef CAS PubMed.
- C. J. Cui, G. M. Wu, J. Shen, B. Zhou, Z. H. Zhang, H. Y. Yang and S. F. She, Electrochim. Acta, 2010, 55, 2536–2541 CrossRef CAS PubMed.
- X. Zhou, C. Cui, G. Wu, H. Yang, J. Wu, J. Wang and G. Gao, J. Power Sources, 2013, 238, 95–102 CrossRef CAS PubMed.
- F. Krumeich, H. J. Muhr, M. Niederberger, F. Bieri, B. Schnyder and R. Nesper, J. Am. Chem. Soc., 1999, 121, 8324–8331 CrossRef CAS.
- A. Surca and B. Orel, Electrochim. Acta, 1999, 44, 3051–3057 CrossRef CAS.
- C.-J. Cui, G.-M. Wu, H.-Y. Yang, S.-F. She, J. Shen, B. Zhou and Z.-H. Zhang, Electrochim. Acta, 2010, 55, 8870–8875 CrossRef CAS PubMed.
- M. Worle, F. Krumeich, F. Bieri, H. J. Muhr and R. Nesper, Z. Anorg. Allg. Chem., 2002, 628, 2778–2784 CrossRef.
- C. Cui, G. Wu, H. Yang, S. She, J. Shen, B. Zhou and Z. Zhang, Solid State Commun., 2010, 150, 1807–1811 CrossRef CAS PubMed.
| This journal is © The Royal Society of Chemistry 2015 |