Ricardo Jiménez*a,
Virginia Díeza,
Jesús Sanza,
Sofia D. Kobylianskab,
Oleg I. V'yunovb and
Anatolii G. Belousb
aInstituto de Ciencia de Materiales, ICMM-CSIC, C/Sor Juana Inés de la Cruz 3, 28049, Cantoblanco 3 Madrid, Spain. E-mail: riqjim@icmm.csic.es
bVernadsky Institute of General and Inorganic Chemistry, National Academy of Sciences of Ukraine, Palladine Ave32-34, 03680Kyiv 142, Ukraine
First published on 13th March 2015
Li0.5−yNayLa0.5Nb2O6 samples (y = 0–0.5) were synthesized by the solid-state reaction (SSR). Structural features of the ap × ap × 2ap perovskite series were investigated by X-ray diffraction (XRD), nuclear magnetic resonance (NMR) and density functional theory DFT simulation techniques. The location of La ions was assessed by Rietveld analysis of XRD patterns, and structural sites occupied by Li, Na and Nb ions investigated by MAS-NMR spectroscopy. In Li-rich samples, La and Li ions are preferentially located at z/c = 0 planes, but as the Na content increases, La and Na occupy both z/c = 0 and 0.5 planes. To analyze La and Li possible arrangements, different structural models have been considered in DFT simulations, confirming the cation ordering deduced from XRD patterns and the impediment of Na ions to move through square windows of the perovskite. The structural information deduced has been used to discuss transport properties deduced by Impedance Spectroscopy (IS). In Li rich samples, the La arrangement in alternating planes favors a 2D-dimensional Li conductivity. The incorporation of Na in two crystallographic planes reduces La ordering and increases Li conductivity. La disorder favours the change from 2D to 3D Li conductivity, which could explain the broad maximum detected in the Li conductivity as a function of the Na content.
In LLTO series, Li ions are located at unit cell faces of perovskites, making that the total amount of effective vacancy that participate in conduction, nt = [Li] + nv, increases.8,10 In LLTO samples, the substitution of Li by Na decreased slightly conductivity for low Na contents, but drastically when the amount nt approaches the 3D percolation threshold of conduction networks.10,11 Previous studies performed on Li conductivity of the Li0.5−yNayLa0.5Nb2O6 (LNLNO) series showed that the influence of Na was different, increasing Li conductivity for moderate Na substitutions9 before decreasing for larger ones. This anomalous behavior pointed to the possibility that the strong detrimental percolative effect, expected for Li substitution by Na, was not occurring in this series12 and cation vacancies played a different role.
Multinuclear 7Li and 23Na NMR spectroscopy is a useful technique to analyze mobility and structural sites occupied by atoms. In particular, the analysis of quadrupole interactions in MAS-NMR spectra of Li0.5−yNayLa0.5TiO3 allowed the identification of structural sites occupied by alkaline cations in LLTO perovskites.13 On the other hand, lithium exchange processes between structural sites afforded information about Li motion mechanisms in perovskites.14,15 In Li0.5−yNayLa0.5TiO3 (LLTO) series, 7Li MAS-NMR spectroscopy was finally used to determine the amount of Li that participate to long-range conductivity near the percolation threshold of vacancies.10
In this work, the dependence of Li conductivity on structural features of Li0.5−yNay La0.5Nb2O6 (y = 0–0.5) series has been investigated. Structural characteristics of perovskites will be first analyzed by X-ray and NMR; then Li mobility will be investigated by NMR and Impedance techniques. In these perovskites, niobium and lanthanum location was deduced by Rietveld analysis of XRD patterns. On the other hand, structural sites occupancy by alkaline and niobium atoms was investigated 7Li, 23Na and 93Nb MAS-NMR spectroscopy. DFT simulations were used to estimate possible cation ordering and octahedral tilting schemes, non accessible by XRD. Structural information deduced will be used to analyze the influence of vacancy/La ordering on Li conductivity of Li0.5−yNayLa0.5Nb2O6 series. The conclusions deduced here will be compared with those reported in LLTO series, where a change from 2D to 3D conductivity was detected for increasing Li contents.
Nominal composition | Experimental composition |
---|---|
Li0.5La0.5Nb2O6 | Li0.400La0.504Nb2O5.956 |
Li0.4Na0.1La0.5Nb2O6 | Li0.32Na0.067La0.506Nb2O5.952 |
Li0.3Na0.2La0.5Nb2O6 | Li0.24Na0.18La0.505Nb2O5.956 |
Li0.2Na0.3La0.5Nb2O6 | Li0.16Na0.28La0.504Nb2O5.976 |
Li0.1Na0.4La0.5Nb2O6 | Li0.08Na0.375La0.503Nb2O5.982 |
Li0.07Na0.43La0.5Nb2O6 | Li0.06Na0.414La0.503Nb2O5.993 |
Li0.04Na0.46La0.5Nb2O6 | Li0.038Na0.449La0.503Nb2O5.996 |
Li0.02Na0.48La0.5Nb2O6 | Li0.017Na0.46La0.503Nb2O5.993 |
After preparation, ceramics samples were dissolved to perform chemical analyses.17 Lithium content was deduced by absorption spectroscopy, lanthanum by complexometry, and niobium determined gravimetrically by precipitation with ammonia. According to these analyses some amount of lithium was always lost in preparation of samples.
The crystalline phases were identified by X-ray powder diffraction (XRD) technique. For that, XRD patterns were recorded at room temperature on a DRON-4-07 apparatus (Cu Kα radiation; 40 kV, 18 mA) in the 10–120° 2θ range with a Δ2θ = 0.02° step and an exposure time of 6 s per point. Unit cell parameters were determined by using the Le Bail technique and structural refinements performed with the Rietveld method (Fullprof program).18
Taken into account small scattering factors of oxygen atoms, octahedral tilting schemes associated to different arrangements of La/(Li,Na) cations were investigated with DFT techniques (CASTEP software).19 The use of Density Functional Theory (DFT) code, which employs the gauge including the projector augmented wave (GIPAW)20 algorithm, enabled the reconstruction of all-electron wave functions. The Generalized Gradient Approximation (GGA) PBE21 functional was used and core–valence interactions described by ultrasoft reported pseudo-potentials.22
Structural parameters (unit cell and atomic positions) deduced by XRD in ICSD 180636 (for LaNaNbO) and 99312 (for LaLiNbO) were used for DFT calculations. The crystal structure was reproduced by using periodic boundary conditions. In simulations, different super-lattices, compatible with cation distributions, were considered. For optimization of atomic positions, numerical integrals were performed over the Brillouin zone, using a Monkhorst–Pack grid with a k-point spacing of 0.04 Å−1. Wave-functions were expanded in plane waves with a kinetic energy smaller than the cut-off energy, 1200 eV.
93Nb, 23Na and 7Li MAS-NMR spectra were recorded at 97.94, 105.8 and 155.51 MHz in a MSL-400 spectrometer. Samples were rotated at 12 kHz around an axis inclined 54°44′ with respect to the external 9.4 T magnetic field (MAS technique). NMR spectra were recorded after 3 μs single pulse irradiation and 10 s recycling. The number of accumulations was 100, 50 and 50 in Nb, Na and Li NMR spectra. NMR components were referred to external Nb(O)Cl3, NaCl and LiCl references. The WinFit program was used for NMR spectra deconvolution. To analyze spinning sideband patterns, more enlarged spectral regions and filters (1 MHz) than used in central components (100 kHz), were considered.
The electrical properties of ceramic samples as a function of temperature were investigated by Impedance Spectroscopy (IS) in the frequency range 20 Hz to 1 MHz, using an Agilent E4192A analyzer. For low frequency measurements (1 mHz to 10 kHz) a Zhaner IM6ex apparatus was used. The pellets used in electric determinations were 0.9 ± 0.1 cm in diameter and 0.3 ± 0.02 cm in thickness. Electrical contacts (gold paste) were deposited on the larger surfaces of the pellets and heated at 1125 K. The electronic conductivity measured at 570 K and 0.5 V was 0.05% of the total conductivity. To get more accurate values of the conductivity dispersion, the samples were also measured at room temperature between 1 MHz and 3 GHz using an E4991A Impedance materials analyzer.
y | 0 | 0.1 | 0.2 | 0.3 | 0.4 | 0.43 | 0.46 | 0.48 | 0.5 |
---|---|---|---|---|---|---|---|---|---|
Unit cell parameters | |||||||||
a, Å | 3.9002(1) | 3.903(8) | 3.906(8) | 3.915(1) | 3.915(9) | 3.923(1) | 3.918(1) | 3.9167(8) | 3.925(1) |
b, Å | 3.9005(2) | 3.904(7) | 3.907(8) | 3.912(1) | 3.915(9) | 3.9311(6) | 3.923(1) | 3.9304(7) | 3.9278(6) |
c, Å | 7.8521(2) | 7.854(2) | 7.852(1) | 7.861(1) | 7.861(1) | 7.850(2) | 7.860(2) | 7.846(2) | 7.848(3) |
V, Å3 | 119.452(6) | 119.7(3) | 119.8(4) | 120.40(5) | 120.5(2) | 121.07(5) | 120.79(6) | 120.78(4) | 120.98(6) |
![]() |
|||||||||
Coordinates of ions | |||||||||
Nb, z/c | 0.2580(2) | 0.254(2) | 0.256(1) | 0.256(1) | 0.259(1) | 0.2527(8) | 0.2551(9) | 0.2582(9) | 0.251(1) |
O3, z/c | 0.232(1) | 0.24(2) | 0.30(4) | 0.26(2) | 0.3(3) | 0.28(1) | 0.26(4) | 0.260(6) | 0.29(4) |
O4, z/c | 0.232(1) | 0.21(2) | 0.28(4) | 0.29(2) | 0.3(3) | 0.29(1) | 0.26(4) | 0.272(7) | 0.28(4) |
![]() |
|||||||||
Site occupancies (La) | |||||||||
z = 0 | 0.487(2) | 0.450(9) | 0.424(8) | 0.362(9) | 0.360(9) | 0.349(8) | 0.349(9) | 0.345(7) | 0.260(9) |
z = 1/2 | 0.017(2) | 0.056(9) | 0.081(8) | 0.142(9) | 0.143(9) | 0.154(8) | 0.154(9) | 0.158(7) | 0.243(9) |
![]() |
|||||||||
Agreement factors | |||||||||
Rf, % | 9.14 | 6.42 | 6.98 | 5.92 | 5.36 | 7.36 | 6.30 | 5.94 | 6.40 |
Rexp, % | 6.98 | 8.62 | 9.15 | 9.78 | 8.36 | 5.01 | 4.84 | 4.18 | 8.96 |
Taken into account small intensity of super-lattice reflections, the orthorhombic ap ≈ ap × 2ap unit cell (Pmmm S.G.) was retained to analyze XRD patterns. Atomic coordinates of Li0.5La0.5Nb2O6 perovskite25 were used as starting model in Rietveld refinements. In this model, La occupy 1a (000), Nb 2t (1/2 1/2 z), O(1) 1f (1/2 1/2 0), O(2) 1h (1/2 1/2 1/2), O(3) 2s (1/2 0 z), O(4) 2r (0 1/2 z) and vacancies 1c (0 0 1/2) sites. In Fig. 1b, different occupancy of z = 0 and z/c = 1/2 planes is illustrated.
The Rietveld analysis of the Li0.5La0.5Nb2O6 series indicates that La ions occupy preferentially z/c = 0 planes in Li-rich samples, but they are randomly distributed in Na rich samples. As a consequence of the La-vacancy ordering, Nb atoms are shifted from the centre of octahedra. In Na-rich samples, La was disordered in z/c = 0 and 1/2 planes. In structural analyses, location of Li and Na ions was difficult to deduce, requiring NMR to investigate sites occupation and DFT technique to deduce structural features.
![]() | ||
Fig. 2 93Nb MAS-NMR spectra of Li0.5−yNayLa0.5Nb2O6 perovskites, y = 0.2, y 0.5, where spinning sidebands of two detected components are indicated. |
23Na (I = 3/2) MAS-NMR spectra are formed by three quadrupole transitions, modulated by spinning side bands. In Na-rich samples (y = 0.5), sidebands corresponding to three transitions were detected; however, only the central 1/2, −1/2 transition was detected in Li doped samples (Fig. 3a). In Na rich members, the central transition was appreciably narrowed, indicating that Na sites at z/c = 0 and 1/2 planes display similar characteristics (Fig. 3b). In y = 0.3 sample, the maximum disorder was produced around Na cations, enlarging considerably central transitions. In this spectrum (y = 0.3), the presence of two Na signals, probably associated with two structural planes, was deduced.
![]() | ||
Fig. 3 (a) 23Na MAS-NMR spectra of Li0.5−yNayLa0.5Nb2O6 (y = 0.2, 0.46, 0.5) perovskites. (b) Central transition of analyzed samples. |
7Li (I = 3/2) MAS-NMR spectra are formed by three transitions, modulated by spinning sidebands of samples rotation (Fig. 4). In this figure, it was observed that line width of the central transition and intensity of sidebands decrease as a consequence of Li mobility (Fig. 4a). In all cases, intensities of detected bands do not correspond to the quadrupole profile of a single component. In Fig. 4b, the presence of two components required to reproduce static and MAS spectra is illustrated. The spectra deconvolution of perovskites was based on the existence of two Li species with different mobility. In Na-doped samples the amount of mobile Li species is considerably higher than in Li-rich members.
In Fig. 4c, relative intensities of narrow (line 1) and broad (line 2) components of the sample Li0.5La0.5Nb2O6 are plotted as a function of temperature. The progressive decrease of line-width observed in 7Li MAS-NMR spectra of Na-doped samples must be related to the increment of Li mobility. On the contrary, the 23Na line-width of the central transition of Li0.07Na0.43La0.5Nb2O6 does not change appreciably with temperature, indicating that Na display a lower mobility than Li cations (Fig. 5). This difference must be related to Na+ radius that impedes diffusion of Na ions to pass through square windows that relate contiguous A-sites of the perovskite.
![]() | ||
Fig. 5 Variation of the central transition of 23Na MAS-NMR spectra as a function of temperature in Li0.5−yNayLa0.5Nb2O6, y = 0.43, perovskite. |
In the Na-rich member Na0.5La0.5Nb2O6, ordered lines or chessboard arrangements were again considered. In the case of linear arrangement of La and Na, the tilting was ±4° around b-axis; but in the chessboard arrangement no appreciable tilting was detected. In Na phases, octahedra are much less distorted than in Li ones. In both cases, apical Nb–O distances are 1.94 and 2.01 Å while equatorial distances near 1.98 Å. In both models, apical oxygens have −0.67 and −0.71 and equatorial ones near 0.70 charges.
To simulate La/Na disordering, a bigger 2ap,2ap,4ap super-cell (P4/mmm S.G.) was considered. The optimized structure showed similar Na coordinations in z/c = 0 and 1/2 planes and negligible octahedral tiltings. In this model, all Nb–O distances were between 1.97 Å and 2.02 Å. The charge of oxygen atoms were near −0.71 charges. Compared with XRD results the gradual disappearance of the super-cell reflections on increasing the Na substitution is in agreement with the strong La/Na disordering deduced by DFT simulations in the pure Na perovskite. From these simulations, it must be concluded that all ordered models display similar energy values. In order to get more conclusive results on cation/vacancy ordering, structural techniques sensitive to light atoms should be used.
In 93Nb MAS-NMR spectra, nine quadrupolar transitions should be observed; however, only the central 1/2, −1/2 transition was detected. This effect must be ascribed to cation disorder produced around Nb cations, Fig. 2. The analysis of 93Nb NMR spectra suggests the existence of one component in Na rich members, but several ones (at least two) in Li rich samples. This information agrees with that deduced from DFT calculations that showed that Nb–O distances differ more in Li- than in Na-rich phases. In Li-rich samples, the location of La in alternate planes produces the shift of Nb ions towards vacant-rich planes; however, in Na-rich samples the simultaneous occupation of z/c = 0 and 1/2 planes by La and Na cations reduces octahedral distortions and only one 93Nb component was detected. From this fact, differences on the Nb shift along the c-axis (structural disorder) seems to be the reason for additional Nb components.
DFT simulations were oriented to investigate different La/(Li,Na) arrangements in perovskites. In the Li-rich member Li0.5La0.5Nb2O6, the alternation of La and Li arrows in z/c = 0 planes (2ap × ap × 2ap), produces octahedral tilting is near ±10° and rhombic distortion of square windows. In chessboard La, Li configurations (2ap × 2ap × 2ap), octahedral tilting should be considerably reduced. Despite DFT results are not conclusive, the existence of La ordering in alternate planes (c = 2 ap) always produces the shift of Nb atoms, favoring a 2D conductivity. Taken into account the square window size, Li motion is favored with respect to that of Na ions, making that only Li ions must be considered to explain transport properties.
In Na-rich Li0.5La0.5Nb2O6 sample, 23Na MAS-NMR spectra showed the presence of quadrupole transitions, characteristic of well defined interactions of Na ions with the perovskite network oxygens. The detection of a single component indicates that two structural sites occupied by Na ions display similar characteristics. When Na content decreases, quadrupole interactions decrease because Li mobility averages electrical field anisotropies detected by Na ions. The decrease on the residence time on Li sites is responsible for cancellation of quadrupolar 7Li interactions. For intermediate compositions, the spectral broadening detected suggest the partial occupation of z/c = 0 and 1/2 by Na cations. In Li-rich samples, the narrowing of the shifted Na component suggests that Na ions preferentially occupy the vacancy-rich plane.
Li conductivity and activation energy deduced for Li0.5La0.5Nb2O6 are similar to those reported previously for the same composition (1 × 10⁻⁵ S cm−1 and 0.37 eV).27 The study of the temperature dependence of NMR relaxation T1 and T2 times showed the presence of two Li motions that were assigned to fast motions inside A-cavities and slow motions between contiguous A-cavities.28 In our work, 7Li NMR spectra show the presence of two types of lithium that display different mobility (Fig. 4b). Taken into account structural features of analyzed compounds, the existence of two components could be tentatively assigned to Li motions in vacancy-rich (z/c = 1/2) and La-rich (z/c = 0) planes. A 2D-mobility was also invoked by Latie and col. to explain NMR relaxation in LixLn1/3 Nb1−xTixO3 series.29
In Li-rich Li0.5La0.5Nb2O6 sample, the line-width of two 7Li MAS-NMR components is different indicating that Li ions display lower mobility in z/c = 0 (La-rich) planes than in z/c = 0.5 (vacancy rich) planes. The fraction of mobile Li is about 30% of the total one, see Fig. 4c. If it is supposed that mobile Li is located at the vacancy rich plane (z/c = 1/2), the measured Li conductivity should be close to that of La0.6Li0.2TiO3.10 The low Li conductivity measured in Li0.5La0.5Nb2O6 (6.85 10−6 S cm−1) discards this possibility. From this fact, a restricted Li conductivity in La rich planes (z/c = 0 planes) can be assumed.
In the z/c = 0 plane, the calculated amount of effective vacancies nt = Li+ vacancy remains below the 2D percolation np threshold (0.5 ≤ np ≤ 0.59), what should decrease Li conductivity below values detected experimentally. However, measured conductivity values are significant, indicating that the amount of vacancies that participate in Li conduction is higher than considered. Additional vacancies can be produced by La disordering in z/c = 0 and z/c = 1/2 planes. The partial occupation of z/c = 1/2 planes was deduced by Rietveld analysis of Li-rich samples, making to increase nt values above 0.5 in z/c = 0 planes (Table 2).
The existence of the two 7Li MAS-MNR components, one mobile and one less mobile has been previously related to Li atoms in z/c = 0 and z/c = 1/2 planes. The amount of effective vacancy is very close to the percolation threshold for 2D networks in z/c = 0 planes, making that only a fraction of the total Li can participate in the long range mobility. In this situation, most of the Li stay a large residence time in structural sites (broad MNR line component) and only a small amount of Li diffuse along percolated paths. This scenario is supported by the increment of the relative amount of the La fraction in the z/c = 1/2 plane and vacancy in z/c = 0 planes, conferring a more isotropic character to Li conductivity on increasing the Na fraction.
Structural information deduced in Li0.5−yNayLa0.5Nb2O6 series suggests that Li conductivity changes from 2D (z/c = 1/2) to 3D (z/c = 0 and 1/2 planes) when the Na content increases. However, this change does not affect much “bulk” dc-conductivity that always remains near 10−6 S cm−1, Fig. 6b. This behavior differs considerably from that reported in Na-LLTO perovskites, where incorporation of Na decrease drastically Li conductivity near the percolation threshold.14,15 In the series analyzed here, no percolation-controlled phenomena were detected because the important amount of vacant A-sites.
In the analyzed series, the change of La ordering, induced by the increasing Na content, must be related to small effect observed in conductivity. To understand the effect of the Na incorporation on the “bulk” dc-conductivity, the analysis of pre-exponential factors has been performed.
In general, pre-exponential σ0 factors are proportional to:30
σ0αNc(1 − c)[(nt − np)/(nT − np)]t | (1) |
In expression (1), Nc(1 − c) values provide information about the probability of the lithium hopping between neighboring sites, and Peff = [(nt − np)/(nT − np)]t takes into account the percolation efficiency in diffusion paths (0 ≤ Peff ≤ 1). The exponent, t, and the percolation threshold, np, changes with conduction dimensionality, going from np ≥ 0.50 and t ≈ 1.33 (two-dimensional) to np ≥ 0.31 and t ≈ 2 for three-dimensional networks.10 For Li mobility restricted to z = 0 planes the maximum number of sites is 1 but when mobility is extended to both planes, nT increases to 2.
From Rietveld analysis, different structural parameters can be estimated as a function of the Na fraction. In Fig. 7a the evolution of Nc(1 − c) vs. Na fraction is considered in 2D (z/c = 0 planes) and 3D (z/c = 0 and z/c = 1/2 planes involved) regimes. The main difference was detected for low f(Na) values: in 2D regime, the Nc(1 − c) factor increasing as a consequence of the increment of vacancy in z/c = 0 planes, induced by Na occupation of z/c = 1/2 planes. In this case, the amount of efficient vacancies is given by nt = 1/3 + ΔLa + [Li]/3, where ΔLa stands for La occupation of z/c = 1/2 planes. In Li0.5La0.5Nb2O6 composition, a minimum La disorder is required (ΔLa = 0.013) to explain measured Li conductivity. For higher Na fractions, Nc(1 − c) decreases as a consequence of the lower occupancy of z/c = 0 planes by lithium. In the 3D regime, the random distribution of La, Li, and Na ions and vacancies is produced, improving considerably Nc(1 − c) values. In the random case, nt = 1.3 + [Li]/3 − 2[Na]/3. On increasing the Na content, the Nc(1 − c) factor decreases. It is interesting to note that for highest Na concentrations, expected Nc(1 − c) for 2D and 3D regimes merge to common values.
![]() | ||
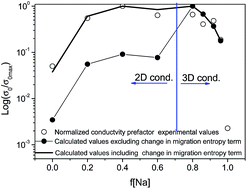
Fig. 7 Calculations of pre-exponential values for 2D and 3D regimes. Red lines and symbols stand for 3D and black lines and symbols stand for 2D regimes. Dependences of: (a) the Nc(1 − c) factor. (b) The percolation efficiency [(nt − np)/(nT − np)]t. (c) The normalized conductivity values deduced from expression (1). (d) Normalized pre-exponential factors. Hollow symbols stand for experimental data, and black circles for values calculated with eqn (1) and normalized factors. Upper continuous line stands for calculated values including the corresponding increment in migration entropy produced along the 2D to 3D regime change. |
The evolution of the percolation efficiency Peff with Na fraction values is analyzed in Fig. 7b. In 2D regime, Peff increases up to f = 0.6, (Na ion incorporated at the z = 1/2 plane) decreasing considerably above this value. For f 0.8, the system becomes sub-percolated (nt < np), and 2D conductivity is not possible, (Peff = 0). In 3D regime, the percolation efficiency is about two orders of magnitude larger than in 2D regime, because the amount of vacancy always remain well above the percolation threshold, making that Na content not to affect strongly conductivity values.
Results deduced from the eqn (1), once normalized to maximum 2D and 3D values, are plotted in Fig. 7c. In this plot it can be inferred that 2D predictions reproduces well experimental results below f = 0.6, and 3D predictions, those above 0.7. Based on this fact, it is possible to calculate the eqn (1), taking into account the proposed change of dimensionality as produced at f[Na] ∼ 0.7. In Fig. 7d, calculated and experimental values display similar values for high Na content but calculated ones are below experimental results for 2D regime. As observed in Fig. 7b, Peff is very different in 2D and 3D regimes. The Li changes from a restricted mobility along z/c = 0 planes in ordered samples to an easy 3D mobility in disordered samples. The change produced across 2D to the 3D transition must have an important effect on the migration entropy. In order to reproduce properly experimental results, the eqn (1) had to consider the migration entropy associated with the effective attempt frequency (ωe). Using the Almond and West formalism30 ωe can be expressed as:
ωe = ω0![]() | (2) |
making that expression (1) adopt the form:
σ0 = Nc(1 − c)[(nt − np)/(nT − np)]tωe | (3) |
The scenario proposed to explain conductivity is also responsible for the evolution of activation energy depicted in Fig. 6c, where Ea increases up to f = 0.6 and then decreases to a minimum for f = 0.9. The increment detected above f = 0.9, was ascribed to low Li contents that impede long-term Li conductivity.
Additional evidences for the suggested change in dimensionality can be found in the analysis of the frequency dispersion of the conductivity. It has been proposed that a dimensionality change affects dispersion exponent n values of the “bulk” a.c. conductivity (σac):
σac = σdc[1 + (ω/ωp)n] | (4) |
The analysis of conductivity allows us to suggest that Li conductivity in Li0.5−yNayLa0.5Nb2O6 is affected by two competing factors. For Li-rich samples, incorporation of sodium increases cation disorder and favors the simultaneous Li and La occupation of z/c = 0 and 1/2 planes, with the resulting 2D to 3D regime change. This change makes the activation energy to decrease and pre-exponential factor to increase, not affecting considerably Li conductivity. In Na-rich samples with f values higher than 0.9, activation energy increase and conductivity decrease as a consequence of low Li contents. Finally, f = 1 sample showed ionic conductivity that should be related to the presence of a small amount of mobile Na ions.
La occupation of z/c = 0 and 1/2 planes was deduced from XRD Rietveld refinements, and distribution of Li, Na and Nb ions assessed by MAS-NMR spectroscopy. In Li rich samples, La and Li ions, are preferentially disposed in alternate planes along the c-axis (2D conductivity). As the Na content increases, La and Na cations occupy z/c = 0 and 1/2 planes and vacancies becomes disordered that can increase the conductivity dimensionality (3D conductivity).
In Li rich samples, the vacancy disorder increases, increasing activation energy and Li conductivity (2D regime) when Na content increases. In Na-rich samples the increased disorder can lead to a (3D regime), activation energy increasing and total conductivity decreasing. The cation disorder produced along the proposed 2D to 3D transformation would explain the broad conductivity maximum detected at intermediate compositions. To explain observed results, large changes in the migration entropy must be produced along the transformation, that should be related to the change from and ordered to a disordered cation distribution.
This journal is © The Royal Society of Chemistry 2015 |