DOI:
10.1039/C5RA02325D
(Paper)
RSC Adv., 2015,
5, 30192-30196
The effect of carbon black in carbon counter electrode for CH3NH3PbI3/TiO2 heterojunction solar cells
Received
23rd February 2015
, Accepted 23rd March 2015
First published on 23rd March 2015
Abstract
Carbon counter electrodes (CCEs) based on pure flaky graphite, pure carbon black and graphite/carbon black composites were respectively applied in mesoscopic CH3NH3PbI3/TiO2 heterojunction solar cells. Crystallinity, conductivity and current–voltage characteristics were measured to study the influence of carbon black in the graphite/carbon black CEs on the perovskite crystal and the photovolatic performance of the devices. Results showed that the content of carbon black in the CCEs could significantly affect the crystallinity and uniformity of the perovskite crystal, leading to different photovolatic performance of the devices. The device with the optimized content of carbon black showed an efficiency of 7.08%, which was much higher than the efficiency of 2.75% obtained by the device based on graphite CE without carbon black.
Introduction
In the past few years, lead halide perovskite solar cells have experienced the fastest increase in reported efficiencies ever achieved for any photovoltaic technology. In their early development, lead halide perovskite solar cells were fabricated with liquid electrolyte and showed low efficiencies.1,2 In 2012, the first solid-state perovskite solar cell with an impressive efficiency of 9.7% was reported.3 Soon after, much effort was devoted to developing solid-state perovskite solar cells.4–7 Up to now, efficiencies over 15% have been obtained by many groups, 8–12 which make them a promising candidate of the next generation photovoltaic technology. However, the conventional counter electrodes (CEs) of perovskite solar cells are fabricated with noble metals under high vacuum conditions, which significantly increase the overall cost of the devices. Therefore, it is worth developing cost-effective CEs for perovskite solar cells. In 2013, Han's group reported using a carbon counter electrode (CCE) to fabricate a CH3NH3PbI3/TiO2 heterojunction solar cell, which showed a PCE of 6.64%.13 In that work, CH3NH3PbI3 was directly deposited in a TiO2/ZrO2/C triple layer scaffold from CH3NH3I and PbI2 precursor solution. In 2014, a novel mixed-cation perovskite (5-AVA)x(MA)1−xPbI3 was filled into a TiO2/ZrO2/C scaffold and an impressive PCE of 12.84% was achieved for perovskite solar cells based on this CCE.14 Also perovskite solar cells based on CCEs using flaky graphite with different sizes were reported.15 Usually, the CCEs are made by screen-printing or doctor-blading technique with graphite and carbon black as the main components.16,17 Compared with conventional noble metal CEs, CCEs are more cost-effective due to their cheaper materials and easier processing methods. Moreover, because perovskite crystals form directly in a mesoscopic TiO2/ZrO2/C scaffold for perovskite solar cells based on CCEs, the structure of the CCE films directly affect the particle size and uniformity of perovskite crystal,13,15 which have great influence on the photovoltaic performance of perovskite solar cells.18 Although CCE is a promising candidate for perovskite solar cells, few relevant studies on CCE for perovskite solar cells were reported. In this work, we studied the effect of carbon black in graphite/carbon black composite CEs on the photovolatic performance for mesoscopic CH3NH3PbI3/TiO2 heterojunction solar cells. The crystallinity and uniformity of perovskite crystals deposited on different CCEs based on flaky graphite, amorphous carbon black and graphite/carbon black composite were investigated respectively. For devices, current–voltage characteristics measurements were carried out to study the influence of the carbon black on the device performance. Results showed that carbon black in CCEs could weaken the crystallinity of CH3NH3PbI3 crystal and improve the uniformity of the perovskite film, leading to increased photovolatic performance.
Experimental
Fabrication of carbon pastes
Graphite paste: 2 g flaky graphite powder (8000 mesh) and 0.2 g ethyl cellulose were added into 10 g terpineol. Carbon black paste: 2 g carbon black powder (30 nm) and 0.2 g ethyl cellulose were added into 10 g terpineol. Graphite/carbon black paste (20% content of carbon black): 1.6 g graphite powder, 0.4 g carbon black powder and 0.2 g ethyl cellulose were added into 10 g terpineol. All the three mixture were followed by ball milling for 2 h.
Fabrication of mesoscopic perovskite solar cells
The fluorine-doped SnO2 substrates were etched with laser to form two detached electrode pattern before being cleaned ultrasonically cleaned with detergent, deionized water and ethanol respectively. After that the patterned substrates were coated with a 100 nm compact TiO2 layer by aerosol spray pyrolysis at 450 °C. Then a 1 μm nanoporous TiO2 layer was deposited on the compact TiO2 layer by screen printing with a TiO2 slurry and sintered at 500 °C for 30 min. And then, a ZrO2 layer and a carbon film were printed on the top of the nanoporous TiO2 layer successively, and sintered at 400 °C for 30 min, forming a porous TiO2/ZrO2/C scaffold. The thicknesses of ZrO2 layer and carbon layer were around 1 μm and 5 μm respectively. Finally, a 20 μl CH3NH3PbI3 precursor (0.1 g CH3NH3I and 0.29 g PbI2 were mixed in 1 mL γ-butyrolactone) was dipped on the top of each TiO2/ZrO2/C scaffold. Finally, the substrates were dried at 60 °C for 20 min in air under dark, resulting in the completion of devices.
Characterization
The cross section of the devices and the top views of different CCEs were imaged by a field-emission scanning electron microscope (FE-SEM). The XRD spectra of the prepared films were tested by a X-ray diffraction system (85 PANalytical Empyrean, Cu Kα radiation; λ = 1.5418 Å). The square resistances of CCEs with different contents of carbon black were tested by four-probe measurement. Current–voltage characterization was performed using a Keithley 2400 source meter under simulated AM 1.5 sunlight illumination (100 mW cm−2) provided by an Oriel solar simulator (Model 9119X, Newport Co.). The illuminated active area of photovoltaic measurements was 0.13 cm−2. Incident photon-current conversion efficiency (IPCE) was recorded on a DC Power Meter (Model 2931-C, Newport Co.) under irradiation of a 300 W xenon lamp light source with a motorized monochromator (Oriel). The xenon lamp was powered by an Arc Lamp Power Supply (Model69920, Newport Co.).
Results and discussion
Structure of TiO2/CH3NH3PbI3 heterojunction perovskite solar cells based on CCEs
Fig. 1a shows a schemed structure of a TiO2/CH3NH3PbI3 heterojunction perovskite solar cell based on CCE where nanoporous TiO2 layer, ZrO2 insulating layer and carbon layer were screen-printed on FTO/compact TiO2 substrate layer by layer. CH3NH3PbI3 was filled in the pores of TiO2/ZrO2/C triple layer films by one-step solution method from PbI2 and CH3NH3I precursor. Fig. 1b shows the energy levels of TiO2, CH3NH3PbI3 and C respectively. Fig. 2a and b show the SEM cross section of a TiO2/CH3NH3PbI3 heterojunction perovskite solar cell and its high magnification TiO2/CH3NH3PbI3 layer, respectively. In Fig. 2a, it is clear that 1 μm TiO2 layer, 1 μm ZrO2 layer and 5 μm carbon layer are ordinarily deposited on the surface of FTO glass. From Fig. 2b, we could see that CH3NH3PbI3 is filled in the pores of nanoporous TiO2, and the bright region and dark region represent TiO2 and CH3NH3PbI3 respectively.
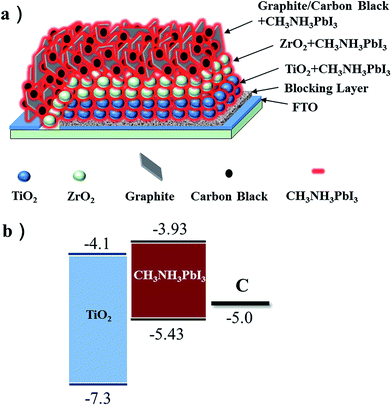 |
| | Fig. 1 (a) A schemed structure of CH3NH3PbI3/TiO2 heterojunction solar cells based on CCE. (b) The corresponding energy levels of TiO2, CH3NH3PbI3 and carbon. | |
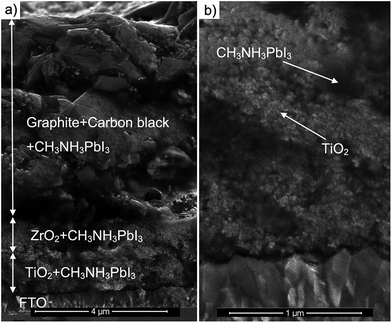 |
| | Fig. 2 (a) The SEM cross section of a TiO2/CH3NH3PbI3 heterojunction perovskite solar cell based on CCE. (b) The high magnification TiO2/CH3NH3PbI3 layer. | |
Characterization of CH3NH3PbI3 crystal deposited on different carbon films
We deposited three different carbon films on glasses by screen-printing with graphite paste, carbon black paste, and graphite/carbon black paste respectively. After sintering at 400 °C for 30 min, the thicknesses of the films were around 5 μm. Then a precursor solution of PbI2 and CH3NH3I was dropped on each of the three different carbon films and dried at 60 °C to forming CH3NH3PbI3 perovskite crystal. Fig. 3a–c show the SEM sections of the three carbon films respectively. The particle sizes of flaky graphite distribute from hundreds of nanometres to several microns (Fig. 3a) and the particle size of carbon black is tens of nanometres (Fig. 3c). Fig. 3d–f show the SEM section of CH3NH3PbI3 perovskite crystals deposited on the three different carbon films respectively. From Fig. 3d we could see that CH3NH3PbI3 deposited on graphite film show inhomogeneous morphology and show wide crystallite sizes distribution from hundreds of nanometres to several microns. From Fig. 3e and f we could see that CH3NH3PbI3 deposited on carbon films containing carbon black show uniform and compact crystalline film, and no large crystallite was observed. This could be attributed that the nanoporous structure of carbon black limited the growth of CH3NH3PbI3 crystal.
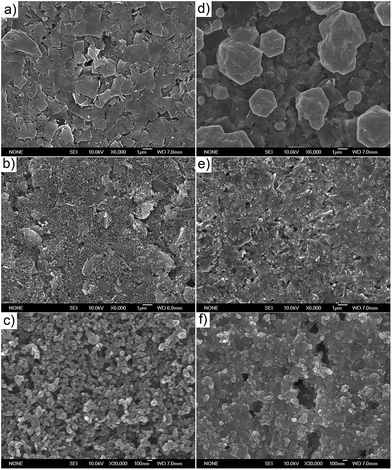 |
| | Fig. 3 (a–c) Top view SEM images of bare CCEs based on graphite, graphite/carbon black and carbon black, respectively. (d–f) Top view SEM images of the three corresponding CCEs infiltrated with CH3NH3PbI3 from precursor solution of PbI2 and CH3NH3I. | |
In order to understand the effect of carbon black in CCEs on the crystallinity of CH3NH3PbI3 perovskite crystal, we carried out X-ray diffraction (XRD) patterns of CH3NH3PbI3 deposited on the three carbon films and on bare glass, which were compared in Fig. 4. The diffraction peaks near 27° and 55° are the main characteristic peaks of flaky graphite. The diffraction peaks at the lattice planes of (110), (220), (310), (224) and (314) are the main characteristic peaks of CH3NH3PbI3 deposited on bare glass. Among the three carbon films, CH3NH3PbI3 deposited on carbon black film show the weakest diffraction intensities at most of the main characteristic peaks. And the diffraction intensities of CH3NH3PbI3 on carbon black film are even weaker than that on bare glass. This could be attributed that the nanoporous structure of carbon black could limit the growth of PbI2 and CH3NH3PbI3 successively, resulting in decreased crystallinity. And among the three carbon films, CH3NH3PbI3 deposited on graphite film show the strongest diffraction intensity at most of the main characteristic peaks. This is consistent with the large particle size of CH3NH3PbI3 on graphite film which could be seen from Fig. 3d. Compared with CH3NH3PbI3 on graphite film, CH3NH3PbI3 on graphite/carbon black film exhibit decreased diffraction intensity at most of the characteristic peaks except the peak of (100). The decreased diffraction intensity of CH3NH3PbI3 for graphite/carbon black film could be due to the limitation effect of the nanoporous structure of carbon black.
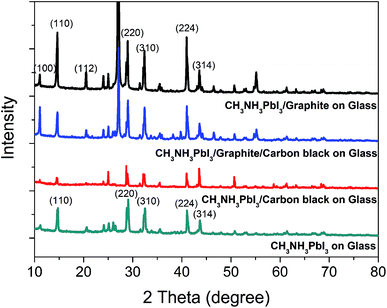 |
| | Fig. 4 XRD patterns of CH3NH3PbI3 deposited on three carbon CCEs based on graphite, graphite/carbon black and carbon black and CH3NH3PbI3 deposited on bare glass is also displayed. | |
Characterization of devices with different contents of carbon black in CCEs
The photocurrent density–voltage curves of TiO2/CH3NH3PbI3/C devices with different contents of carbon black in CCEs are displayed in Fig. 5. The photovoltaic performance of devices with different contents of carbon black in CCEs are displayed in Table 1. The device based on pure graphite CE showed poor photovoltaic characteristics with open-circuit voltage (Voc), short-circuit current density (Jsc), fill factor (FF) and power conversion efficiency (PCE) of 753 mV, 6.96 mA cm−2, 0.53 and 2.75% respectively. The photovoltaic performances of devices were improved with the increase of carbon black contents in CCEs. When 10% content of carbon black was induced into CCEs, Voc, Jsc and PCE of the device were increased to 844 mV, 12.45 mA cm−2 and 5.54% respectively. The best performance of the devices was obtained when the contents of carbon black was 20% in CCEs, which exhibited a Voc of 867 mV, a Jsc of 15.24 mA cm−2 and an efficiency of 7.08%. However, when the contents of carbon black were further increased, the efficiencies of devices were decreased. The device with 30% content of carbon black showed a Voc of 871 mV, a Jsc of 14.34 mA cm−2, a FF of 0.52 and a PCE of 6.44%. And the device based on pure carbon black CE obtained a Voc of 839 mV, a Jsc of 9.85 mA cm−2 and a FF of 0.30, resulting in a poor efficiency of 2.46%. The improved performances for devices with low contents of carbon black in CCEs could be attributed to the improved uniformity of perovskite film, which was subsequently critical to efficient perovskite solar cells.11 The poor performance for device with 100% content of carbon black in CCEs could be due to the poor conductivity of pure carbon black CEs since poor conductivity of CEs could directly lead to low FF value for the device.19
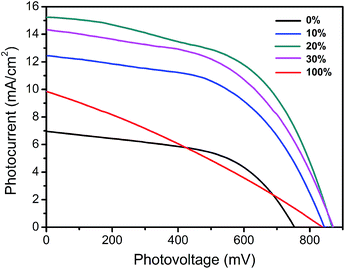 |
| | Fig. 5 Photocurrent density–voltage curves of devices based on CCEs with different contents of carbon black under standard simulated AM 1.5 illumination of 1000 W m−2. | |
Table 1 Photovoltaic performance of TiO2/CH3NH3PbI3/C devices with different contents of carbon black in CCEs under AM 1.5 conditions 100 mW cm−2. The thickness of TiO2, ZrO2 and C films are ∼1 μm, ∼1 μm and ∼5 μm respectively
| Contents (wt%) |
Jsc/mA cm−2 |
Voc/mV |
FF |
PCE (%) |
| 0% |
6.96 |
753 |
0.53 |
2.75 |
| 10% |
12.45 |
844 |
0.53 |
5.54 |
| 20% |
15.24 |
867 |
0.54 |
7.08 |
| 30% |
14.34 |
871 |
0.52 |
6.44 |
| 100% |
9.85 |
839 |
0.30 |
2.46 |
In order to investigate the effect of carbon black on Jsc of the devices, we measured the IPCE curves of the devices. Fig. 6 shows IPCE curves for devices based on CEs with 0%, 30% and 100% contents of carbon black respectively. The integrated photocurrents calculated from the overlap integral of the IPCE spectra with the AM 1.5 solar emission are also shown in Fig. 6. The integrated photocurrents for devices based on CEs with 0%, 30% and 100% contents of carbon black are 6.48 mA cm−2, 13.45 mA cm−2 and 9.26 mA cm−2 respectively. These results are close to the Jsc of 6.96 mA cm−2, 14.34 mA cm−2 and 9.85 mA cm−2 obtained by the initial I–V testing respectively. In order to further understand the effect of carbon black, we tested the square resistance of 5 μm thick CCEs with different content of carbon black, which are represented in Table 2. It is clear that the square resistance of CCEs increase gradually with the content of carbon black was increased. The decreased Jsc and FF for devices with high contents of carbon black in CCEs is probably due to the high square resistance of CCEs, which subsequently results in decreased charge collection efficiency.
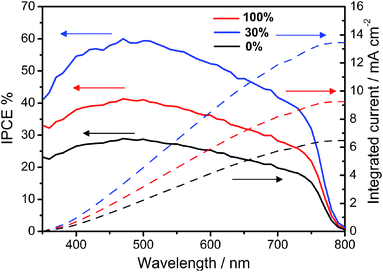 |
| | Fig. 6 IPCE curves for devices based on CEs with 0% (black curve), 30% (blue curve) and 100% (red curve) contents of carbon black respectively. The integrated photocurrents calculated from the overlap integral of the IPCE spectra with the AM 1.5 solar emission. | |
Table 2 Square resistance of 5 μm thick CCEs with different contents of carbon black in CCEs
| |
0% |
10% |
20% |
30% |
100% |
| Rsq (Ω) |
40.4 |
76.4 |
114.4 |
164.4 |
864.4 |
The long-term stability in the dark of devices based on graphite/carbon black CE with the initial efficiency of 5.52% was tested under conditions stored in air atmosphere at room temperature without encapsulation and presented in Fig. 7. It could be found that after more than 900 hours, although the Jsc decreased slightly, the PCE still remained over 5.5%.These results indicate the superior stability of CH3NH3PbI3/TiO2 heterojunction solar cells based on CCEs.
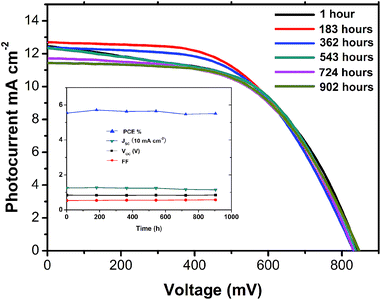 |
| | Fig. 7 Long term stability at room temperature in the dark. Inset: the changing characters of the device in 902 h after been fabricated. | |
Conclusions
In conclusion, as one of the main components in CCEs, carbon black has significant influence not only on the conductivity of CCEs but also on the crystallinity and uniformity of CH3NH3PbI3 deposited on CCEs, which will eventually affect the photovoltaic performance of devices. Devices based on graphite/carbon black CEs with different contents of carbon black were made to study the influence of carbon black. Results show that carbon black could decrease the crystallinity of CH3NH3PbI3 crystallites and improve uniformity of CH3NH3PbI3 film on CCEs, leading to improved photovoltaic performance for mesoscopic CH3NH3PbI3/TiO2 heterojunction solar cells.
Acknowledgements
The authors acknowledge the financial support from National Natural Science Foundation of China (no. 11404279). We thank the experiment center of Yancheng Teachers University for field emission scanning electron microscopy (FE-SEM) testing. We thank Michael Grätzel Center for Mesoscopic Solar Cells of Wuhan National Laboratory for Optoelectronics for current–voltage characterization and IPCE curves testing.
Notes and references
- A. Kojima, K. Teshima, Y. Shirai and T. Miyasaka, J. Am. Chem. Soc., 2009, 131, 6050 CrossRef CAS PubMed.
- J. H. Im, C. R. Lee, J. W. Lee, S. W. Park and N. G. Park, Nanoscale, 2011, 3, 4088 RSC.
- H.-S. Kim, C.-R. Lee, J.-H. Im, K.-B. Lee, T. Moehl, A. Marchioro, S.-J. Moon, R. Humphry-Baker, J.-H. Yum, J. E. Moser, M. Grätzel and N.-G. Park, Sci. Rep., 2012, 2, 591 Search PubMed.
- M. M. Lee, J. Teuscher, T. Miyasaka, T. N. Murakami and H. J. Snaith, Science, 2012, 338, 643 CrossRef CAS PubMed.
- H. Chen, X. Pan, W. Liu, M. Cai, D. Kou, Z. Huo, X. Fang and S. Dai, Chem. Commun., 2013, 49, 7277 RSC.
- B. Cai, Y. Xing, Z. Yang, W.-H. Zhang and J. Qiu, Energy Environ. Sci., 2013, 6, 1480 CAS.
- W. A. Laban and L. Etgar, Energy Environ. Sci., 2013, 6, 3249 CAS.
- Z. Xiao, C. Bi, Y. Shao, Q. Dong, Q. Wang, Y. Yuan, C. Wang, Y. Gao and J. Huang, Energy Environ. Sci., 2014, 7, 2619 CAS.
- N. J. Jeon, J. H. Noh, Y. C. Kim, W. S. Yang, S. Ryu and S. I. Seok, Nat. Mater., 2014, 13, 897 CrossRef CAS PubMed.
- H. Zhou, Q. Chen, G. Li, S. Luo, T.-b. Song, H.-S. Duan, Z. Hong, J. You, Y. Liu and Y. Yang, Science, 2014, 345, 542 CrossRef CAS PubMed.
- M. Liu, M. B. Johnston and H. J. Snaith, Nature, 2013, 501, 395 CrossRef CAS PubMed.
- J. Burschka, N. Pellet, S.-J. Moon, R. Humphry-Baker, P. Gao, M. K. Nazeeruddin and M. Grätzel, Nature, 2013, 499, 316 CrossRef CAS PubMed.
- Z. Ku, Y. Rong, M. Xu, T. Liu and H. Han, Sci. Rep., 2013, 3, 3132 Search PubMed.
- A. Mei, X. Li, L. Liu, Z. Ku, T. Liu, Y. Rong, M. Xu, M. Hu, J. Chen, Y. Yang, M. Grätzel and H. Han, Science, 2014, 345, 295 CrossRef CAS PubMed.
- L. Zhang, T. Liu, L. Liu, M. Hu, Y. Yang, A. Mei and H. Han, J. Mater. Chem. A, 2015 10.1039/c4ta04647a.
- Z. Huang, X. Liu, K. Li, D. Li, Y. Luo, H. Li, W. Song, L. Chen and Q. Meng, Electrochem. Commun., 2007, 9, 596 CrossRef CAS PubMed.
- A. Kay and M. Grätzel, Sol. Energy Mater. Sol. Cells, 1996, 44, 99 CrossRef CAS.
- Y. Wu, A. Islama, X. Yang, C. Qin, J. Liu, K. Zhang, W. Peng and L. Han, Energy Environ. Sci., 2014, 7, 2934 CAS.
- G. Liu, H. Wang, X. Li, Y. Rong, Z. Ku, M. Xu, L. Liu, M. Hu, Y. Yang, P. Xiang, T. Shu and H. Han, Electrochim. Acta, 2012, 69, 334 CrossRef CAS PubMed.
|
| This journal is © The Royal Society of Chemistry 2015 |
Click here to see how this site uses Cookies. View our privacy policy here. 


