A fast and selective probe for detection of CN− and F− in water along with a sequential molecular logic circuit via resettable optical readout†
Alok Kumar Singh*
Department of Chemistry, University of Delhi, New Delhi-110 007, India. E-mail: aloksinghchemistry@gmail.com
First published on 23rd March 2015
Abstract
A Fe(II)-terpyridyl based optical probe has been developed for the detection of CN− and F− at ppm levels which potentially meets real-world-challenges through a simple synthetic route, water based activity, fast response, by-eye visualization, high selectivity and multiple readout for precise analysis. Its stimuli-responsive optical properties have been utilised to design molecular logic circuits and keypad locks.
Over the past decade, the field of anion detection has grown exponentially due to the important function of anions in various biological systems and the environment.1 Recognition of CN− and F− ions is a dynamic area of research because of their negative and positive impact on human fitness and the environment, and their notorious connection with chemical warfare agents. CN− ions are highly toxic and have industrial applications.2 On the other hand; F− ions are added to drinking water/toothpastes for its beneficial effects however high dose of F− are dangerous and can lead to dental or skeletal fluorosis.3 Numerous reports have appeared in the literature describing the recognition of either CN− ion4 or F− ion.5 In spite of these reports, single molecular sensors which can sense both anions6 are comparatively rare. Moreover, majority of these sensors also face serious drawbacks, such as interference of cyanide and fluoride ions with each other, poor selectivity, extended response time, irreversibility, presence of an organic environment to function.
In the recent years, ion-responsive probes have gained tremendous attention in the field of molecular computing which has appeared as an endowed option for information processing.7 Compared to conventional silicon-based circuitries, molecular logic could result in smaller and extra proficient devices, and in this regard mimicking sequential logic operations is more demanding, and its growth is still in the infancy.4b,8 Furthermore, molecular keypad locks have received significant awareness and there has been an impetus to develop these with a larger number of inputs as this can improve their security level.
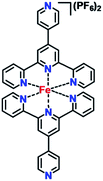
Taking these factors into account, we introduce a hitch-free Fe(II)-terpyridyl complex-based probe (1) which displays fast and selective detection of ppm-concentrations of CN− and F− in H2O via discernible colour changes and emission “turn-on” behaviour. Notably, “turn-on” readout permits measurement of the low-concentration of analytes relative to the “dark” background and decreases the probability of false positive signal. The 1-CN− and 1-F− ensembles could further recognize Ag+ and Fe2+ in H2O respectively at ppm levels. To the best of our knowledge, this is the first report on Fe(II)-terpyridyl based CN− and F− sensor. The sensing potentials of 1 for the ions (CN−/F− and Ag+/Fe2+) and its pH responses have been exploited to construct molecular-level logic circuits and keypad locks. The highly sensitive probe 1 (Scheme 1) has been synthesised in good yield (61%) by adopting a simple synthetic pathway9 and well-characterized via full-battery of physico-chemical techniques (Fig. S1–S5†).
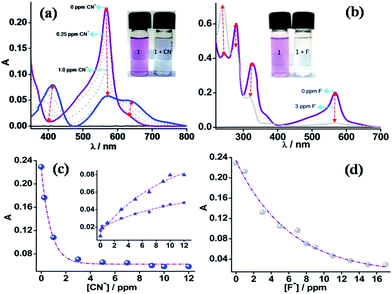
The UV-vis spectrum of 1 (10−5 M, CH3CN) displays metal-to-ligand charge transfer (MLCT) band at λ = 569 nm (ε = 22![[thin space (1/6-em)]](https://www.rsc.org/images/entities/char_2009.gif) 931 M−1 cm−1) and ligand centred bands within λ = 240–400 nm.9 Attractively, the spectrum shows perturbations in the presence of CN− and F− at ppm level concentrations associated with visible colour changes from purple to blue (Fig. S6†) and colourless (Fig. S7†), respectively. Upon the addition of CN− (10 ppm, H2O) in 1 (10−5 M, CH3CN), MLCT band at λ = 569 nm dissolved (“turn off”, ∼3.9 fold) to give a broad band in the region λ = ∼500–750 nm and simultaneously a new band appeared at λ = 413 nm (“turn on”, ∼8.4 fold), which potentially allows for a label-free detection (Fig. 1a). Strikingly, F− (15 ppm, H2O) addition to 1 (10−5 M, CH3CN) led to a large “turn off” of MLCT band (∼8.8 fold) (Fig. 1b). Appearance of three isosbestic points for CN− at λ = 381, 450 and 598 nm (Fig. 1a) and for F− at λ = 264, 299 and 390 nm (Fig. 1b) potentially indicates formation of new specie(s) as an effect of addition of CN−/F−. Moreover, in each case, the addition followed an exponential decay pattern (Fig. 1c and d). The spectral responses saturated at 10 ppm for CN− and 15 ppm for F−.
931 M−1 cm−1) and ligand centred bands within λ = 240–400 nm.9 Attractively, the spectrum shows perturbations in the presence of CN− and F− at ppm level concentrations associated with visible colour changes from purple to blue (Fig. S6†) and colourless (Fig. S7†), respectively. Upon the addition of CN− (10 ppm, H2O) in 1 (10−5 M, CH3CN), MLCT band at λ = 569 nm dissolved (“turn off”, ∼3.9 fold) to give a broad band in the region λ = ∼500–750 nm and simultaneously a new band appeared at λ = 413 nm (“turn on”, ∼8.4 fold), which potentially allows for a label-free detection (Fig. 1a). Strikingly, F− (15 ppm, H2O) addition to 1 (10−5 M, CH3CN) led to a large “turn off” of MLCT band (∼8.8 fold) (Fig. 1b). Appearance of three isosbestic points for CN− at λ = 381, 450 and 598 nm (Fig. 1a) and for F− at λ = 264, 299 and 390 nm (Fig. 1b) potentially indicates formation of new specie(s) as an effect of addition of CN−/F−. Moreover, in each case, the addition followed an exponential decay pattern (Fig. 1c and d). The spectral responses saturated at 10 ppm for CN− and 15 ppm for F−.
Remarkably, palpable responses upon addition of even 0.1 ppm of CN− and 0.5 ppm of F− could also be deciphered through UV-vis spectroscopy with detection limit10 approaching 1.42 × 10⁻⁷ M for CN− and 1.3 × 10⁻⁶ M for F−, thus providing an efficient system for monitoring traces of CN− and F− in environmental samples. Using Job's method of continuous variation of mole fraction, a stoichiometric ratio of 1![[thin space (1/6-em)]](https://www.rsc.org/images/entities/char_2009.gif) :
:![[thin space (1/6-em)]](https://www.rsc.org/images/entities/char_2009.gif) 3 is observed for 1-CN− (Fig. S8†) and 1
3 is observed for 1-CN− (Fig. S8†) and 1![[thin space (1/6-em)]](https://www.rsc.org/images/entities/char_2009.gif) :
:![[thin space (1/6-em)]](https://www.rsc.org/images/entities/char_2009.gif) 1 for 1-F− (Fig. S9†). Moreover, the binding constants computed for CN− (Fig. S10†) and F− (Fig. S11†) were obtained as 1.05 × 10⁵ M−1 and 2.8 × 10³ M−1 respectively, using Benesi–Hildebrand method.11
1 for 1-F− (Fig. S9†). Moreover, the binding constants computed for CN− (Fig. S10†) and F− (Fig. S11†) were obtained as 1.05 × 10⁵ M−1 and 2.8 × 10³ M−1 respectively, using Benesi–Hildebrand method.11
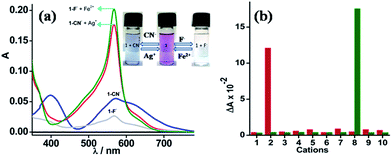
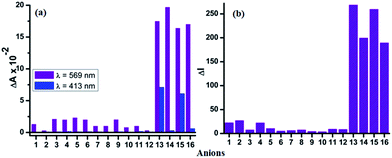
Differential affinity of 1 for CN− and F− implies different binding modes. It is proposed that, most probably, a charge transfer complex between Fe(II) and cyanide ion is formed as evidenced by appearance of a broad band (λ = ∼500–750 nm) in place of MLCT band and visible colour change from purple to blue (Fig. 1a).9,12 In case of F− diminution of the absorbance of the MLCT band at λ = 569 nm with concomitant colour change from purple to colourless (Fig. 1b) clearly specify that addition of F− leads to sequestering of Fe2+ ion from the receptor to form a more stable ion-pair or complex cation in solution.13 Additionally the “turned-off” MLCT of 1 by CN− and F− due to the formation of 1-CN− and 1-F− ensembles was effectively “turned-on” by addition of Ag+ and Fe2+ respectively in the ppm concentration as low as 1 ppm in H2O. The further addition of 10 ppm of Ag+ and Fe2+ in the respective solutions of 1-CN− and 1-F−, not only enhanced the absorbance by almost 80% and 95% but also brought back the initial purple colour of the solution. This implies the sequestering of CN− by Ag+ as silver cyanide is formed in the solution. None of the other investigated cations, could produce any remarkable response in the absorbance and colour of both 1-CN− and 1-F− solutions (Fig. 2). Thus probe 1 additionally sense Ag+ and Fe2+ at ppm level in H2O.
Rapid reaction time for a sensing procedure is extremely preferred for real-world-applications. Time dependent absorption measurement at λ = 569 nm and at 298 K suggested that 10 ppm of CN− saturates the sensor within ∼100 s (Fig. S12a†), which is faster than the majority of the reported chemosensors for CN− in H2O, so far, while 15 ppm of F− takes >100 s (Fig. S13a†) for similar effect. Moreover, the effect of addition of CN−/F− was visible within 2–4 s (Fig. S12a and 13a†). In both cases (CN−/F−), reaction was found to be of first order with 1-CN− (rate constant, k = 1.43 × 10⁻² s−1) (Fig. S12†) and 1-F− interaction (k = 9.78 × 10⁻³ s−1) (Fig. S13†). Interestingly, high on/off ratios (on/off ratios: λ = 242, 1.5; λ = 279, 1.3; λ = 325, 2.1; λ = 413, 8.4; λ = 569, 3.9; λ = 642, 3 for CN− and λ = 242, 1.8; λ = 279, 1.3; λ = 325, 2.2; λ = 569, 8.8 for F−) combined with fast reaction rate allows a precise quantification of CN−/F− in large optical window (λ = 240–800 nm).
While investigating the effect of pH on probe 1, we added dil. HCl to 1 (10−5 M, CH3CN) and the MLCT red shifted to 590 nm (Δλ = +21 nm) (pH = 0.53) along with little hyperchromism. The protonation of the pyridyl nitrogen at lower pH is believed to be the most likely reason for the changes in the absorption specrum.9 Addition of 15 ppm of F− (H2O) at increasing acidic solution (pH range 0.5 to 5.0) of 1, resulted restoration of the MLCT band to its original position, due to deprotonation of pyridyl nitrogen by F− to form 1. The probe 1 could be employed as an effective sensor for F− with in a pH range of ∼6–10. Similar tests with CN− could produce no noticeable difference in sensing activity of 1 within pH range 0.5 to 10 probably due to strong field ligand CN−.
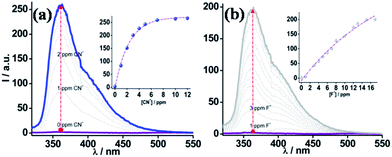
The numerous spectroscopical readout could possibly recommend more accuracy and reliability in detection of anions via optical analyses. Here, we also employed fluorescence spectroscopy for selective recognition of CN− and F−. Initially the probe 1 (10−5 M, CH3CN, ϕf = 0.006 using [Ru(bpy)3]2+ as standard) was non-emissive but showed remarkable exponential fluorescence enhancement at λ = 364 nm (λex = 290 nm) upon addition of CN−/F− in H2O (Fig. 3). Furthermore, ∼10 ppm of CN− (“turn on”, on/off ratio = ∼120, ϕf = 0.14) (Fig. 3a) and ∼15 ppm of F− (“turn on”, on/off ratio = ∼94, ϕf = 0.12) (Fig. 3b) in H2O saturates the probe 1 (10−5 M, CH3CN), which is quite similar to UV-vis saturation limit. No emission was observed upon excitation at MLCT band (λ = 569 nm). Furthermore, akin outcome were achieved in non-aqueous medium (2–3% error).
Apart from showing rapid response and elevated sensitivity, a chemosensor should also represent a high degree of selectivity against other competitive analytes. The proposed probe 1 detects CN− and F− excellently in aqueous/non-aqueous media, since no significant change was observed in absorption and emission spectra (Fig. 4), and in colour (Fig. S14†) upon addition of 15 ppm of OAc−, NO3−, NO2−, SCN−, OH−, HCO3−, I−, Br−, Cl−, CO32−, PF6− and ClO4−. In an instance where mixture of all these anions except CN− and F− were treated with 1, no colour change was observed. But when mixture + CN− except F− or mixture + F− except CN− were taken, colour changed from purple to blue and colourless, respectively. In the event, where CN− and F− are mixed, the probe 1 responded only to CN−, as the colour changed to blue. This could be due to large binding constant for 1-CN− couple. Hence, the probe 1 appears to be highly selective in action when tested against a range of anions, individual or in a mixture but prefers CN− in presence of F−. Most of the reported methods do not show the effect of presence of interfering anions and present individual results.
The probe was potentially adequate to sense CN− and F− in pool and tap H2O as verified by proof-of-concept experiments. The absorbance values at λ = 569 nm diminishes exponentially as a function of ppm concentrations of CN− and F− till saturation limit (Fig. S15†). Finally, the nature of interactions between probe-stimulus couple has been achieved based on 1H NMR, 13C NMR and FTIR data. The 1H NMR spectrum of 1-CN− shows upfield shift of 0.91, 0.4, 0.09 and 0.34 ppm for H3′, Hm+3, Ho and H4, downfield shift of 0.85 and 0.10 ppm for H6 and H5 respectively, and in case of 1-F− broad singlet, as compared to the clear peaks in the 1H NMR spectrum of 1 (Fig. S16†). In the 13C NMR spectrum of 1-CN− a new peak was observed at 116.97 ppm corresponding to –CN− carbon and all other peaks were shifted as compared to 13C NMR spectrum of 1 (Fig. S17†).4b In the FTIR spectrum of 1-CN− the peak observed at 2070 cm−1 corresponds to –CN moiety (Fig. S18†).4b
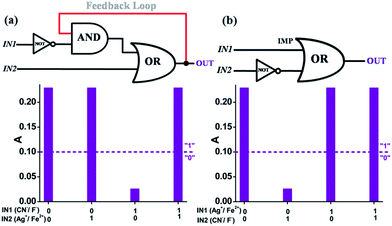
The set-reset of probe 1 by CN−/F− and Ag+/Fe2+ ions (vide supra) can process information in the look of two-input sequential logic circuit.4b,8 The deviation in the absorbance of the MLCT band at λ = 569 nm has been arrested as the output and the threshold value has been fixed at 0.10. The logic circuit is planned in such a mode that CN−/F− act as IN1 while Ag+/Fe2+ act as IN2 (Sequence 1). When IN1 is high (IN1 = 1) the absorbance falls below the threshold level to give OUT = 0 and the stored information is “erased” from the system. While, successive addition of IN2 (IN2 = 1) again “writes” the information in the system as it recover its absorbance with OUT = 1 (Fig. 5a). When the sequence order of the inputs is reversed and Ag+/Fe2+ (IN1 = 1) is added before CN−/F− (IN2 = 1) (Sequence 2); a combinatorial logic circuit14 mimicking the function of IMPLICATION (IMP) system, is obtained (Fig. 5b).
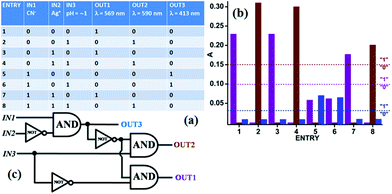
Further, the selectivity of probe 1 between CN− and F− (vide supra) can process information in the form of two input and two output combinatorial logic circuit motivated by NOR and YES gate (Fig. S19†). Moreover three chemical inputs viz. CN− (IN1), Ag+ (IN2) and pH = ∼1 (IN3) in eight different combinations were used to address the absorbance outputs at λ = 569 nm (OUT1), λ = 590 nm (OUT2) and λ = 413 nm (OUT3). The threshold absorbance for OUT1, OUT2 and OUT3 have been set at 0.10, 0.15 and 0.03 respectively. These outputs are generated by a combinatorial circuit comprising of NOT and gates wired together (Fig. 6). Therefore, the sensing capabilities of probe 1 can be beneficially continued to construct molecular level logic circuits which can store the information programmed by suitable chemical input.
A molecular keypad lock with two inputs and one output has also been assembled. Out of the ten possible combinations (Fig. S20†), only the password “*8” (* = CN−, 8 = Ag+) and “#9” (# = F−, 9 = Fe2+) for CN− and F− respectively, could “turn-on” absorbance at λ = 569 nm and unlock the device.
In conclusion, the proposed sensor presents an innovative paradigm to specifically monitor CN−/F− concentrations owing to its extremely sensitive and selective water based fast sensory-action. The “by-eye” detection of CN− and F− via obvious colour change renders probe 1 with economic significance. The 1-CN−/F− pairs formed in situ could additionally sense Ag+ and Fe2+ ions in H2O at ppm levels and reverting the probe 1 into the solution. Further the sensing assets of probe 1 have been exploited to construct two and three input logic circuits and molecular keypad locks. Outstandingly, our system provides label-free detection among matrix of analytes and permits retaining uniqueness of information with no scope of mixing. Immobilization of the probe on appropriate substrate may pick up its molecular convenience towards analytes and unlock stimulating potential in the field of new generation molecular-memory modules.15
Acknowledgements
Financial assistance from DST (SERB/F/1424/2013-14), New Delhi and University of Delhi is gratefully acknowledged. Author thanks Dr Rajamani Nagarajan, Department of Chemistry, University of Delhi for providing the platform to carry out this research.Notes and references
- (a) T. Gunnlaugsson, M. Glynn, G. M. Tocci, P. E. Kruger and F. M. Pfeffer, Coord. Chem. Rev., 2006, 250, 3094 CrossRef CAS PubMed; (b) S. Kubik, Chem. Soc. Rev., 2010, 39, 3648 RSC.
- (a) B. A. Logue, D. M. Hinkens, S. I. Baskin and G. A. Rockwood, Crit. Rev. Anal. Chem., 2010, 40, 122 CrossRef CAS; (b) R. Jackson, R. P. Oda, R. K. Bhandari, S. B. Mahon, M. Brenner, G. A. Rockwood and B. A. Logue, Anal. Chem., 2014, 86, 1845 CrossRef CAS PubMed.
- (a) K. L. Kirk, Biochemistry of the Elemental Halogens and Inorganic Halides, Plenum, New York, 1991 Search PubMed; (b) I.-S. Ke, M. Myahkostupov, F. N. Castellano and F. P. Gabbai, J. Am. Chem. Soc., 2012, 134, 15309 CrossRef CAS PubMed.
- (a) M. G. Derry Holaday, G. Tarafdar, B. Adinarayana, M. L. P. Reddy and A. Srinivasan, Chem. Commun., 2014, 50, 10834 RSC; (b) S. Pramanik, V. Bhalla and M. Kumar, ACS Appl. Mater. Interfaces, 2014, 6, 5930 CrossRef CAS PubMed; (c) F. Wang, L. Wang, X. Chen and J. Yoon, Chem. Soc. Rev., 2014, 43, 4312 RSC.
- (a) Y. Zhou, J. F. Zhang and J. Yoon, Chem. Rev., 2014, 114, 5511 CrossRef CAS PubMed; (b) L. Gai, J. Mack, H. Lua, T. Nyokong, Z. Li, N. Kobayashi and Z. Shen, Coord. Chem. Rev., 2015, 285, 24 CrossRef CAS PubMed.
- (a) N. Kumari, S. Jha and S. Bhattacharya, J. Org. Chem., 2011, 76, 8215 CrossRef CAS PubMed; (b) R. Guliyev, S. Ozturk, E. Sahin and E. U. Akkaya, Org. Lett., 2012, 14, 1528 CrossRef CAS PubMed; (c) M. Dong, Y. Peng, Y.-M. Dong, N. Tang and Y. W. Wang, Org. Lett., 2012, 14, 130 CrossRef CAS PubMed; (d) P. C. A. Swamy, S. Mukherjee and P. Thilagar, Anal. Chem., 2014, 86, 3616 CrossRef CAS PubMed; (e) J. Jia, P. Xue, Y. Zhang, Q. Xu, G. Zhang, T. Huang, H. Zhang and R. Lu, Tetrahedron, 2014, 70, 5499 CrossRef CAS PubMed; (f) S. Suganya, H. J. Zo, J. S. Park and S. Velmathi, Ind. Eng. Chem. Res., 2014, 53, 9561 CrossRef CAS; (g) M. Lee, J. H. Moon, K. M. K. Swamy, Y. Jeong, G. Kim, J. Choi, J. Y. Lee and J. Yoon, Sens. Actuators, B, 2014, 199, 369 CrossRef CAS PubMed; (h) G. R. Kumar and P. Thilagar, Dalton Trans., 2014, 43, 7200 RSC.
- (a) A. P. de Silva and S. Uchiyama, Nat. Nanotechnol., 2007, 2, 399 CrossRef CAS PubMed; (b) M. Amelia, L. Zou and A. Credi, Coord. Chem. Rev., 2010, 254, 2267 CrossRef CAS PubMed; (c) H. Tian, Angew. Chem., Int. Ed., 2010, 49, 4710 CrossRef CAS PubMed; (d) G. de Ruiter and M. E. van der Boom, Acc. Chem. Res., 2011, 44, 563 CrossRef CAS PubMed; (e) Y. Wu, Y. Xie, Q. Zhang, H. Tian, W. Zhu and A. D. Q. Li, Angew. Chem., Int. Ed., 2014, 53, 2090 CrossRef CAS PubMed; (f) K. Chen, Q. Shu and M. Schmittel, Chem. Soc. Rev., 2015, 44, 136 RSC.
- (a) D. Margulies, C. E. Felder, G. Melman and A. Shanzer, J. Am. Chem. Soc., 2007, 129, 347 CrossRef CAS PubMed; (b) Z. Huang, H. Wang and W. Yang, Nanoscale, 2014, 6, 8300 RSC; (c) X.-J. Jiang and D. K. P. Ng, Angew. Chem., Int. Ed., 2014, 53, 10481 CrossRef CAS PubMed.
- T. Duchanois, T. Etienne, M. Beley, X. Assfeld, E. A. Perpète, A. Monari and P. C. Gros, Eur. J. Inorg. Chem., 2014, 3747 CrossRef CAS.
- A. Kumar, A. K. Singh and T. Gupta, Analyst, 2013, 138, 3356 RSC.
- H. A. Benesi and J. H. Hildebrand, J. Am. Chem. Soc., 1949, 8, 2703 CrossRef.
- P. C. Mondal, V. Singh and B. Shankar, New J. Chem., 2014, 38, 2679 RSC.
- C. Bhaumik, S. Das, D. Maity and S. Baitalik, Dalton Trans., 2011, 40, 11795 RSC.
- A. Kumar, M. Chhatwal, A. K. Singh, V. Singh and M. Trivedi, Chem. Commun., 2014, 50, 8488 RSC.
- A. Kumar, M. Chhatwal, P. C. Mondal, V. Singh, A. K. Singh, D. A. Cristaldi, R. D. Gupta and A. Gulino, Chem. Commun., 2014, 50, 3783 RSC.
Footnote |
| † Electronic supplementary information (ESI) available: Experimental details, characterization and sensing methodology. See DOI: 10.1039/c5ra03668b |
| This journal is © The Royal Society of Chemistry 2015 |

