Investigation of interfacial and photoelectrochemical characteristics of thermally treated PbS/TiO2 photoanodes

Qiang Dong, Wei Liao, Bin Wang and Zhongqing Liu*
College of Chemical Engineering, Sichuan, University, Chengdu 610065, Sichuan, PR China. E-mail: liuzq_hgxy@scu.edu.cn; lzq_301@126.com

Received 5th February 2015 , Accepted 31st March 2015

First published on 31st March 2015


Abstract

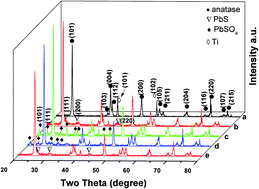
Photoanodes composed of PbS QD sensitized TiO2 nanotube arrays (PbS/TNAs) were prepared via the series ion layer adsorption replacement (SILAR) method. The samples were analyzed by X-ray diffraction (XRD), X-ray photoelectron spectroscopy (XPS), transmission electron microscopy (TEM), UV-visible diffuse reflectance spectroscopy (UV-vis DRS), and photoluminescence (PL) to illustrate the sample microscopic morphologies, chemical composition, and light absorption properties. Current–potential (JV), current–time (It), electrochemical impedance spectroscopy (EIS), and Mott–Schottky analyses revealed the charge transport and interfacial features in the samples. The effects of thermal treatments on PbS/TNAs interfacial contact and photoelectrochemical properties were systematically investigated. Under different atmospheres (air, vacuum, N2) during the thermal treatment, the crystal phase and chemical composition, light absorption, PbS quantum dot size and exposed crystal face, flat band potential, and resistance traits changed accordingly. When the sample was heated in N2, some of the PbS QDs were oxidized to form a PbS@PbSO4 junction. The size of the quantum dots increased from 4–5 nm to 14–15 nm, and the exposed crystal face changed from {111} to {200}. The interfacial resistances between PbS and TiO2 increased as well. When the samples were thermally treated in air or vacuum, PbS QDs were mostly oxidized to PbSO4. After the electrodes were immersed in sulfur-containing electrolyte, PbSO4 was vulcanized to PbS. Due to the limited mass transport across the newly formed PbS layer, the reduction was hardly complete. A PbSO4@PbS junction was formed with the new PbS having an exposed crystal face of {220} instead of {111}. The sample not thermally treated boasted the best photoelectrochemical features with a short circuit current density of 7.04 mA cm−2. The sample thermally treated in N2 embraced the worst photoelectrochemical traits with a short circuit current density of 3.0 mA cm−2.


1. Introduction

In 1972, Fujishima and Honda discovered that under photoirradiation, TiO2 electrodes were able to electrolyze water to produce hydrogen.1 Since this discovery, TiO2 has attracted widespread interest in photovoltaic catalysis and solar cells because of its low-cost synthesis, low toxicity, and chemical stability. However, the wide bandgap of TiO2 crystals (3.2 eV, anatase) precludes their accessibility to 45% of sunlight energy. And the very high recombination rates of the photoexcited electron–hole pairs further lower the power conversion efficiencies. For example, if the photoanode is made of anatase TiO2 crystals, under the standard sunlight irradiation (AM 1.5G), the highest theoretical power conversion efficiency (PCE) is only 1.3%. The actual PCE of the solar cell presented in Fujishima's study was 0.1%. A primary research objective as well as an enormous challenge in this area is to expand the visible light response range of TiO2 materials and to enhance the PCE by reducing the recombination rates of the photoexcited charge carriers.

In optoelectronic devices, the photoanode is the energy conversion element. The materials selection and structural design have become a major bottleneck of improving the device PCE. In recent years, there have been attempts of employing coupled narrow bandgap quantum dots (QDs) and highly ordered TiO2 nanotubes to assemble photoanodes with adjustable absorbance edges.2–5 Within these photoanodes, the heterojunction formed between QDs and TiO2 also helps accelerated dissociation of the photoexcited charge carriers, and generates multiple-excitons by one absorbed photon. This method has become a highly effective means for enhanced optoelectronics performance of TiO2-based photoanodes. Among narrow bandgap semiconductors, lead chalcogenides are well known and widely investigated for their big Bohr exciton radii and narrow bandgaps.6,7 For instance, PbS has a Bohr exciton radius of 18 nm and an intrinsic bandgap of 0.41 eV. Lead chalcogenides also boast high degenerated first excited states, mirror-imaged conduction bands and valence bands, energy levels matching that of TiO2, and long exciton lifetimes (200–800 s). Zhao et al. utilized series ion deposition to infiltrate PbS QDs onto TiO2 nanotube electrodes.8 They obtained the optimized optoelectronic characteristics when the deposition times arrived 15. Grimes et al. found that the optoelectronic properties of the PbS QD sensitized TiO2 nanotube array photoanodes relied on the modification procedure.9 The photocurrent of the sample made from SILAR was 11.02 mA cm−2, while that of the sample produced by electro-deposition was 5.72 mA cm−2. Lian et al. applied transient photo-absorption spectroscopy to study the dynamics of electron transfer from PbS QDs to TiO2 nanocrystals.10 Their results demonstrate the possibility of extracting hot charge carriers and multiple-excitons. They also studied the dynamics of multiple-exciton generation and quenching by utilizing PbS QD/methylene blue complex as the QD/electron acceptor model. They illustrated that the generation and dissociation rates of multiple-excitons were not influenced by existence of QD charges and acceptors. Semonin et al. reported the solar cells consisted of PbSe QDs that featured an external quantum efficiency of 114 ± 1% and internal quantum efficiency of 130%.11 This is the first example that has an external quantum efficiency above 100% under low illumination intensities. The study also proves the likelihood of acquiring and fully utilizing multiple-excitons.

For semiconductor nanocrystals with diameters smaller than 10 nm, electrons are confined within the 3D potential wells. There is no free charge carrier generated upon illumination by light. Instead, bonded electron–hole excitons are generated. Excitons then diffuse to the internal interfaces of the photoelectrodes. Dissociation at the interfaces produces free charge carriers.12–15 Interfaces between QD and TiO2 are formed when decorating TiO2 with QDs. The individual crystal face alignment, interfacial barrier, and QD size all contribute profoundly to the processes of exciton diffusion, transport, dissociation, and transfer.16–19 In the directly coupled QD/TiO2 system made with SILAR, the ultrafast electron transfer from CdS to TiO2 occurs within 10–50 ps.20 On the other hand, in the indirectly coupled QD/TiO2 system produced with self-assembled monolayer by using dual functional thiocarboxylic acid group, the impedance to electron transfer increases with longer molecular length.21 In the ultrafast pump-probe laser spectroscopy technique study carried out by Grätzel et al., the dissociation rate at the PbS QD/(001) TiO2 interface is five times faster than that at the PbS QD/(101) TiO2 interface.22 The transfer characteristics of the photoelectrons from PbS QDs to TiO2 can be controlled by adjusting the size of the QDs.23 When using TiO2 nanobelts to replace TiO2 nanoparticles, the nanohybrids of PbS-QD/TiO2-NB absorbs light up to 1400 nm. Study of the interfacial transfer properties and limiting factors of the narrow bandgap semiconductor QDs (such as PbS) and wide bandgap semiconductors (such as TiO2) pertains great scientific significance for the improvement of optoelectronic performance of such systems.

In the current study, we use the SILAR method to prepare PbS sensitized TiO2 nanotube arrays electrode (PbS/TNAs) by employing dual functional thioacetic acid as a linkage.24–26 Since PbS is a relatively unstable material, it can be oxidized to PbSO4 as the final product.47 Therefore, we systematically investigated the effects of thermal treatment under different level of oxidation conditions (air > vacuum > N2) and temperature on the interfacial contact and optoelectronic properties. The relationship between the structure and properties was analyzed by X-ray diffraction (XRD), X-ray photoelectron spectroscopy (XPS), transmission electron microscope (TEM), UV-visible diffuse reflectance spectroscopy (UV-vis DRS), photoluminescence (PL), electrochemical impedance, and Mott–Schottky. Our results indicate that the thermal treatment induces surface oxidation, enlargement of the PbS QD size, and alternation of the exposed crystal faces. The changes lead to diminished interfacial contact between PbS and TiO2 and apparently increased impedance. The interfacial charge transfer becomes hindered and the overall optoelectronic performance is decreased.

2. Experimental

2.1 Sample preparation

The detailed procedure and conditions of electrochemical anodization preparation of TiO2 nanotube arrays (TNAs) are reported in our previous work.27–29 The high purity titanium sheet was mechanical polished before chemical polishing. Then anodic oxidation was operated using polished Ti sheet as anode, high purity graphite sheet as the counter electrode at 60 V for 4 h. The electrolyte was an ethylene glycol solution with 0.2 wt% HF, 0.5 wt% NH4F, 2 vol% H2O. After the anodic oxidation, the TNAs were washed with deionized water and ethanol repeatedly, after which they were annealed at 500 °C for 2 h to obtain anatase TNAs. After removing the plugging matters on the TNA openings by ultrasonication in 10 vol% H2O2, the TNAs were heated at 500 °C in air for 2 h to convert amorphous TiO2 to anatase TiO2. To replenish the removed hydroxyl groups during the thermal treatment,30 the thermally crystallized TNAs were immersed in 5 g L−1 NaOH for 4 h. After rinse with water, the TNAs were immersed in 0.02 M thioacetic acid (TGA) for 4 h. The TNAs were again rinsed with water and dried by air. Using 0.002 M Pb(NO3)2 and 0.005 M Na2S as the Pb and S sources, respectively, series ion layer adsorption replacement (SILAR) was performed on the materials. One SILAR cycle containing Pb(NO3)2-rinse and drying-Na2S-rinse and drying took 60 s. The PbS sensitized TNAs (PbS/TNAs) were prepared with ten SILAR cycles. Different samples were further heated at 10 °C min−1 and kept at 300 °C for 2 h in air, vacuum, and N2, respectively. The corresponding samples were labeled A-PbS/TNAs, V-PbS/TNAs, and N-PbS/TNAs, while the thermally untreated sample was labeled U-PbS/TNAs.

2.2 Characterization

XRD (Philips XPert pro MPD) analysis provided the crystalline phase information of the samples. TEM (Tecnai G2 F20 S-Twin) demonstrated the microscopic morphologies. XPS (Kratos XSAM-800) presented the chemical composition. PL (F-7000) afforded the dissociation properties of photoinduced charge carriers with an excitation wavelength of 300 nm.

2.3 Photoelectrochemical analysis

The photoelectrochemical analyses were performed on CHI650E electrochemical workstation (Chenhua, Shanghai), including JV, It, photocurrent attenuation, EIS, and Mott–Schottky analysis. The light source was AM1.5G (100 mW cm−2). The sample was used as the working electrode, a Pt tile as the counter electrode, SCE as the reference electrode, and 0.1 M Na2S + 0.1 M Na2SO3 as the supporting electrolyte.

3. Results and discussion

3.1 Sample characterization

Fig. 1 shows the XRD patterns of the samples. According to Fig. 1a, the pristine TNAs only contains diffractions of Ti baseline and anatase TiO2. After the deposition of PbS, the thermally untreated U-PbS/TNAs (Fig. 1b) demonstrates broadened {111}, {200}, and {220} diffraction peaks of PbS as well as Ti baseline and anatase TiO2 (JCPDS#05-0592).8,9 Sample N-PbS/TNAs, thermally treated under N2, possesses the same diffractions as U-PbS/TNAs. For samples A-PbS/TNAs and V-PbS/TNAs, the PbS diffraction patterns at {111}, {200}, and {220} disappeared. Instead, diffractions at {101}, {111}, and {210} of PbSO4 (JCPDS#36-1461) illustrate the oxidation of PbS QDs.31,32 Fig. S2 was generated by fractioning the spectra because of the partial overlapping of PbS {111} diffraction and anatase TiO2 {101} diffraction. In Fig. S2, the PbS {111} diffraction of sample N-PbS/TNAs is obviously weaker than that of sample U-PbS/TNAs, yet the intensities of diffraction peaks at {200}, {220} are almost identical. This is probably due to the result of reorientation of crystal face alignment after thermal treatment.
image file: c5ra02287h-f1.tif
Fig. 1 XRD patterns of (a) pristine TNAs,(b) U-PbS/TNAs, (c) A-PbS/TNAs, (d) V-PbS/TNAs and (e) N-PbS/TNAs.

XPS was performed on the 300 °C treated samples A-PbS/TNAs, V-PbS/TNAs, and N-PbS/TNAs to shed light on the surface chemical composition changes induced by different heat-treatment atmospheres (Fig. 2). From the figure, it is demonstrated that all samples contain Ti, O, Pb, and S. From the high resolution XPS, the elemental composition percentage of each element can be quantified and the results are tabulated in Table S1. In all samples, the Pb/S atomic ratio is greater than 1, while the value decreases according to treatment atmosphere of air, vacuum, and N2. We attribute the phenomenon to the oxidation of S2− of the PbS QDs into volatile S0 or SO2. Under air, the atmosphere is the most oxidizing, so the highest amount of oxidized S that leads to the greatest Pb/S ratio of 1.76. Under N2 the atmosphere is the least oxidizing, so the lowest amount of oxidized S leading to the lowest Pb/S ratio of 1.55, while the ratio is 1.61 under vacuum due to the oxidizing atmosphere is between the N2 and air. The oxygen source under vacuum or N2 atmosphere could be from hydroxyl groups adsorbed on PbS/TNAs before heat treatment during the aqueous SILAR manipulations.


image file: c5ra02287h-f2.tif
Fig. 2 XPS profiles of (a) A-PbS/TNAs, (b) V-PbS/TNAs and (c) N-PbS/TNAs.

The Pb4f and S2s XPS high resolution binding energy profiles of A-PbS/TNAs, V-PbS/TNAs, and N-PbS/TNAs are shown in Fig. 3 and 4, respectively, to illustrate Pb and S oxidation states. After thermal treatment at 300 °C for 2 h under air and vacuum, the binding energies of Pb4f appear at 143.2 eV and 138.4 eV, matching that of Pb in PbSO4. Besides the two binding energies of Pb in PbSO4, there are two Pb peaks at 141.8 eV and 137.1 eV after thermal treatment at 300 °C for 2 h under N2, matching that of Pb0. In Fig. 4, the binding energy of S2s appears at 232.3 eV after thermal treatment at 300 °C for 2 h under air and vacuum, corresponding to that of S in PbSO4.32,33 Besides the binding energy of S in PbSO4, there is one S peak at 224.6 eV after thermal treatment at 300 °C for 2 h under N2, matching that of S in PbS. The atomic ratio of this S oxidation state is 87.12%.


image file: c5ra02287h-f3.tif
Fig. 3 XPS profiles of Pb4f of (a) A-PbS/TNAs, (b) V-PbS/TNAs and (c) N-PbS/TNAs.

image file: c5ra02287h-f4.tif
Fig. 4 XPS profiles of S2S of (a) A-PbS/TNAs, (b) V-PbS/TNAs and (c) N-PbS/TNAs.

Fig. 5 exhibits the transmission electron microscope images of U-PbS/TNAs and N-PbS/TNAs. In Fig. 5a and c, uniformly formed PbS nanoparticles are visible. The size distribution of the nanoparticles is illustrated in Fig. 6. The average particle size in U-PbS/TNAs is 4–5 nm (Fig. 6a). After thermal treatment at 300 °C for 2 h under N2, the average size grows to 14–15 nm (Fig. 6b). The high resolution TEM images of Fig. 5b and d further reveal the fine crystal structures of PbS QDs. In Fig. 5b, the interplanar distance of 0.342 nm corresponds to PbS {111} crystal face. The interplanar spacing value of 0.297 nm is from PbS {200} crystal face (Fig. 5d).8,34


image file: c5ra02287h-f5.tif
Fig. 5 TEM and HRTEM images of the U-PbS/TNAs and N-PbS/TNAs.

image file: c5ra02287h-f6.tif
Fig. 6 Size distribution histograms of PbS nanoparticles for (a) U-PbS/TNAs and (b) N-PbS/TNAs.

When the samples were thermally treated in air or vacuum, PbS QDs were mostly oxidized to PbSO4, besides the colour of the samples changed from black (PbS) to its original TiO2 colour. After the electrodes were immersed in sulfur-containing electrolyte, the colour of the samples changed to black again. Thus, it can be convinced that PbSO4 was vulcanized to PbS. The TEM and HRTEM images of sample A-PbS/TNAs after immersed in the 0.1 M Na2S + 0.1 M Na2SO3 are shown in Fig. S2. The SO42− of PbSO4 formed during the thermal treatment of the PbS/TNAs may have undergone ion exchange with S2− in solution to generate PbS nanoparticles by vulcanization. The density of the newly formed PbS nanoparticles is smaller than that of the thermally untreated U-PbS/TNAs, while the exposed PbS nanoparticle crystal face is {220}.35,36 Considering the hindrance of the newly formed PbS layer against the outward diffusion of SO42− as well as the inward diffusion of S2−, it is probable that PbSO4 can hardly become completely vulcanized. The combined results of XRD, XPS, and TEM analyses demonstrate the formation of PbSO4@PbS{220} junction when the samples thermally treated in air or vacuum are placed in the electrolyte. For the samples thermally treated in N2, PbS{200}@PbSO4@PbS{220} junction is formed in the process. The surface oxidation of the PbS/TNAs samples after thermal treatment, combined with the enlargement of PbS nanoparticles and variation in exposed crystal faces, will change the microscopic unit interfaces of the photoelectrodes and impact the interfacial charge dissociation and transfer.

Fig. 7 displays the UV-vis diffuse absorbance spectra of the samples. The thermally untreated sample shows strong absorption in the visible range. For the samples after thermal treatment at 300 °C for 2 h under air and vacuum, their absorption curves are weaker than that of U-PbS/TNAs and close to that of TNAs. The oxidation induced by heat treatment generates PbSO4 or PbS@PbSO4 junctions that efficiently blocks light absorption and transmission hence the low absorption.


image file: c5ra02287h-f7.tif
Fig. 7 UV-vis diffuse absorbance spectra of (a) pristine TNAs, (b) A-PbS/TNAs, (c) V-PbS/TNAs and (d) U-PbS/TNAs. The inset is the plots of (ahv)2 versus photon energy for direct transition.

According to Kubelka–Munk equation:37,38

 
ahv = A(hvEg)n (1)
here, a is the absorption coefficient, is the photon energy, Eg is the bandgap width. TiO2 is a direct transition semiconductor so n takes 1/2. When plotting against ahν, the intercept by the extension of the tangent line of the linear portion curve and the horizontal axis represents the semiconductor bandgap. The TNAs without PbS sensitization has a bandgap of 3.11 eV. After thermal treatment at 300 °C for 2 h under air and vacuum, the samples A-PbS/TNAs and V-PbS/TNAs have bandgap energies at 2.91 eV and 2.99 eV, respectively. Sample U-PbS/TNAs has a bandgap of 2.34 eV, indicating its absorption cut off value of 529 nm.

3.2 Photoelectrochemical analysis

The JV curves of the samples are shown in Fig. 8. The pristine sample has a short circuit photocurrent density of 0.44 mA cm−2, while that of the sensitized, thermally untreated PbS/TNAs is 7.04 mA cm−2, an increase of 16 times in magnitude. This demonstrates the potential of improving power conversion efficiency by PbS QD sensitization of TiO2. After thermal treatment at 300 °C for 2 h under air, vacuum or N2, the photocurrent densities of the samples decrease to ∼3 mA cm−2. Fig. S3 shows the JV curves of PbS/TNAs samples after thermal treatment at various temperatures under air. It is obvious that with increasing treatment temperature, the short circuit photocurrent density decreases. The reason might be that at higher temperatures, the oxidation degrees of the PbS QDs in PbS/TNAs are high. There is evidence of vulcanization when the arrays are immersed in electrolyte. Albeit, the newly formed PbS layer hinders the transfer process during vulcanization leading to the formation of PbSO4@PbS junction. The insulating PbSO4 layer between PbS and TiO2 becomes a recombination center for photoinduced charge carriers. This is shown in the photoluminescence curves in Fig. S4. All samples have the similar PL shape and wavelength, indicating they possess the same bandgap structures. The thermally untreated PbS/TNAs sample has the weakest emission intensity, illustrating the lowest possibility of recombination of photoinduced charge carriers after photoirradiation. The PL emission intensities of the V-PbS/TNAs and N-PbS/TNAs are slightest weaker than that of the pristine TNAs, but much stronger than that of U-PbS/TNAs. The samples with stronger PL intensities present high possibilities of recombination of photoinduced charge carriers. The schematics of carriers transmission on the interface of the samples are shown in Fig. S8. The distance between two dotted lines represent the ability of transmittability.
image file: c5ra02287h-f8.tif
Fig. 8 Current–voltage (JV) characteristics of (a) pristine TNAs, (b) U-PbS/TNAs, (c) A-PbS/TNAs, (d) V-PbS/TNAs and (e) N-PbS/TNAs.

According to XRD, XPS, TEM, and UV-vis DRS results, thermal treatment causes oxidation on PbS of the PbS/TNAs samples that leads to less absorption in the visible range. PbS QDs also grow in size and the exposed crystal face changes from {111} to {200}. Less absorption brings lower light utilization efficiency. The enlarged PbS nanoparticles reduces the total contact area between PbS and TiO2. The reduced quantum size effect can decrease the chemical energy gradient between the two semiconductors. The mismatch degree of the different interface contact types is calculated by the following equation.

image file: c5ra02287h-t1.tif
δ is the mismatch degree, a1 and a2 are the lattice distance of the certain faces for the two semiconductors.

When PbS QDs have {111} as the exposed crystal face, the mismatch with TiO2 {101} lattice is 2.88%. When the exposed crystal face of PbS is {200}, the mismatch with TiO2 {101} becomes 16.95%. It is convinced that when the mismatch is less than 5%, the interface is coherent interface. While when the mismatch is greater than 5% and less than 25%, the interface is half coherent interface. The lattice mismatch increases significantly after PbS exposed crystal face changes from {111} to {200}. This change in turn aggravates the interfacial recombination, as well as impairs the interfacial contact. The electron wave function overlap of the contact is diminished. These alterations bring reduced dissociation, transport, and transfer rates, but intensified recombination of the photoinduced excitons at the PbS and TiO2 interfaces. These detrimental factors brought about by the thermal treatment of PbS/TNAs samples result in lower photon to electron conversion efficiency.

We performed photocurrent attenuation tests on the samples to better understand the transport properties of the photoinduced charge carriers. Fig. 9 shows the photocurrent attenuation curves of the samples recorded every 10 μs. The initial inflection point of the photocurrent density decrease is the point-in-time when photoirradiation is turned off. Using the initial inflection point as the starting time when the photocurrent is stabilized, the photocurrent attenuation rate in the circuit of the samples are recorded after photoirradiation is turned off. From Fig. 9, the pristine TNAs has the lowest photocurrent attenuation rate at 0.225 mA cm−2 s−1. And the U-PbS/TNAs has the highest photocurrent attenuation rate at 16.655 mA cm−2 s−1, 74 times in magnitude of that of pristine TNAs. The photocurrent attenuation rate reflexes the transport efficiency of photoinduced charge carriers. Higher rates are related to faster transport efficiencies, i.e., the rates that charge carriers are transported to and consumed in the exterior circuit.19,39,40 The U-PbS/TNAs has the highest photocurrent attenuation rate manifesting that its interfaces enjoy the most efficient dissociation, transport, and transfer rates. This type registers the greatest photocurrent density among samples analyzed. The photocurrent attenuation results match the JV analysis results.


image file: c5ra02287h-f9.tif
Fig. 9 Photocurrent attenuation curves of (a) pristine TNAs, (b) U-PbS/TNAs, (c) A-PbS/TNAs, (d) V-PbS/TNAs and (e) N-PbS/TNAs. The inset is photocurrent decay rate histograms.

Electrochemical alternating impedance experiments can characterize the kinetics of electrode process and electrode surface process by measuring the responses of a system toward the external small sinusoidal disturbances. For pure resistance circuits, the Nyquist plot should display the simple linear unit characteristics, a point within the positive quadrant. For a system with a capacitor, the Nyquist plot resembles an arc whose size quantifies the capacitance.41–43 Fig. 10 shows the Nyquist plots of samples undergoing different treatments. Compared to the pristine TNAs, the samples sensitized with PbS QDs show diminished impedances, representing optimized dissociation and transport of the photoinduced charge carriers. For samples undergoing different thermal treatments, they all display similar the impedance type. The A-PbS/TNAs has the smallest impedance while the N-PbS/TNAs has the greatest impedance.


image file: c5ra02287h-f10.tif
Fig. 10 Electrochemical impedance spectroscopy plots of (a) pristine TNAs, (b) U-PbS/TNAs, (c) A-PbS/TNAs, (d) V-PbS/TNAs and (e) N-PbS/TNAs. The inset is the enlarged range at high frequency region for the samples (a) and (b).

The electrochemical system can be represented with an equivalent circuit according to the shape of the electrochemical impedance spectroscopy (EIS).44,45 Fig. S5 displays the alternating impedance and simulated equivalent circuit of the pristine TNAs. Fig. S6 is a similar representation of N-PbS/TNAs, while Fig. S7 is that of U-PbS/TNAs. Table 1 displays the simulated values of the devices in equivalent circuits. According to the simulated equivalent circuit, there exists a metal-semiconductor contact interface between Ti and TiO2 as well as a contact interface between TiO2 and the electrolyte in pristine TNAs. For the PbS/TNAs, there is one more PbS/TiO2 contact interface besides the abovementioned two interfaces. Each of the interfaces is treated as a series resistance–capacitance unit. From Table 1, the resistance R1 representing the Ti/TiO2 interface is reduces after thermal treatment at 300 °C. Twice-annealing helps the interfacial contact between Ti/TiO2. The increased values of R2 and C2 suggest the enlarged resistance between PbS and TiO2. After thermal treatment, the PbS QDS grow in size, and the interfacial contact changes from PbS{111}/TiO2{101} to PbS{200}/TiO2{101}. The change is characterized by the shrunk contact area and lowered interfacial chemical energy gradient, plus diminished interfacial electronic wave function overlap. The changes in R3 and C3 disclose the reduced resistances between TiO2 and electrolyte after sensitized by PbS QDs. The thermal treatment increases such resistances, the result of the resistance between PbS{111} and electrolyte being less than that between PbS{200} and electrolyte. The Warburg resistance RW of the electrode process denotes the concentration polarization effect of the electrode process. Its value refers to the charge carrier consumption by the diffusion at the electrode surface. A high RW indicates strengthened transport efficiency of the internal electrode charge carriers, and the electrode surface reaction is controlled by the diffusion process. By analyzing the equivalent circuit, charge transport in the pristine TNAs is controlled by the interfacial resistance between Ti and TiO2 (R1 = 85.33). The thermally treated electrodes are dominated by the interfacial resistance between PbS and TiO2 (R2 = 165.8). The overall resistance of the PbS/TNAs electrode after thermal treatment is 209.62 Ω cm2, greater than 118.88 Ω cm2 of the pristine PbS/TNAs. The result is in accord with the photocurrent density analysis.

Table 1 Simulated values of the devices in equivalent circuits of the samples
Sample R (Ω cm2) R1 (Ω cm2) C1 (F cm−2) R2 (Ω cm2) C2 (F cm−2) R3 (Ω cm2) C3 (F cm−2) RW (Ω cm2 s−1/2)
Pristine TNAs 8.328 10.2 0.02309 730.9 0.007296 0.1289
N-PbS/TNAs 8.462 0.5479 0.0002987 165.8 0.009803 34.67 0.01654 0.1489
U-PbS/TNAs 16.64 85.33 0.01013 2.45 0.0000921 14.31 0.01533 0.1523


Mott–Schottky plot provides accurate information of the PbS/TNAs such as donor concentration Nd or acceptor concentration Na and the flat band potential Efb. Fig. 11 shows the Mott–Schottky curves of different samples. In the linear parts of the curves, the slopes of the tangent lines are all positive, representing n-type semiconductors. The relationship between donor concentration Nd and flat band potential Efb of n-type semiconductors can be expressed by the following equation:44–46

 
image file: c5ra02287h-t2.tif(2)
Here, Nd is the donor concentration, e is the electron charge of 1.6 × 10⁻¹⁹ C, ε is the relative dielectric constant of 18, ε0 is the dielectric constant of vacuum, E is the applied bias potential, k is the Boltzmann constant, T is the temperature, and A is the electrode area. The extension of the Mott–Schottky curve to 1/C2 = 0 results in the flat band potential Efb, and its slope denotes the Nd.


image file: c5ra02287h-f11.tif
Fig. 11 Mott–Schottky curves of the (a) pristine TNAs, (b) U-PbS/TNAs, (c) A-PbS/TNAs, (d) V-PbS/TNAs and (e) N-PbS/TNAs.

The flat band potentials of the samples relative to SCE are tabulated in Table S2. Under flat band conditions, the flat band potential of a semiconductor is equal to the Fermi energy. The lower the Fermi energy, the lesser the chemical potential gradient from the electrolyte to the semiconductor, the smaller the curvature of the semiconductor energy band, which in turns implies the slower charge carrier dissociation and transfer at the interface between the semiconductor and the electrolyte. The trend reverses with higher Fermi energy, leading to the faster charge carrier dissociation and transfer at the interface between the semiconductor and the electrolyte. According to Table S2, the pristine TNAs holds the most negative Fermi energy while U-PbS/TNAs has the most positive value. Therefore, at the interface between the semiconductor and electrolyte, the pristine TNAs has the smallest energy band curvature and U-PbS/TNAs the largest. Accordingly, U-PbS/TNAs embraces much faster charge carrier dissociation and transfer at that semiconductor and electrolyte interface than the pristine TNAs. For the thermally treated samples, the flat band potentials follow a positive to negative order of air > vacuum > N2. The most negative flat band potential of N-PbS/TNAS probably is caused by the donor doping of Pb0. The photoinduced charge carrier dissociation and transfer rates at the interface of semiconductor and electrolyte follows the order air > vacuum > N2, the same order of the photocurrent of the samples.

4. Conclusion

Photoanodes of PbS QD sensitized TiO2 nanotube arrays were prepared by the SILAR procedure. The effects of thermal treatment on microscopic morphologies, surface chemical composition, interfacial contact, and the photoelectrochemical characteristics of the PbS/TiO2 photoanodes are systematically investigated. Our results unveil that thermal treatment leads to oxidation and enlargement of PbS QDs on the electrodes. The related changes of the exposed crystal face, light absorption property, interfacial resistance, and flat band potential contribute to the deteriorated photoelectrochemical performance. The U-PbS/TNAs absorption red shifts to 529 nm. Its interfacial resistance between PbS and TiO2 is smaller than that of N-PbS/TNAs while its flat band potential is more positive. These characteristics symbolize strong light absorption, fast interfacial charge carrier dissociation and transfer, thus high-quality photoelectrochemical performance. When the PbS/TiO2 was thermally treated under air or vacuum, part of PbS was oxidized to volatile S0 or SO2 and PbSO4. The sulfate could be reduced by the electrolyte composed of Na2S and Na2SO3. But the newly formed PbS layer presented mass transport limit to produce the PbSO4@PbS{220} junction. The N-PbS/TNAs electrode encompassed PbS{200}@PbSO4 junction and enlarged PbS nanoparticles, exposed crystal face changing from {111} to {200}. When the electrode was immersed in the electrolyte, the surface PbSO4 on PbS was vulcanized to form PbS{200}@PbSO4@PbS{220} junction. The interfacial resistance between PbS and TiO2 was increased and flat band potential shifted to negative. The results were weakened interfacial contact, lower photoinduced charge carrier dissociation and transfer rates, and poor photoelectrochemical performance.

Acknowledgements

This work was supported by the National Science Foundation of China (Grant no. 50774053 and 21376154). The authors would like to express their heartfelt gratitude to Analytical and Test Center of Sichuan University.

Notes and references

  1. A. Fujishima and K. Honda, Nature, 1972, 238, 37–38 CrossRef CAS .
  2. J. B. Sambur, T. Novet and B. A. Parkinson, Science, 2010, 330, 63–66 CrossRef CAS PubMed .
  3. D. R. Baker and P. V. Kamat, Adv. Funct. Mater., 2009, 19, 805–811 CrossRef CAS PubMed .
  4. O. E. Semonin, J. M. Luther, S. Choi, H. Y. Chen, J. Gao, A. J. Nozik and M. C. Beard, Science, 2011, 334, 1530–1533 CrossRef CAS PubMed .
  5. F. A. Frame and F. E. Osterloh, J. Phys. Chem. C, 2010, 114, 10628–10633 CAS .
  6. J. J. Peterson and T. D. Krauss, Nano Lett., 2006, 6, 510–514 CrossRef CAS PubMed .
  7. J. B. Sambur, T. Novet and B. A. Parkinson, Science, 2010, 330, 63–66 CrossRef CAS PubMed .
  8. F. G. Cai, F. Yang, Y. Zhang, C. Ke, C. H. Cheng, Y. Zhao and G. Yan, Phys. Chem. Chem. Phys., 2014, 16, 23967–23974 RSC .
  9. Q. Kang, S. H. Liu, L. X. Yang, Q. Y. Cai and C. A. Grimes, ACS Appl. Mater. Interfaces, 2011, 3, 746–749 CAS .
  10. Y. Yang, W. R. Córdoba and T. Q. Lian, Nano Lett., 2012, 12, 4235–4241 CrossRef CAS PubMed .
  11. O. E. Semonin, J. M. Luther, S. Choi, H. Y. Chen, J. B. Gao, A. J. Nozik and M. C. Beard, Science, 2011, 334, 1530–1533 CrossRef CAS PubMed .
  12. R. Schaller and V. I. Klimov, Phys. Rev. Lett., 2004, 92, 186601–186604 CrossRef CAS .
  13. J. Huang, Z. Q. Huang, Y. Yang, H. M. Zhu and T. Q. Lian, J. Am. Chem. Soc., 2010, 132, 4858–4864 CrossRef CAS PubMed .
  14. H. M. Zhu and T. Q. Lian, J. Am. Chem. Soc., 2012, 134, 11289–11297 CrossRef CAS PubMed .
  15. A. J. Nozik, M. C. Beard, J. M. Luther, M. Law, R. J. Ellingson and J. C. Johnson, Chem. Rev., 2010, 110, 6873–6890 CrossRef CAS PubMed .
  16. L. X. Sang, H. Y. Tan, X. M. Zhang, Y. T. Wu, C. F. Ma and C. Burda, J. Phys. Chem. C, 2012, 116, 18633–18640 CAS .
  17. J. B. Gao, C. L. Perkins, J. M. Luther, M. C. Hanna, H. Y. Chen, O. E. Semonin, A. J. Nozik, R. J. Ellingson and M. C. Beard, Nano Lett., 2011, 11, 3263–3266 CrossRef CAS PubMed .
  18. P. Sudhagar, V. González-Pedro, I. Mora-Seró, F. Fabregat-Santiago, J. Bisquert and Y. S. Kang, J. Mater. Chem., 2012, 22, 14228–14235 RSC .
  19. H. H. Yang, W. G. Fan, A. Vaneski, A. S. Susha, W. Y. Teoh and A. L. Rogach, Adv. Funct. Mater., 2012, 22, 2821–2829 CrossRef CAS PubMed .
  20. J. L. Blackburn, D. C. Selmarten and A. J. Nozik, J. Phys. Chem. B, 2003, 107, 14154–14157 CrossRef CAS .
  21. D. Lawless, S. Kapoor and D. Meisel, J. Phys. Chem., 1995, 99, 10329–10335 CrossRef CAS .
  22. E. Ghadiri, B. Liu, J. E. Moser, M. Grätzel and L. Etgar, Part. Part. Syst. Charact., 2014 DOI:10.1002/ppsc.201400210 .
  23. D. F. Wang, H. G. Zhao, N. Q. Wu, M. A. E. Khakani and D. L. Ma, J. Phys. Chem. Lett., 2010, 1, 1030–1035 CrossRef CAS .
  24. C. Ratanatawanate, C. Xiong and K. J. Balkus Jr, ACS Nano, 2012, 2, 1682–1688 CrossRef PubMed .
  25. R. Vogel, P. Hoyer and H. Weller, J. Phys. Chem., 1994, 98, 3183–3188 CrossRef CAS .
  26. W. T. Sun, Y. Yu, H. Y. Pan, X. F. Gao, Q. Chen and L. M. Peng, J. Am. Chem. Soc., 2008, 130, 1124–1125 CrossRef CAS PubMed .
  27. X. Liu, Z. Q. Liu, S. X. Hao and W. Chu, Mater. Lett., 2012, 80, 66–68 CrossRef CAS PubMed .
  28. G. Q. Ji, Z. Q. Liu, D. B. Guan and Y. T. Yang, Appl. Surf. Sci., 2013, 282, 695–699 CrossRef CAS PubMed .
  29. X. Liu, Z. Q. Liu, J. L. Lu, X. L. Wu, B. Xu and W. Chu, J. Colloid Interface Sci., 2014, 413, 1723 Search PubMed .
  30. C. Arrouvel, M. Digne, M. Breysse, H. Toulhoat and P. Raybaud, J. Catal., 2004, 222, 152–156 CrossRef CAS PubMed .
  31. S. B. Bubenhofer, C. M. Schumacher, F. M. Koehler, N. A. Luechinger, R. N. Grass and W. J. Stark, J. Phys. Chem. C, 2012, 116, 16264–16270 CAS .
  32. S. D. Sung, I. Lim, P. l Kang, C. Lee and W. I. Lee, Chem. Commun., 2013, 49, 6054–6056 RSC .
  33. E. J. D. Klem, D. D. MacNeil, L. Levina and E. H. Sargent, Adv. Mater., 2008, 20, 3433–3439 CrossRef CAS PubMed .
  34. H. Tada, M. Fujishima and H. Kobayashi, Chem. Soc. Rev., 2011, 40, 4232–4243 RSC .
  35. Y. M. Zhu, R. L. Wang, W. P. Zhang, H. Y. Ge and L. Li, Appl. Surf. Sci., 2014, 315, 149–153 CrossRef CAS PubMed .
  36. B. H. Lee, H. C. Leventis, S.-J. Moon, P. Chen, S. Ito, S. A. Haque, T. Torres, F. Nüesch, T. Geiger, S. M. Zakeeruddin, M. Grǎtzel and M. K. Nazeeruddin, Adv. Funct. Mater., 2009, 19, 2735–2742 CrossRef PubMed .
  37. F. Dong, W. Zhao and Z. Wu, Nanotechnology, 2008, 19, 365607–365616 CrossRef PubMed .
  38. X. B. Chen and C. Burda, J. Phys. Chem. B, 2004, 108, 15446–15449 CrossRef CAS .
  39. J. H. Bang and P. V. Kamat, Adv. Funct. Mater., 2010, 20, 1970–1976 CrossRef CAS PubMed .
  40. V. Chakrapani, D. Baker and P. V. Kamat, J. Am. Chem. Soc., 2011, 133, 9607–9615 CrossRef CAS PubMed .
  41. Z. Y. Liu, B. Pesic, K. S. Raja, R. R. Rangaraju and M. Misra, Int. J. Hydrogen Energy, 2009, 34, 3250–3257 CrossRef CAS PubMed .
  42. J. Bisquert, G. Garcia-Belmonte and F. Fabregat-Santiago, J. Phys. Chem. B, 2000, 104, 2287–2298 CrossRef CAS .
  43. J. Bisquert, J. Phys. Chem. B, 2002, 106, 325–333 CrossRef CAS .
  44. X. S. Li, Z. Y. Zhang, G. M. Bai, C. X. Du and C. F. Ma, Int. J. Hydrogen Energy, 2012, 37, 854–859 CrossRef PubMed .
  45. W. P. Gomes and D. Vanmaekelbergh, Electrochim. Acta, 1996, 41, 967–973 CrossRef CAS .
  46. S. E. John, S. K. Mohapatra and M. Misra, Langmuir, 2009, 25, 8240–8247 CrossRef CAS PubMed .
  47. L. V. Yashina, A. S. Zyubin, R. Püttner, T. S. Zyubina, V. S. Neudachina, P. Stojanov, J. Riley, S. N. Dedyulin, M. M. Brzhezinskaya and V. I. Shtanov, Surf. Sci., 2011, 605(5), 473–482 CrossRef CAS PubMed .

Footnote

Electronic supplementary information (ESI) available. See DOI: 10.1039/c5ra02287h

This journal is © The Royal Society of Chemistry 2015
Click here to see how this site uses Cookies. View our privacy policy here.