Synthesis, crystal structure, sintering and electrical properties of a new alluaudite-like triple molybdate K0.13Na3.87MgMo3O12†
Ines Ennajeh*a,
Samuel Georgesb,
Youssef Ben Smidaa,
Abderrahmen Guesmiac,
Mohamed Faouzi Zid a and
Habib Boughazalaa
aUniversité de Tunis El Manar, Laboratoire de Matériaux et Cristallochimie, Faculté des Sciences, El Manar II, 2092, Tunis, Tunisia. E-mail: inesnajeh@gmail.com
bLaboratoire d'Electrochimie et de Physicochimie des Matériaux et des Interfaces LEPMI, UMR 5279, CNRS: Grenoble INP, Université de Savoie, Université Joseph Fourier, BP75, 38402 Saint Martin d'Hères, France
cUniversité de Tunis El Manar, Institut Préparatoire aux Etudes d'Ingénieurs d'El Manar, El Manar II, 2092 Tunis, Tunisia
First published on 22nd April 2015
Abstract
A new triple molybdate K0.13Na3.87MgMo3O12 was synthesized by solid state reaction. The crystal structure has been determined by single X-ray diffraction and the electrical conductivity measured by impedance spectroscopy. The title compound crystallizes in the monoclinic space group C2/c with a = 12.9325 (8) Å, b = 13.5537 (9) Å, c = 7.1627 (6) Å, β = 112.212 (9)°, V = 1162.33 (14) Å3 and Z = 4. The final agreement factors are R = 0.0241, wR (F2) = 0.0584, S(F2) = 1.22. The magnesium–molybdate 3D-framework belongs to the alluaudite type. The structure is formed by infinite chains composed of edge-sharing (Mg/Na)2O10 dimmers, which are linked together via bridging MoO4 tetrahedra, yielding to a three-dimensional framework enclosing two distinct types of hexagonal tunnels in which Na+ and K+ cations reside. The structural model is validated by bond valence sum (BVS) and charge distribution (CD) methods. Ball milling is used as mechanical means to reduce the particles sizes of the synthesized powder. At the optimal sintering temperature of 650 °C, a relative density of 81% was obtained. The microstructures were characterized by scanning electron microscopy. The compound undergoes a phase transformation at 528 °C accompanied by an abrupt increase of the electrical conductivity. Above this phase transition, the electrical conductivity reaches 10−2 S cm−1. Thus K0.13Na3.87Mg(MoO4)3 may be considered as a promising compound for developing new materials with high ionic conductivity.
Introduction
Complex molybdates containing alkaline elements are interesting because of their physical properties and potential applications as ferroelectric, piezoelectric and especially ionic conductors.1–4 During the last years, an increasing number of structural studies of double and triple molybdates with a rich variety of structure types were reported in the literature. Among complex molybdates of interest, lyonsite-structure such as NaCo2.31(MoO4)3,5 Li3Fe(MoO4)3 and Li2Fe2(MoO4)3,6 Nasicon structure such as Na2xM2Sc2(1−x)(MoO4)3 where M = Zn, Cd and Mg7 and alluaudite-type like Na5Sc(MoO4)4 (ref. 8) were described. Double and triple molybdates, due to these structural features are believed to have a high ionic conductivity.9–13 Indeed, the ionic conductivity reaches 10−3–10−1 S cm−1 for the NASICON-type molybdates Na3Sc(MoO4)3 and Cs2Zr(MoO4)3.14 The conductivity appears to be restricted to the significant cation mobility. It was also noted that complex molybdenum oxides undergo various phase transitions that lead to crystalline structures with high ionic conductivity. The open framework, the mobility of cations and the phase transformation were features interesting enough to motivate us to study double and triple molybdate.In this work, we report the synthesis, structure and ionic conductivity of a new triple molybdate K0.13Na3.87Mg(MoO4)3 with an alluaudite-type structure. The structural study showed that the title compound presents a three-dimensional framework with large hexagonal tunnels containing the alkaline cations. The proposed structural model based on a careful investigation of the single crystal X-ray diffraction data is supported by charge-distribution (CHARDI) analysis and bond-valence-sum (BVS) calculations. The correlation between the X-ray refinement and the validation results is discussed. The thermal stability of the molybdate was investigated. The electrical properties of the ceramics shaped from the powders have been studied using complex impedance spectroscopy. Correlation attempts between the electrical behaviour and the microstructure of the samples were made.
Experimental
Synthesis
The crystals used for the structural determination were prepared by solid-state reaction. For the synthesis of the single crystals, Na2CO3 (Fluka, 71350), K2CO3 (Fluka, 60109), (NH4)2Mo4O13 (Fluka, 69858) and Mg(NO3)2·6H2O (Fluka, 63079) were used as starting materials with the following proportions (Na: 3.8, K: 0.2, Mo: 3, Mg: 1). In this study, we are not currently in the process of investigating the complete Na–K range. We put potassium in small amounts in order to create a random cationic distribution, to rise the cationic disorder and increase the cationic conductivity. A mixture of the starting materials placed in a porcelain crucible was slowly annealed in air at 400 °C for 12 hours, in order to eliminate volatile compounds. The resulting mixtures were heated at 700 °C for 7 days in air. The sample was slowly cooled down at 5°/24 h to 600 °C and finally quenched to room temperature. Single colorless crystals of triple molybdates were grown by spontaneous crystallization.Characterisation
Relative densities were calculated from accurate measurements of the pellet size and weight, with comparison to the theoretical density deduced from the crystal structure.
Results and discussion
Crystal structure determination
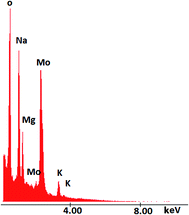
Data collection was performed with a CAD-4 Enraf-Nonius X-ray diffractometer15,16 using the MoKα (λ = 0.71069 Å) radiation at room temperature. An empirical psi-scan17 absorption correction was applied. The structure was solved by direct methods using SHELXS-97 program.18 Many following refinements by Fourier differences were necessary to find the positions of all atoms using SHELXL-97 program.18 All calculations were performed using the winGX-98 crystallographic software package.19 The Mg1 and Na1 atoms occupying the same site were constrained using the EXYZ and EADP instructions of SHELXL97 (ref. 18) to have the same positional and displacement parameters. The Na (4) and K (1) atoms were sharing the same site M1, the free variable restraints (SUMP) was required to restrain the sum of their occupation factors and the EXYZ and EADP. A qualitative EDX (energy-dispersive X-ray spectroscopy) analysis detected the presence of Na, Mo, Mg, K and oxygen (Fig. 1).Crystal and X-ray analysis data of the title compound are summarized in Table 1. The atomic coordinates, equivalent isotropic displacement parameters and selected interatomic distances are listed in Tables 2 and 3. The structure graphics were drawn with diamond 2.1 supplied by Crystal Impact.20
| Empirical formula | K0.13Na3.87Mg(MoO4)3 |
| Formula weight (g mol−1) | 598.18 |
| Crystal system, space group | Monoclinic, C2/c |
| Unit cell dimensions (Å) | a = 12.9325 (8), b = 13.5537 (9), c = 7.1627 (6), β = 112.212 (9)° |
| (Å3)/Z | 1162.33 (14)/4 |
| Calculated density (g cm−3) | 3.418 |
| Crystal size (mm) | 0.16 × 0.14 × 0.12 |
| μ(MoKα) (mm−1) | 3.490 |
| θ range (deg) for data collection | 2.3° ≤ θ ≤ 27° |
| Miller index ranges | −16 ≤ h ≤ 16, −1 ≤ k ≤ 17, −9 ≤ l ≤ 9 |
| Measured reflections | 2712 |
| Independent reflections | 1261 (Rint = 0.0272) |
| No. of variables | 97 |
| R[F2 > 2σ(F2)] | 0.0241 |
| wR(F2) | 0.0584 |
| GooF = S | 1.23 |
| Δρmax/Δρmin (e Å−3) | 0.81/−0.66 |
| Atom | x | y | z | U*eq (Å) | Occ, (<1) |
|---|---|---|---|---|---|
| Mo1 | 0.0000 | 0.21604 (3) | 0.7500 | 0.01849 (13) | |
| Mo2 | 0.23694 (3) | 0.60958 (2) | 0.12685 (5) | 0.02006 (11) | |
| Mg1 | 0.21624 (11) | 0.34005 (10) | 0.12690 (19) | 0.0161 (3) | 0.50 |
| Na1 | 0.21624 (11) | 0.34005 (10) | 0.12690 (19) | 0.0161 (3) | 0.50 |
| Na2 | 0 | 0.23648 (18) | 0.25 | 0.0250 (5) | |
| Na3 | 0.5 | 0.5 | 0.5 | 0.0412 (7) | |
| Na4 | 0 | 0.4915 (2) | 0.75 | 0.0440 (11) | 0.87 |
| K1 | 0 | 0.4915 (2) | 0.75 | 0.0440 (11) | 0.13 |
| O1 | 0.6702 (3) | 0.0051 (3) | 0.6099 (5) | 0.0434 (9) | |
| O2 | 0.3951 (3) | 0.3654 (2) | 0.2540 (5) | 0.0387 (8) | |
| O3 | 0.3789 (3) | 0.5894 (2) | 0.1839 (5) | 0.0306 (7) | |
| O4 | 0.4566 (3) | 0.7802 (2) | 0.5302 (4) | 0.0265 (6) | |
| O5 | 0.3261 (3) | 0.8305 (2) | 0.1080 (4) | 0.0314 (7) | |
| O6 | 0.2769 (3) | 0.8203 (3) | 0.6735 (4) | 0.0326 (7) |
| Mo1O4 | Mo2O4 | Mg1O6 | |||
|---|---|---|---|---|---|
| Mo1–O2i | 1.758 (3) | Mo2–O3 | 1.745 (3) | Na3–O3 | 2.523 (3) |
| Mo1–O2ii | 1.758 (3) | Mo2–O1v | 1.759 (3) | Na3–O3xi | 2.523 (3) |
| Mo1–O4iii | 1.771 (3) | Mo2–O5vi | 1.765 (3) | Na3–O2xi | 2.543 (3) |
| Mo1–O4iv | 1.771 (3) | Mo2–O6vii | 1.781 (3) | Na3–O2 | 2.543 (4) |
| Na3–O3xii | 2.686 (4) | ||||
| Na3–O3xiii | 2.686 (4) | ||||
| Na3O6 | Na2O6 | K1O8 | |||
|---|---|---|---|---|---|
| Na3–O3 | 2.523 (3) | Na2–O4iv | 2.393 (3) | K1–O1i | 2.684 (4) |
| Na3–O3xi | 2.523 (3) | Na2–O4xv | 2.393 (3) | K1–O1ii | 2.684 (4) |
| Na3–O2xi | 2.543 (3) | Na2–O5xv | 2.447 (3) | K1–O1xiv | 2.749 (4) |
| Na3–O2 | 2.543 (4) | Na2–O5iv | 2.447 (3) | K1–O1xv | 2.749 (4) |
| Na3–O3xii | 2.686 (4) | Na2–O3iv | 2.468 (4) | K1–O4iv | 3.093 (4) |
| Na3–O3xiii | 2.686 (4) | Na2–O3x | 2.468 (4) | K1–O4iii | 3.093 (4) |
| K1–O5iviii | 3.192 (4) | ||||
| K1–O5xvi | 3.192 (4) | ||||
The structural model is validated by the two structural tools, Bond Valence Sum BVS21,22 and Charge Distribution analysis CD.23–25
Both BVS and CD show adequate valences (V) and charges (Q) of all the cation sites. The structural model is thus validated, as shown by the dispersion factor of 3.1% which measures the deviation of the computed charges (Q) with respect to the formal oxidation numbers. The Bond Valence computation and Charge Distribution analysis are summarized in Table 4.
| Cation | q(i)sof(i) | Q(i) | V(i) | CN(i) | ECoN(i) |
|---|---|---|---|---|---|
| Mo1 | 6 | 6.040 | 5.946 | 4 | 3.998 |
| Mo2 | 6 | 5.987 | 5.913 | 4 | 3.992 |
| Mg1 | 2 | 2.032 | 1.573 | 6 | 5.922 |
| Na1 | 1 | 1.016 | 1.678 | 6 | 5.922 |
| Na2 | 1 | 1.001 | 1.068 | 6 | 5.962 |
| Na3 | 1 | 0.985 | 0.841 | 6 | 6.081 |
| M1 | 1 | 0.951 | 0.645 | 8 | 6.212 |
Rietveld analysis was performed in the 10–70° range using the single crystal structure data (Fig. 2). In fact, the crystal data and the structure refinement details were obtained from Crystal X-ray diffraction, the purpose of the Rietveld refinement is only to show the purity of powder and to show that there are no other additional peaks due to the presence of impurity. The Rietveld refinement was carried out using Topas Academic software,26 allowed a Quantitative Phase Analysis (QPA) and led to a weight proportion of 100% of K0.13Na3.87Mg(MoO4)3. In addition, the background is linear: this is an indicator of the good crystallinity of the powder.
The final agreement factors are RB: 4.689%; Rexp: 0.9; Rexp: 8%; Rp: 4.64%; Rwp: 7.44%.
Structure description and discussion
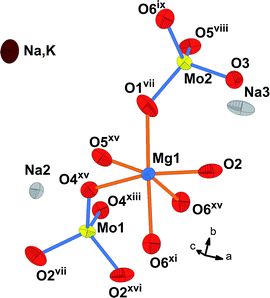
The crystal structure of K0.13Na3.87Mg(MoO4)3 crystal is closely related to the alluaudite type structure.27 It is isotypic with that of Na3In2As3O12 and Na3In2P3O12.28The asymmetric unit of K0.13Na3.87Mg(MoO4)3 (Fig. 3) consists of MgO6 octahedra, two MoO4 tetrahedra and four alkali cation sites ensuring the charge compensation.
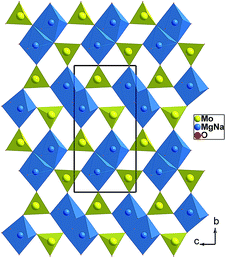
The structure can be described as a three-dimensional framework composed of pairs of edge-sharing (Mg,Na)2O10 dimmers, linked via vestige to Mo2O4 tetrahedra to form polyhedral infinite layers parallel to the (100) plane (Fig. 4).
The junction between layers is ensured by Mo1O4 tetrahedra. The 3-D framework shows two kinds of hexagonal tunnels along the c direction in which site Na+ and K+ (Fig. 5).
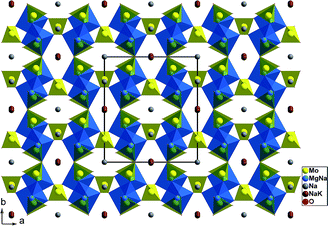 | ||
| Fig. 5 Projection of K0.13Na3.87Mg(MoO4)3 structure according to (001) direction, showing tunnels where monovalent cations are located. | ||
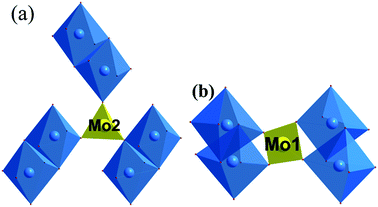
The Mo(1)O4 tetrahedron shares his four oxygen summits with four different Mg2O10 dimmers belonging to two adjacent layers. The Mo(2)O4 tetrahedron shares only three oxygen with three Mg2O10 units, the other one being free. The magnesium coordination has a very distorted octahedral geometry, as evidenced by the Mg–O bond distances which vary between 2.169 (4) and 2.292 (3) Å. The O–Mg–O bond angles vary between 82.60 (2)° and 174.75 (2)°. This distortion is probably due to the rigidity of [MoO4] units surrounding the Mg atom (Fig. 6).
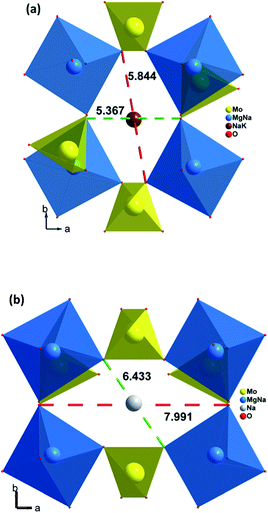
The two types of hexagonal channels along [001] are shown in Fig. 7.
The largest distance in the tunnel (a) (about 5.844 Å) is more than twice of the radii of the ions, thus more favorable to cationic displacement. Second, larger tunnels (b), with bottleneck widths varying from 6.433 to 7.991 Å, were larger than twice of the radii of the ions (2 × (rNa+ + rO2−) = 2 × (1.02 + 1.35)) and thus more favourable to Na+ displacement. The framework of the title compound is thus of open character and the isotropic motion of cations through the tunnels seems to be feasible. This factor led us to study the ionic conduction.
Thermal behaviour
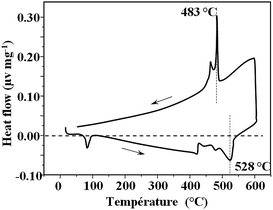
Differential Thermal Analyses (DTA) has been carried out in air from 20 °C to 600 °C. The DTA curve presented in Fig. 8 was recorded on as-prepared powder. An endothermic peak is observed on heating at 528 °C. A hysteresis is evidenced with an exothermic signal detected at 483 °C on cooling. An endothermic peak is observed on heating at about 100 °C. The TGA thermal curve shows the loss of molecular water at this temperature. The sample shows a hygroscopic nature. The phase transition was confirmed by electrical measurements (see below) and by high temperature X-ray diffraction. The high temperature disordered form is currently under investigation.Electrical properties
The control of the relative density of the ceramics wade realized by alternations of 15 min ball milling sequences with pauses of 10 min in between applied on the powders for a maximum total duration of 120 min.Fig. 9 shows the evolution, versus milling time, of the relative density of the pellets obtained after sintering at 650 °C. The relative density reaches 81% of the theoretical density after 60 minutes of milling. There is no more significant increase of the density after additional milling sequences. Adding Small amounts of powders (CuO, ZnO, …) may improve the sintering process and increase the final relative density, but some complex mechanisms are usually observed and the best conductivity is not always obtained for the highest relative density.29 Accordingly and to limit the pollution contribution of the milling apparatus on the electrical properties, the sample with 81% of the theoretical density was selected for the electrical characterization.
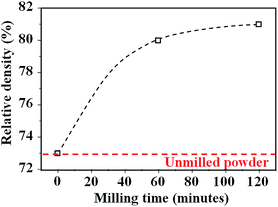 | ||
| Fig. 9 Evolution of the relative density of K0.13Na3.87Mg(MoO4)3 pellets sintered at 923 K as a function of the initial powder planetary ball milling time. | ||
The densification of the sample observed with the increased milling time is confirmed by the SEM micrographs, of the polished and thermally etched faces (50 °C below the sintering temperature) of K0.13Na3.87Mg(MoO4)3 pellets presented in Fig. 10.
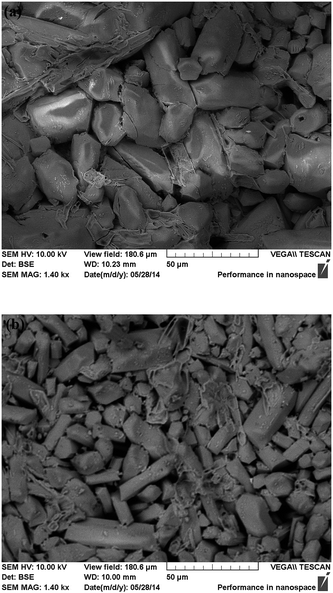 | ||
| Fig. 10 SEM micrographs of sintered K0.13Na3.87Mg(MoO4)3 pellets with different relative densities: (a) 73% and (b) 81%. | ||
In spite of a significant decrease of the mean grain size (approximately from 20 to 10 μm), a small increase of the relative density is obtained (8%). The geometric factor k of the obtained sample with 81% of relative density was 0.38 cm−1.
The complex impedance spectroscopy measurements were carried out with a frequency response analyzer (HP 4192A) from 5 Hz to 13 MHz with a signal amplitude of 0.05 V in air. The electrical measurements were made with the sample of 81% of the theoretical density in the temperature range 250–620 °C. Due to the relatively low density, the measured conductivity is only the lower limit of the intrinsic conductivity but the trend is certainly representative of the true behavior.
Fig. 11 show the Impedance spectra recorded at different temperatures after stabilization.
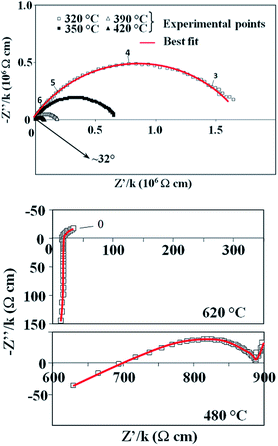 | ||
| Fig. 11 Experimental and calculated impedance spectra of K0.13Na3.87Mg(MoO4)3 recorded at different temperatures. | ||
The semicircles were fitted using an equivalent electrical circuit composed of a resistor R, connected in parallel with a constant phase element, CPE. The CPE contribution is an empirical impedance function of the type:
 | (1) |
 | (2) |
| ρ = R/k; ε0εR = Ck | (3) |
The refined parameters of R//CPE electrical models are given in Table 5 for different temperatures from 290 °C to 460 °C. At low temperature, highly depressed (±32°) and well defined semicircles are observed, indicating rather heterogeneous electrical properties. Given the porosity content (19%), one would expect in this high frequency contribution an interfacial part (grain boundaries or other microstructural effects). However, no reliable deconvolution can be obtained from the high frequency semicircle. Moreover, the capacitances obtained from the impedance spectra are in the range commonly observed for bulk ionic mobility. Without references values of Ck and ω0 (Table 5), we assume that this high frequency contribution is mainly due to the bulk ionic mobility, with probably a grain boundary part, as observed in other ionic conductors.30 At low temperature, the low frequency signals indicating electrochemical interfacial processes associated to the electrode contribution are not observed. The large inductive effect observed at high temperature is instrumental. It is almost constant in the measurement thermal range. It is negligible at low temperature when the resistance of the sample is high, and becomes prevalent at high temperature when the measured resistance is low (and capacity high), especially above the phase transition. This effect is well known for our measurement setup and is not a problem for the determination of the electrical parameters from the impedance spectra.31
| T (°C) | ρ = R/k (104 Ω cm) ± 0.1 | Ck (10−12 F cm−1) ± 0.1 | β (°) ± 1 | ω0 (104 rad s−1) ± 0.1 | σ (10−7 S cm−1) ± 0.1 |
|---|---|---|---|---|---|
| 290 | 402.8 | 12.6 | 31 | 2.1 | 2.4 |
| 320 | 173.9 | 11.4 | 32 | 5.0 | 5.7 |
| 350 | 69.4 | 10.3 | 33 | 14.1 | 14.4 |
| 390 | 18.7 | 8.96 | 34 | 62.5 | 53.4 |
| 420 | 7.4 | 7.84 | 36 | 182.8 | 135.1 |
| 460 | 2.2 | 6.74 | 38 | 741.5 | 454.5 |
Above 500 °C, the high frequency semicircles are no longer observed. The spectra consist in a strong inductive effect concealing the bulk polarisation. At high temperature, a low frequency contribution indicates the presence of exchanges with the gas phase, and then the existence of significant ionic conductivity in the ceramic. At 620 °C, a fit of the low frequency part of the impedance spectra (Fig. 11) to a R//CPE circuit gives C = 2.7 × 10⁻³ F, ω0 = 19 rad s−1. These values, typical for electrode reactions, provide a confirmation of the existence of ionic mobility.
Based on the structure analysis provided in this paper and on previous reports about neighbouring phases,32 the ionic conductivity observed in K0.13Na3.87MgMo3O12 is most probably due to monovalent Na+ and K+ cations anisotropic mobility.
The temperature dependence of the electrical conductivity of K0.13Na3.87Mg(MoO4)3 is shown in Fig. 12 in an Arrhenius plot. A high conductivity jump of about two orders of magnitude in the Arrhenius plot is observed above 528 °C. The transition temperature correlates with DTA data (Fig. 8). The peaks at 528 °C and 483 °C respectively on heating and cooling on the DTA curve were then attributed to an order/disorder type phase transition, accompanied with a strong increase of the ionic conductivity. This kind of conductivity increase in fast ionic conductors is usually attributed to a first-order superionic phase transition.33,34 Below and above the transition temperature, linear evolutions are observed with activation energies of 1 and 0.7 eV respectively. These values are compatible with cationic conductivity mechanisms.31
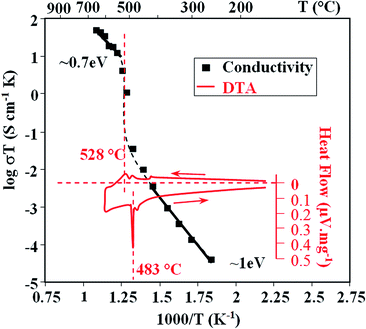 | ||
| Fig. 12 Arrhenius plots of conductivity of K0.13Na3.87Mg(MoO4)3 and differential thermal Analysis (DTA) curve. | ||
At 580 °C, the conductivity was found to be 3.8 × 10⁻² S cm−1. Typical conductivity values of molybdates reach 10−4 S cm−1.35–37 Among this family of materials, the experimental values obtained for K0.13Na3.87Mg(MoO4)3 are high. They are comparable to that conductivity of superionic conductors.38,39 The title compound K0.13Na3.87Mg(MoO4)3 can be considered as a promising solid electrolyte due to the observed high conductivity.
Conclusions
The new triple molybdate K0.13Na3.87Mg(MoO4)3 was obtained by solid state reaction. The crystallographic characteristics were refined using single crystal and powder X-ray diffraction. The sample crystallized in monoclinic symmetry with C2/c space group (Z = 4) and the unit cell parameters are: a = 12.9325 (8) Å, b = 13.5537 (9) Å, c = 7.1627 (6) Å, β = 112.212 (9)°. The structure has an open framework formed by infinite chains composed of edge-sharing (Mg/Na)2O10 dimers, which are linked together via bridging MoO4 tetrahedra, yielding to two distinct types of hexagonal tunnels in which Na+ and K+ cations reside. The electrical properties of K0.13Na3.87Mg(MoO4)3 sample with relative density of 81% were studied using complex impedance spectroscopy. The Arrhenius plots of K0.13Na3.87Mg(MoO4)3 show a jump in conductivity. Above 528 °C, the electrical conductivity reaches 10−2 S cm−1. This increase in the conductivity was attributed to an order/disorder type phase transition. The transition temperature correlates with thermal analysis. The title compound K0.13Na3.87Mg(MoO4)3 can be considered as a promising solid electrolyte due to high electrical conductivity.Acknowledgements
Financial support from the Ministry of Higher Education, Scientific Research and Technology of Tunisia is gratefully acknowledged. The authors thank Pr. François Goutenoire from Université du Maine for high temperature X-Ray diffraction, Dr Vincent Martin for thermal analysis.Notes and references
- S. F. Solodovnikov, R. F. Klevtsova and P. V. Klevtsov, Zh. Strukt. Khim., 1994, 35(6), 145 CAS.
- A. K. Ivanov-Shits, A. V. Nistyuk and N. G. Chaban, Neorg. Mater., 1999, 15(7), 891 Search PubMed.
- K. M. Begam, S. Selladurai, M. S. Michael and S. R. S. Prabaharan, Ionics, 2004, 10(1–2), 77 CrossRef CAS.
- V. A. Isupov, Ferroelectrics, 2005, 322, 83 CrossRef CAS.
- J. A. Ibers and G. W. Smith, Acta Crystallogr., 1964, 17, 190–197 CrossRef CAS.
- R. F. Klevtsova and S. A. Magarill, Kristallografiya, 1970, 15, 710–715 CAS.
- B. I. Lazoryak and V. A. Efremov, Zh. Neorg. Khim., 1987, 32(3), 652–656 CAS.
- Yu. A.
![[thin space (1/6-em)]](https://www.rsc.org/images/entities/char_2009.gif) Velikodny, PhD thesis (Chemistry), Moscow
Velikodny, PhD thesis (Chemistry), Moscow![[thin space (1/6-em)]](https://www.rsc.org/images/entities/char_2009.gif) State University, Russian Federation, Moscow, USSR, 1975, p. 121.
State University, Russian Federation, Moscow, USSR, 1975, p. 121. - J. Grins and M. Nygren, Solid State Ionics, 1983, 9–10, 859 CrossRef CAS.
- J. P. Morales, L. Herman, E. Wang, M. T. Tsai, J. G. Lee and M. Greenblatt, Solid State Ionics, 1990, 38, 275 CrossRef CAS.
- A. A. Iljina, I. A. Stenina, A. G. Veresov and A. B. Yaroslavzev, Zh. Neorg. Khim., 2007, 52, 525 Search PubMed.
- V. G. Grossman, B. G. Bazarov, K. N. Fedorov and Zh. G. Bazarova, Russ. J. Appl. Chem., 2010, 83, 1074–1076 CrossRef CAS.
- O. D. Chimitova, B. G. Bazarov, K. N. Fedorov and Zh. G. Bazarova, Russ. J. Appl. Chem., 2008, 81, 2043–2044 CrossRef CAS.
- N. I. Sorokin, Phys. Solid State, 2009, 51(6), 1128–1130 CrossRef CAS.
- A. J. M. Duisenberg, J. Appl. Crystallogr., 1992, 25, 92–96 CrossRef CAS.
- J. Macíček and A. Yordanov, J. Appl. Crystallogr., 1992, 25, 73–80 CrossRef.
- A. C. T. North, D. C. Phillips and F. S. Mathews, Acta Crystallogr., Sect. A: Cryst. Phys., Diffr., Theor. Gen. Crystallogr., 1968, 24, 351–359 CrossRef.
- G. M. Sheldrick, Acta Crystallogr., Sect. A: Found. Crystallogr., 2008, 64, 112–122 CrossRef CAS PubMed.
- L. J. Farrugia, J. Appl. Crystallogr., 1999, 32, 837–838 CrossRef CAS.
- K. Brandenburg and M. Berndt, Diamond Version 2.1. Crystal Impact Bonn, 2001 Search PubMed.
- I. D. Brown, Phys. Chem. Miner., 1987, 15, 30–34 CrossRef CAS.
- Softbv web page by Pr. Stefan Adams: http://kristall.uni.mki.gwdg.de/softbv/.
- R. Hoppe, S. Voigt, H. Glaum, J. Kissel, H. P. Muller and K. Bernet, J. Less-Common Met., 1989, 156, 105–122 CrossRef CAS.
- M. Nespolo, CHARDT-IT, A Program to Compute Charge Distributions and Bond Valences in Non-molecular Crystalline Structures, LCM3 B, University Henri Poincare Nancy I, France, 2001 Search PubMed.
- M. Nespolo, G. Ferraris, G. Ivaldi and R. Hoppe, Acta Crystallogr., 2001, 57, 652–664 CAS.
- A. A. Coelho, TOPAS, version 4.2, Brisbane, 2009 Search PubMed.
- P. B. Moore, Am. Mineral., 1971, 56, 1955–1975 CAS.
- K. H. Lii and J. H. Ye, J. Solid State Chem., 1997, 133, 131–137 CrossRef PubMed.
- M. Arab Pour Yazdi, P. Briois, S. Georges, A. L. Shaula, A. Cavaliero and A. Billard, J. Electrochem. Soc., 2010, 157(11), B1582–B1587 CrossRef CAS PubMed.
- S. Georges, O. Bohnké, F. Goutenoire, Y. lagnant and J. Fouletier, Solid State Ionics, 2006, 177, 231–241 Search PubMed.
- N. Bailly, E. Jurado and S. Georges, Electrochem. Solid-State Lett., 2012, 15(4), F16–F18 CrossRef CAS PubMed.
- L. Sebastian, Y. Piffard, A. K. Shukla, F. Taulelle and J. Gopalakrishnan, J. Mater. Chem., 2003, 13, 1797–1802 RSC.
- A. A. Savina, S. F. Solodovnikov, D. A. Belov, O. M. Basovich, Z. A. Solodovnikova, K. V. Pokholok, S. Y. Stefanovich, B. I. Lazoryak and E. G. Khaikina, J. Solid State Chem., 2014, 220, 217–220 CrossRef CAS PubMed.
- S. G. Dorzhieva, B. G. Bazarov, A. K. Subanakov and J. G. Bazarova, J. Solid State Chem., 2013, 199, 21–26 CrossRef CAS PubMed.
- N. Imanaka, Y. Kobayashi, S. Tamura and G. Adachi, Solid State Ionics, 2000, 136–137, 319–324 CrossRef CAS.
- S. Obbade, S. Yagoubi, C. Dion, M. Saadi and F. Abraham, J. Solid State Chem., 2003, 174, 19–31 CrossRef CAS.
- V. Trnovcova, A. Skubla and D. Schultze, Solid State Ionics, 2005, 176, 1739–1742 CrossRef CAS PubMed.
- M. Hayashi, H. Sakaguchi, S. Takai and T. Esaka, Solid State Ionics, 2001, 140, 71–76 CrossRef CAS.
- C. M. C. Vera and R. Aragon, Mater. Sci. Eng., B, 2005, 121, 187–191 CrossRef PubMed.
Footnote |
| † CCDC 1045308. For crystallographic data in CIF or other electronic format see DOI: 10.1039/c5ra02276b |
| This journal is © The Royal Society of Chemistry 2015 |

