
Effect of dopant concentration on the spectroscopic properties in an In3+ doped (0, 1, 2 and 4 mol%) Yb:Tm:LiNbO3 crystal
Li Dai*ab,
Zhehua Yana,
Shanshan Jiaoa,
Chao Xuc and
Yuheng Xuc
aApplied Science College, Harbin University of Science and Technology, Harbin 150080, China. E-mail: daili198108@126.com; Tel: +86 451 86390731
bState Key Laboratory of Crystal Material, Shandong University, Jinan, 250100, China
cDepartment of the Applied Chemistry, Harbin Institute of Technology, Harbin 150001, China
First published on 15th April 2015
Abstract
A series of Yb:Tm:LiNbO3 crystals with x mol% In3+ ions (x = 0, 1, 2 and 4 mol%) were grown by a conventional Czochralski technique for the first time. The In, Yb and Tm contents in the crystals were measured by an inductively coupled plasma atomic emission spectrometer (ICP-AES). The results revealed that the segregation coefficients of Yb3+ and Tm3+ ions decreased with increase of the In3+ doping concentration. Also the segregation coefficient of In3+ ions increases with the increasing In3+ doping concentration in the melts, and it is close to one. The IR transmission spectra and UV-vis spectra were measured to analyze the defect structure of the crystals.
1. Introduction
Tm3+-based lasers emitting in the wavelength region of 2 μm have attracted much attention in recent years such as in atmospheric, telecommunications, medicinal, and space application fields.1–3 The line width of Tm3+ ions (associated with 3F4 → 3H6 transitions) corresponds to the wavelength range of 2 μm, which is similar to Ho3+ ions (associated with 5I7 → 5I8 transitions), but the absorption range is wide and the absorption cross section is large. The LiNbO3 crystal is an excellent material exhibiting desirable characteristics such as electro-optic, acousto-optic, piezo-electric and nonlinear optical performances.4,5 From a materials point of view, several RE-doped LiNbO3 have been under study in the form of solid state laser devices and planar waveguide lasers. Yb3+ ion co-doped crystals have received considerable attention due to its high absorption cross-section in the near-infrared, suitable for convenient excitation with commercially available optical sources. Recently, many efforts have been devoted to the upconversion luminescence property in RE-doped LiNbO3 crystal. The basic optical properties of Tm:LiNbO3 and Yb:LiNbO3 crystals have been already investigated6,7 and are considered to be excellent upconversion media. Unfortunately, to our best knowledge, the properties of Yb:Tm:LiNbO3 crystal is still to be scrutinized. In recent years, 2 μm lasers have attracted a large amount of interests due to their wide tenability and high efficiency, which have increasingly important application in remote sensing, lidar and material processing, etc. It is believed that the study of Yb:Tm:LiNbO3 crystals will be attractive researches.The light induced refractive index change, called photorefractive effect, limits the performance of Yb:Tm:LiNbO3 crystals. Until now, the comprehensive studies on the suppression of the optical damage caused by the high laser intensity in LiNbO3 crystal have been investigated. As an effective solution to this problem, it has been found that the significant resistance to optical damage in LiNbO3 can be improved by doping with certain divalent, trivalent or tetravalent cations (such as Mg2+, Zn2+, In3+, Sc3+, Hf4+ and Zr4+) above the threshold concentration, see ref. 8–13.
In this letter, In:Yb:Tm:LiNbO3 crystals with different concentrations of In2O3 (0, 1, 2 and 4 mol%) were successfully grown by the Czochralski method. The defect structures were analyzed via IR transmission spectrum and the UV-vis absorption spectra. Finally, the mechanism of the relationship between the spectroscopic properties and the concentration of In2O3 was thoroughly discussed.
2. Experiments
In this experiment, congruent LiNbO3 crystals codoped with 0.5 mol% Yb2O3, 0.5 mol% Tm2O3, and various concentration of In2O3 were grown. The composition of melt was chosen as Li/Nb = 48.6/51.4. The In2O3 concentrations were 0, 1, 2 and 4 mol%, respectively, which were labeled as 1#, 2#, 3# and 4#, as are shown in Table 1. All raw materials precisely weighed and thoroughly mixed for 24 h, heated up to 750 °C for 2 h to remove CO2, and then further sintered at 1050 °C for 2 h. The crystals were grown in open atmosphere by traditional Czochralski method along ferroelectric z-axis with the rotation rate of 15–20 rpm and pulling speed of 1–1.5 mm h−1. After growth, the crystals were cooled down to room temperature at a rate of 60 °C h−1. The crystals were polarized at 1200 °C with a current density of 5 mA cm−2. The wafers with diameter of 10 × 20 × 2 mm (x × z × y) were cut from the middle part along y-face and polished to optical grade both of sides for optical tests. Fig. 1 showed the wafers of four In:Yb:Tm:LiNbO3 samples in experiment.| Sample | 1# | 2# | 3# | 4# |
|---|---|---|---|---|
| In3+ in the crystal (mol%) | — | 0.762 | 1.654 | 3.956 |
| Keff of In3+ | — | 0.762 | 0.827 | 0.989 |
| Yb3+ in the crystal (mol%) | 0.848 | 0.793 | 0.754 | 0.712 |
| Keff of Yb3+ | 0.848 | 0.793 | 0.754 | 0.712 |
| Tm3+ in the crystal (mol%) | 0.877 | 0.849 | 0.831 | 0.816 |
| Keff of Tm3+ | 0.877 | 0.849 | 0.831 | 0.816 |
| Crystal size (mm2) | Φ25 × 28 | Φ25 × 38 | Φ25 × 35 | Φ25 × 25 |
| Axial temperature gradient (°C cm−1) | 25–30 | 30–45 | 30–35 | 30–35 |
| Radial temperature gradient (°C cm−1) | 4–6 | 4–6 | 3–5 | 3–5 |
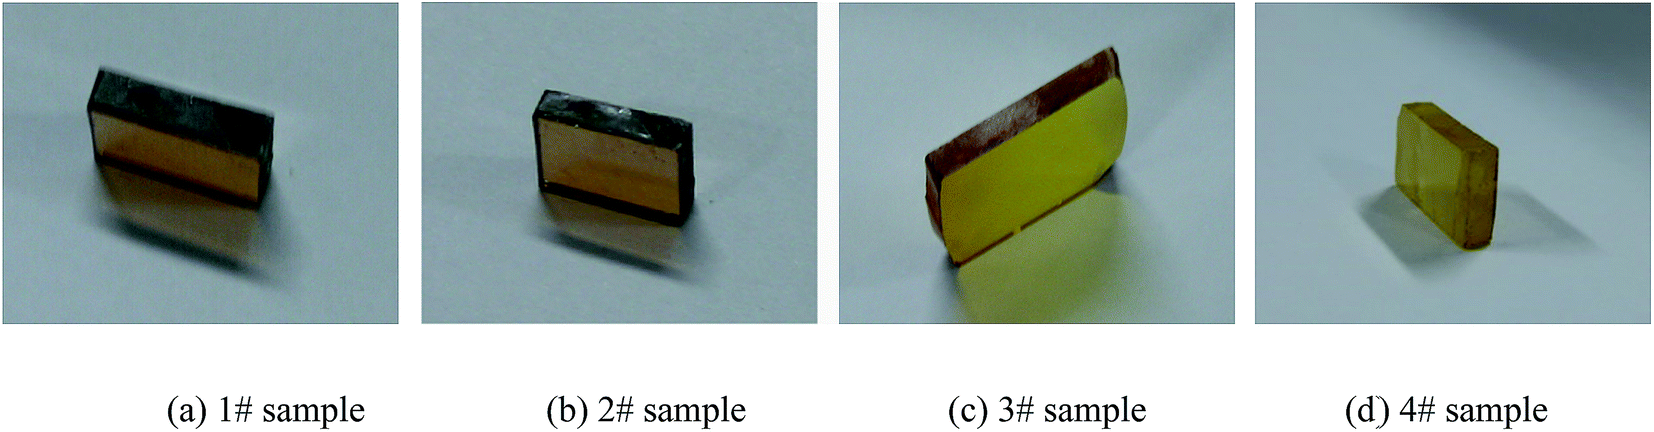 | ||
| Fig. 1 Wafers of four In:Yb:Tm:LiNbO3 crystals in experiment. | ||
We analyzed the concentration of In3+, Yb3+ and Tm3+ in the crystals with an inductively coupled plasma atomic emission spectrometer (ICP-AES, Optima 5300DV). The X-ray powder diffraction patterns were recorded using a SHMADZU XRD-6000 diffractometer with monochromatic Cu Kα radiation. The OH− absorption spectra of In:Yb:Tm:LiNbO3 crystals were recorded by an Avator-360 FT-IR spectrometer at room temperature. The scanning was carried out between 400 and 4000 cm−1 with the scanning step of 1 cm−1. In our later discussion, 3400 to 3600 cm−1 was chosen as the effective range. The ultraviolet-visible (UV-vis) absorption spectra of the samples were measured with a CARY UV-visible spectrometer, with the incident light transmitting along the y axis at room temperature. The measurement range was from 300 to 1100 nm.
3. Results and discussion
Preparation of standards solution: 99.99% purity In2O3, Yb2O3 and Tm2O3 were put in polytetrafluoroethylene (PTFE) beaker, plus nitric acid and hydrofluoric acid solution drops, and then dissolved by heating to make-up 40 g L−1 stock solution and saved in PTFE bottle. From each top, middle and lower parts of the crystal, cut out a small crystal specimens and placed in an agate mortar grind into fine powder, with the balance millionth 0.05 g powder sample is weighed out. Powder was placed in a PTFE beaker, added hydrofluoric acid and nitric acid solution each 5 mL. After preheated for 25 minutes on a heated plate, using fully automated microwave digestion oven to microwave sample digestion. Then, the sample was heated and titrated with perchloric acid to eliminate hydrofluoric acid and protect the testing equipment from corrosion. At the same time, the digestive process was finished. After cooling to room temperature, the sample solution was mixed with 5% of nitric acid and played in the 50 ml flask for testing, the volume of the solution was set up by addition of 5% of nitric acid. Fig. 1 showed the photos of the In:Yb:Tm:LiNbO3 crystals samples.The concentrations of In3+, Yb3+ and Tm3+ ions in the In:Yb: Tm:LiNbO3 crystals and effective distribution coefficient (Keff) of ions are listed in Table 1. The effective distribution coefficient of In3+, Yb3+ and Tm3+ ions are calculated by comparing the measured In3+, Yb3+ and Tm3+ ions concentration in the crystal and melt. The dependence of the segregation coefficients of In3+, Yb3+ and Tm3+ ions on the In2O3 concentration in the melts is shown in Fig. 2. It is clearly seen that the effective distribution coefficient of In3+ ion increases with the increasing In2O3 concentration in the melts, with the maximum close to one, indicating that it distributes uniformly in crystal. It can be further seen from Fig. 2 that the effective distribution coefficient of Yb3+ and Tm3+ ions decreases as the doping concentration of In3+ increases in the melts. When In3+ ion entered in Yb:Tm:LiNbO3 crystal, it could readily occupy intrinsic defect (NbLi4+) sites and the NbLi4+ concentration was sharply reduced, which suppressed the entrance of Yb3+ and Tm3+ ions into crystal. Thus, the effective distribution coefficient of ions Yb3+ and Tm3+ was continuously reduced.
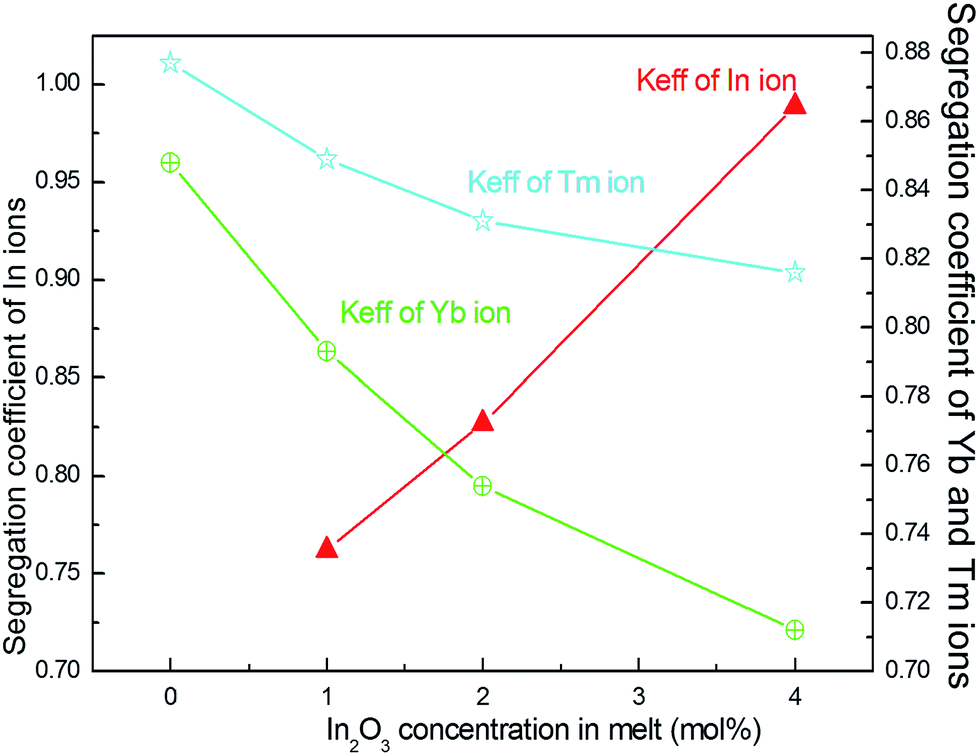 | ||
| Fig. 2 The dependence of the segregation coefficient of In, Yb, and Tm ions on the In2O3 concentration in the melts. | ||
The XRD experimental results are shown in Fig. 3. It can be seen that the dope of In3+, Yb3+ and Tm3+ ions did not create new diffraction peak. This verified that after adding the In3+, Yb3+ and Tm3+ ions to crystal lattice of LiNbO3, the structure did not change dramatically.14 Based on the ion radius approximation principle in the crystal field theory, the doped ion entered crystal lattice by replacing the Li+ and Nb5+ ion instead of occupied the slot among crystal lattice. Hence to obtain the formulated In:Yb:Tm:LiNbO3 crystals solid solution as a single phase.
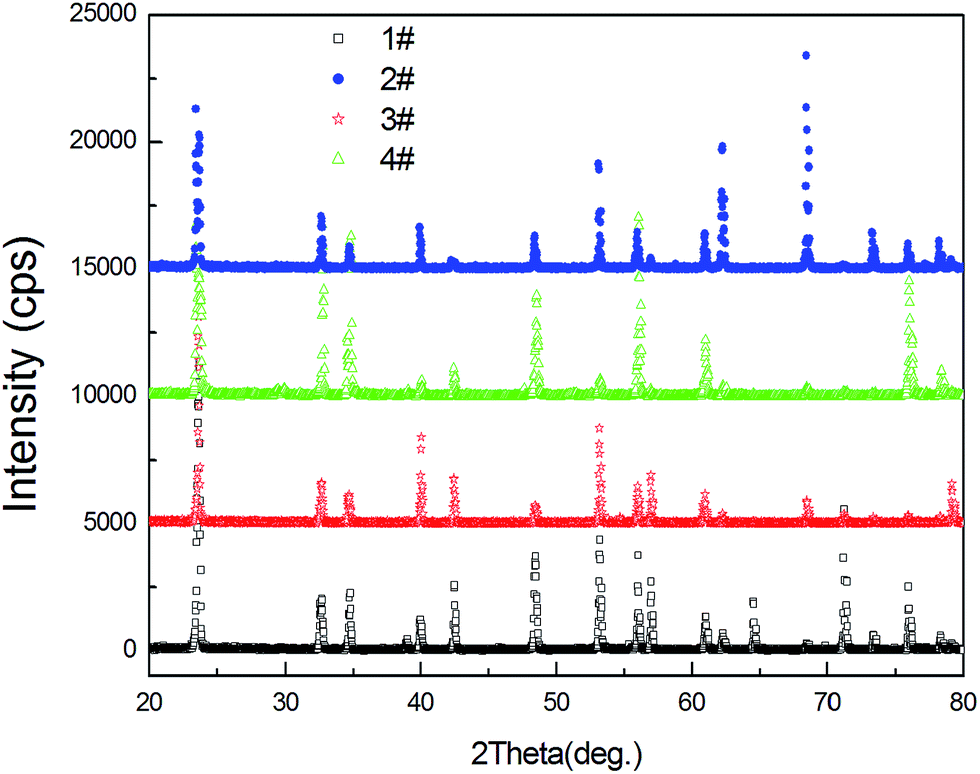 | ||
| Fig. 3 X-ray powder diffraction patterns of In:Yb:Tm:LiNbO3 crystals. | ||
In course of growth, H2O vapors can be introduced into the crystals through formation of O–H bonds. The OH− absorption spectra measurement results of In:Yb:Tm:LiNbO3 crystals are represented in Fig. 4. Fig. 4 summarizes the OH− absorption peak of samples 1#, 2#, 3# and 4# are located at 3482, 3482, 3507 and 3508 cm−1, respectively. It can be found that the spectra belonging to In3+ of different concentration form different groups in In:Yb:Tm:LiNbO3 crystals. According to Li-site vacancy model, in pure congruent LiNbO3 crystal, the ratio of [Li]/[Nb] is 0.946. There always exist intrinsic lattice defects, such as anti-site Nb (NbLi4+) and Li vacancy (VLi−) defects. The electropositive H+ ions easily attracted by the electronegative VLi− and formed VLi−–OH− complexes, whose vibrational absorption peak is located at 3482 cm−1.15 In Yb:Tm:LiNbO3 crystals (i.e. for 1# sample), Yb3+ and Tm3+ replace NbLi4+, forming YbLi2+ and TmLi2+. When the concentration of In3+ ions is 1 mol% in the melt, below its threshold value (i.e. for 2# sample), Yb3+ and Tm3+ ions substitute for NbLi4+ defects and exist in the form of YbLi2+ and TmLi2+ in LiNbO3, while these defects repel the H+ and affect the VLi−–OH− complexes only as ions around them and the peak position is at about 3482 cm−1. When the concentration of In3+ ions exceeded the threshold (i.e. for 3# and 4# samples), all NbLi4+ defects disappear and InNb2− defect structures appears as the In3+ ions enter the normal Nb sites. Meanwhile, the amount of Yb3+ and Tm3+ located at Nb sites increases, namely, the amount of YbNb2− and TmNb2− increases. The InNb2− in the InNb–H–O defect structure has intensive attraction to H+, more energy is required for O–H vibration, and the corresponding absorption is dominant at about 3507 cm−1. According to the analysis above, we can conclude that the In doping threshold concentration is about 1.5–2.0 mol% as previously reported in.16–18.
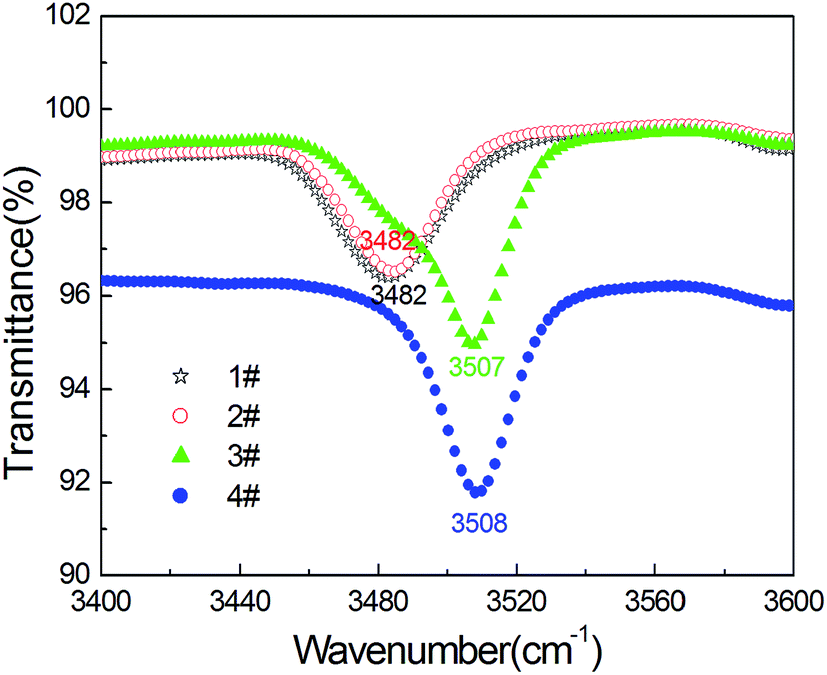 | ||
| Fig. 4 The IR absorption band related to the OH− vibration in In:Yb:Tm:LiNbO3 crystals. | ||
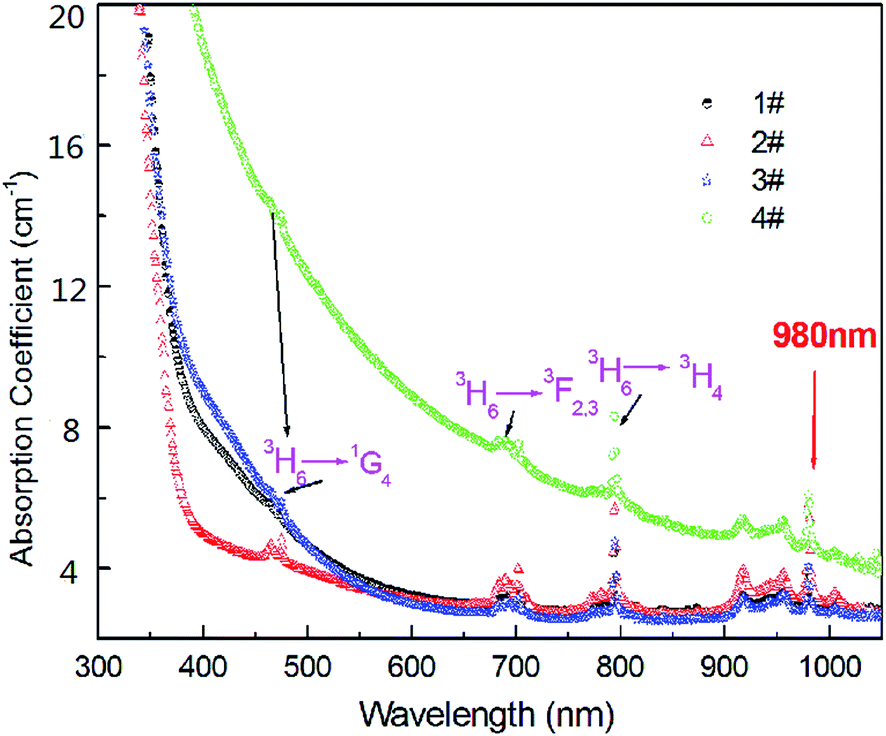
To confirm our significant conclusion, we further studied the UV-visible absorption spectra of four samples cut from the top, center and bottom of the grown crystals. Fig. 5 shows the UV-visible absorption spectra of the In:Yb:Tm:LiNbO3 crystals with different concentration of In3+. The absorption edge of LiNbO3 crystals is used to determine the composition.19 The absorption edge at the level of a = 15 cm−1 or a = 20 cm−1 is usually used to quantify the defects in a LiNbO3 crystal.20 In our experiment, the referred UV-vis optical absorption coefficient for determination of the position defined as 20 cm−1. It can be seen from Fig. 5 that the UV-vis absorption edges of the 1#, 2#, 3# and 4# samples are located at 353, 346, 335 and 379 nm, respectively. The absorption peak of In:Yb:Tm:LiNbO3 crystals is first violet-shifted with the increasing In2O3 doping concentration in the melt, then red-shifted when the doping concentration of In3+ is 4 mol%. The shift of absorption edge (4# sample) is up to 26 nm with respect to position of the Yb:Tm:LiNbO3crystal. It is a remarkable fact that when In3+ doping concentration reaches 4.0 mol%, namely 4# sample, the absorption edge of shifts to the red substantially relative to 3#. There is some absorption band located at 300–1050 nm, which is attributed to absorption of the Tm3+and Yb3+ions. The three absorption bands of Tm3+ ions centered at 465 nm, 692 and 798 nm are assigned to the 3H6 → 1G4, 3H6 → 3F2,3 and 3H6 → 3H4 transitions.21 And 980 nm absorption peak correspond to transition from the 2F7/2 ground state of Yb3+ ion to the excited state 2F5/2.
 | ||
| Fig. 5 The UV-vis absorption spectra of the In:Yb:Tm:LiNbO3 crystals. | ||
It's common knowledge that the shift of absorption edge can be explained by the polarization ability of the doped ions.22,23 The valence electron transition energy, which is from the 2p orbits of O2− to the 4d orbits of Nb5+, determines the fundamental absorption edge of the LiNbO3 crystal.23 It can be concluded from the previous researches that the violet shift of the absorption edge is attributed to the increasing in the ability of adjacent dopant ions to polarize an O2− ion shortens the band gap of the valence electron transition. Otherwise, the absorption edge of sample shifts toward the infrared band. In fact, the polarization ability of Nb5+ is smaller than that of In3+, Yb3+, Tm3+ and Li+. In Yb:Tm:LiNbO3 crystal, Yb3+ ions and Tm3+ ions replace NbLi4+ and form YbLi2+ and TmLi2+. When the In3+ enter Yb:Tm:LiNbO3 crystals, because of the polarization ability of In3+ ions is much smaller than that of NbLi4+, the absorption edge of In:Yb:Tm:LiNbO3 crystal (2# sample) shifts to the ultraviolet band compared with that of Yb:Tm:LiNbO3 crystal (1# sample). When the concentration of In3+ ions in the melt exceeded the threshold value (3# sample), NbLi4+ defects almost disappeared, the In3+ ions began to enter the normal Li and a little bit of Nb sites. As the polarization ability of In3+ was lower than that of Li+, which caused the deformation of O2− ions electron clouds, the width of the forbidden band increases and absorption edge continuous shifts to the violet. When the In2O3 doping concentration in the melts is up to 4.0 mol% (4# sample), part of In3+, Yb3+ and Tm3+ ions begin occupies Nb sites form InNb2−, YbNb2− and TmNb2−. As the polarization ability of In3+ ion is smaller than that of Nb5+, red shift of the absorption edge in 4# relative to 1#. This discussion of dopant occupancy is consistent with the analysis result of experimental shown in OH− absorption spectra.
4. Conclusions
In conclusion, In:Yb:Tm:LiNbO3 crystals with different concentrations of In2O3 (0, 1, 2 and 4 mol%) were successfully grown by the Czochralski method. The inductively coupled plasma optical emission spectrometry, IR transmission spectrum and the UV-vis absorption spectra were measured and discussed in terms of the spectroscopic properties in In3+ doped (0, 1, 2 and 4 mol%) Yb:Tm:LiNbO3 crystal. The effective distribution coefficient of In ion increases with the increasing In2O3 concentration in the melts, and it is close to one, indicating that In3+ distributes uniformly in crystal. The UV-vis absorption spectra showed that the absorption edges of In:Yb:Tm:LiNbO3 crystals is first violet-shifted with the increasing In2O3 doping concentration in the melt, then red-shifted when the doping concentration of In3+ is 4 mol%. It was suggested that for low concentration of In3+ ion, the all dopant ions first occupy the Nb anti-sites or Li vacancies and when the concentration of In3+ was reaches 4.0 mol% they may replace normal Nb sites.Acknowledgements
This work is supported by National Natural Science Foundation of China (no. 51301055), Provincial University Key Lab Open Foundation for Materials Research and Application in Harbin University of Science and Technology (no. 2013) and the Opening Project of State Key laboratory of Crystal Material (no. KF1409).References
- A. Bensalah, K. Shimamura and V. Sudesh, et al., J. Cryst. Growth, 2001, 223, 539–544 CrossRef CAS.
- R. A. McFarlane, J. Opt. Soc. Am. B, 1994, 11, 871–880 CrossRef CAS.
- C. Li, X. Zhang and C. Wang, et al., Chin. J. Inorg. Chem., 2011, 27, 6–10 Search PubMed.
- D. Janner, D. Tulli, M. García-Granda, M. Belmonte and V. Pruneri, Laser Photonics Rev., 2009, 3, 301–313 CrossRef CAS PubMed.
- T. Y. Fan, A. Cordova-Plaza, M. J. F. Digonnet, R. L. Byer and H. J. Shaw, J. Opt. Soc. Am. B, 1986, 3, 140–148 CrossRef CAS.
- M. Jelínek, J. Oswald, T. Kocourek, K. Rubešová, P. Nekvindová, D. Chvostová, A. Dejneka, V. Železný, V. Studnička and K. Jurek, Laser Phys., 2013, 23, 105819 CrossRef.
- V. T. Pham, S. K. Lee, M. T. Trinh, K. S. Lim, D. S. Hamilton and K. Polgar, Opt. Commun., 2005, 248, 89–96 CrossRef CAS PubMed.
- T. R. Volk and N. M. Rubinina, Ferroelectr., Lett. Sect., 1992, 14, 37–43 CrossRef CAS.
- X. Zhen, Q. Li, L. Wang and Y. Xu, J. Cryst. Growth, 2005, 284, 270–274 CrossRef CAS PubMed.
- S. Li, S. Liu, Y. Kong, J. Xu and G. Zhang, Appl. Phys. Lett., 2006, 89, 101126–101134 CrossRef PubMed.
- Z. Xu and Y. Xu, Mater. Lett., 2007, 61, 3243–3246 CrossRef CAS PubMed.
- L. Dai, Y. Su, S. Wu, J. Guo, C. Xu and Y. Xu, Opt. Commun., 2011, 284, 1721–1725 CrossRef CAS PubMed.
- L. Sun, F. Guo, Q. Lv, H. Yu, H. Li and W. Cai, Cryst. Res. Technol., 2007, 42, 1117–1122 CrossRef CAS PubMed.
- Y. Fan, A. Cordova-Plaza and M. J. F. Digonnet, J. Opt. Soc. Am. B, 1986, 3, 140 CrossRef.
- O. F. Schirmer, O. Thiemann and M. Wöhlecke, J. Phys. Chem. Solids, 1991, 52, 185–200 CrossRef CAS.
- T. Volk, N. Rubinina and M. Wöhlecke, J. Opt. Soc. Am. B, 1994, 11, 1681–1687 CrossRef CAS.
- N. Y. Kamber, J. Xu, S. M. Mikha, G. Zhang and G. Zhang, Opt. Commun., 2000, 176, 91–96 CrossRef CAS.
- H. Qiao, J. Xu, Q. Wu, X. Yu, Q. Sun, G. Zhang, X. Zhang and T. Volk, Opt. Mater., 2003, 23, 269–277 CrossRef CAS.
- I. Földvári, K. Polgár and R. Voszka, Cryst. Res. Technol., 1984, 19, 1659–1661 CrossRef PubMed.
- K. Polgár, Á. Péter and L. Kovács, J. Cryst. Growth, 1997, 177, 211–216 CrossRef.
- C. Sun, F. Yang, T. Cao, Z. You, Y. Wang, J. Li, Z. Zhu and C. Tu, J. Alloys Compd., 2011, 509, 6987–6993 CrossRef CAS PubMed.
- L. Dai, C. Xu, Z. Qian, J. Li, D. Li and Y. Xu, J. Lumin., 2013, 134, 255–259 CrossRef CAS PubMed.
- W. Wang, X. Chen, D. Ni, D. Zhang and X. Wu, J. Alloys Compd., 2005, 402, 224–226 CrossRef CAS PubMed.
| This journal is © The Royal Society of Chemistry 2015 |