Toward highly efficient CdS/CdSe quantum dot-sensitized solar cells incorporating a fullerene hybrid-nanostructure counter electrode on transparent conductive substrates†
Quanxin Zhang,
Shengju Zhou,
Qian Li and
Hongguang Li*
Laboratory of Clean Energy Chemistry and Materials, Lanzhou Institute of Chemical Physics, Chinese Academy of Sciences, Lanzhou 730000, China. E-mail: hgli@licp.cas.cn; Fax: +86-931-4968163; Tel: +86-931-4968829
First published on 26th March 2015
Abstract
At present, the performance of quantum dot-sensitized solar cells (QDSCs) is still much lower than that of conventional dye-sensitized solar cells. Besides efforts on the development of photoanodes, a new generation of materials for counter electrodes is also urgently needed to optimize the structure of QDSCs and improve their power conversion efficiency (PCE). Here, fullerene (C60) films on transparent conductive substrates have been prepared through a cost-effective doctor blade process, which were subsequently applied as counter electrodes in QDSCs. Compared to conventional counter electrodes composed of Pt or activated carbon (AC) electrodes, the C60-based counter electrodes exhibit better electrocatalytic activity, lower charge-transfer resistance and higher exchange current density. Based on these merits, the QDSC with C60-based counter electrode and a polysulfide electrolyte shows an improved PCE of 4.18% under simulated 100 mW cm−2 AM 1.5 illumination. In contrast, the PCEs of the QDSC using Pt or activated carbon as counter electrode under the same conditions are only 1.17% and 3.48%, respectively. Stability test reveals that the C60-based counter electrode has good stability at room temperature.
1. Introduction
Quantum dot-sensitized solar cells (QDSCs) represent a type of next-generation solar cells and have attracted much attention because of their low cost, easy fabrication and high theoretical power conversion efficiency (PCE).1–6 The unique characteristics of quantum dots (QDs) over traditional dyes, such as Ru–polypyridine complexes and organic dyes, are their strong photo-response in the visible region, tunable band gaps simply by controlling their sizes and components. Moreover, the utilization of multiple exciton generation of QDs is expected to obtain much higher PCEs.7–10 However, up to now, the performance of reported QDSCs is still much lower than conventional dye-sensitized solar cells (DSCs).11–13 Thus, the development of new generation electrode materials is urgently needed to further improve the PCE of QDSCs.The counter electrode is an important component in QDSCs, which collects electrons from the external circuit and reduces the redox shuttles in the electrolyte. In DSCs, Pt is commonly used as counter electrode. However, it is proven to be unsuitable toward polysulfide (S2−/S22−), which is a popular electrolyte in QDSCs,14 due to strong interaction between Pt and sulfide ions that remarkably influences the conductivity and catalytic activity of the electrode.15–17 Alternatively, various carbon materials with good corrosion inertness toward polysulfide redox couple and larger specific surface area with porous structure, have been applied in QDSCs.18–21 Meng et al. introduced activated carbon into QDSC as counter electrode and demonstrated that activated carbon exhibits better catalytic property against Pt toward polysulfide electrolyte.22 Fan et al. explored CdSe QDSC based on hierarchical nanostructured spherical carbon electrode with hollow core/mesoporous shell, showing 3.90% efficiency.23 Poly(3,4-ethylenedioxythiophene) electrode (PEDOT) was prepared by electropolymerization used in CdS QDSC with a PCE of 1.56%.24 Although these pioneering works exhibited considerable improvement in the photovoltaic performance of QDSCs, some issues, i.e. large internal resistance, relatively poor stability and complicated fabrication process, are still unsolved. Therefore, further investigation of counter electrodes with high catalytic activity and satisfactory stability is desirable.
Recently, fullerene (C60) and its derivatives, rising stars in the carbon family, have been employed in photoanodes of QDs solar cells due to their excellent electron accepting ability and suitable conduction band level position.25–27 However, few works have been reported to investigate DSCs or QDSCs with fullerene counter electrodes systematically.28,29 Kuramoto et al. reported that C60 and the derivatives was prepared on transparent conductive substrate by spin-coating method and applied in DSCs. The efficiency is far unsatisfactory.28 Wu et al. employed Pt/C60 counter electrode in QDSCs with a PCE of 2%, in which authors focused on the fabrication process of photoanode with less counter-electrode characterization.29 Herein, we prepared C60 films on transparent conductive substrates via a cost-effective doctor blade process, which were then utilized as counter electrodes in QDSCs. Further research demonstrates that the C60-based counter electrode has hybrid nanostructure with relatively high surface area and large inner pores, which facilitates electrolyte infiltration and electron transportation. Compared to the counter electrodes based on Pt and activated carbon, the C60-based counter electrode exhibits better electrocatalytic activity, lower charge-transfer resistance, and higher exchange current density, which finally leads to an improved PCE of 4.18% with a polysulfide electrolyte under simulated 100 mW cm−2 AM 1.5 illumination. In addition, stability test reveals that our cell can be stable for more than 14 days at room temperature.
2. Experimental section
2.1 Chemicals and materials
Sodium nitrilotriacetate (N(CH2COONa)3, AR) and selenium powders were purchased from Aldrich. NH4Cl, Na2SO3, CdCl2, thiourea, ammonia, sulfur, titanium isopropoxide were obtained from Sinopharm Chemical Reagent Co. Ltd. Ethyl cellulose (EC), terpineol, P25, 200 nm-sized anatase TiO2 nanoparticles were from Wuhan Jingge Solar Co. Ltd. Fullerene C60 and activated carbon were supplied by Suzhou Dade Carbon Nanotechnology Co. Ltd. and Cabot Corporation, respectively. Other chemicals including Na2S, CdSO4 and Zn(CH3COO)2 were from local suppliers with the highest purities. All the chemicals were used without further purification. Solutions for electrolyte and QDs deposition were prepared using high-purity water obtained from a water purification system (Ulupure Instrument Co. Ltd). The electrode substrate was fluorine-doped tin oxide conducting glass (FTO, thickness: 2.2 mm, Nippon, sheet resistance 14 Ω per square).2.2 Preparation of TiO2 film
Two kinds of TiO2 pastes used for doctor blade were prepared by using P25 and 200 nm TiO2 particles, respectively.30 A 7 μm-thick transparent TiO2 layer was first printed on FTO glass using P25 paste, which was further coated by a 5 μm-thick scattering layer with 200 nm TiO2 paste (see Fig. S1a†). After leveled for 15 min, the samples were heated at 80 °C for 30 min and then sintered at 450 °C for 30 min. Finally, the samples were further treated in 40 mM TiCl4 solution, rinsed with water, dried under air flow, and heated to 500 °C in air for 30 min.2.3 Deposition of QDs onto TiO2 films
Chemical bath deposition (CBD) was employed to successively assemble CdS and CdSe onto TiO2 films.31 The deposition was performed at 10 °C. CdS was in situ grown for about 50 min in an aqueous solution containing 20 mM CdCl2, 66 mM NH4Cl, 140 mM thiourea and 230 mM ammonia. After thoroughly washed with deionized water, CdSe was deposited by mixing an aqueous solution of 26 mM CdSO4, 40 mM N(CH2COONa)3 and 26 mM Na2SeSO3 for 4.5 h. Finally, CdS/CdSe co-sensitized photoanodes were passivated with ZnS by alternately dipping into 100 mM Zn(CH3COO)2 and Na2S aqueous solution. The passivation was repeated twice and the duration for each dipping is 1 min.2.4 Formation of counter electrodes
C60 paste was obtained by dispersing C60 powders in terpineol with EC and titanium isopropoxide as binders.32 After ball milling at 450 rpm for 5 h, the mixture was transferred onto FTO glass with doctor blade method, followed by sintering at 400 °C for 20 min. Activated carbon (AC) electrode was fabricated by the same procedures. The average thickness of the two kinds of carbon films was about 10 μm, as shown in Fig. S1.† Pt electrode was prepared by thermal decomposition of H2PtCl6 (30 mM in isopropanol) on FTO glass at 385 °C for 30 min.332.5 Characterizations
Scanning electron microscopy (SEM) observations were carried out on a JSM-6700F. N2 adsorption–desorption was performed on ASAP 2020 HD88. Typical Brunauer–Emmett–Teller (BET) analysis was used to determine the average pore size of as-prepared films. The absorption and desorption data were analyzed with the BJH (Barrett, Joyner and Hanlenda) method for incremental pore volume distribution. The transmittance spectra of TiO2 films with different CdSe deposition time were recorded by a UV-vis spectrophotometer (Shanghai Puyuan Instrument Co. Ltd.). Photocurrent density–photovoltage (J–V) measurements were carried out using a solar cell with an active area of 0.20 cm2. The polysulfide electrolyte was sandwiched between the QDs-coated TiO2 film and the counter electrode, which was separated by using a silicone spacer (thickness: 25 μm). The electrolyte contained 1 M Na2S and 1 M S with a mixture solution of methanol and water (3/7, v/v). The cells were measured by a source meter (Keithley 2400) under an illumination of a solar simulator (SS150A, Zolix Instrument Co. Ltd.) under AM 1.5 illumination of 100 mW cm−2. The incident-photon-to-current conversion efficiency (IPCE) was measured by DC method using an IPCE system (Solar Cell Scan 100, Zolix Instrument Co. Ltd.) without bias illumination.Cyclic voltammogram (CV) was carried out by using a Pt wire as auxiliary electrode, a SCE electrode as reference electrode, and the FTO-supported C60 film, AC or Pt as working electrode with a total exposure area of 1 cm2 in a mixture of methanol and water (3/7, v/v) containing 1 M Na2S2. Scan rates from 10 to 40 mV s−1 were used and the data were acquired with a CHI 600E electrochemical workstation. Electrochemical impedance spectra (EIS) and Tafel curve measurements were conducted in a symmetrical cell fabricated with two identical counter electrodes using a CHI 600E electrochemical analyzer in dark. The measured frequency for EIS ranged from 100 mHz to 100 kHz and the amplitude was set to 10 mV. The results were fitted by Zview software.
3. Results and discussion
The morphology of a typical C60 film is shown in Fig. 1. As can be seen, the film has hybrid nanostructure of granular precipitates composing continuous layers. The grain size is in the range of 20 to 100 nm, and mesopores are uniformly distributed in the layers. The granular precipitate comes from hydrolysis of titanium isopropoxide, which improves the interconnections between C60 layers as well as between C60 film and FTO. The mesopores are probably associated with EC sintering. Such hybrid porous structure with high surface area is supposed to favor electron transportation.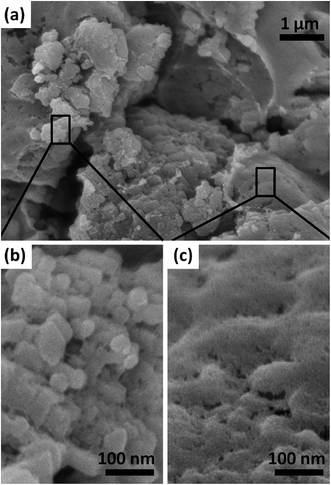 | ||
| Fig. 1 SEM image of a typical C60 film (a), (b) and (c) are amplification parts of the selected areas in image a. | ||
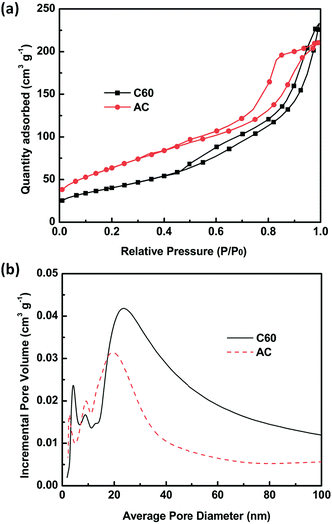
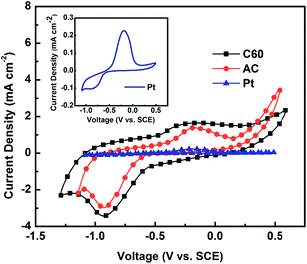
The mesoporous nature of the C60 film was further confirmed by N2 adsorption–desorption. For comparison, result of a typical activated carbon film is also given. As seen from Fig. 2a, C60 film represents type IV isotherm, and its mesoporous nature can be judged by the hysteresis loop in the medium pressure range between 0.5 and 0.8.34 The high pressure part of the hysteresis loop (0.9 < P/P0 < 1.0) is supposed to originate from textual larger pores formed between C60 layers. In comparison with AC film, C60 film has a larger average pore size and a higher volume of pores. This leads to a smaller surface area of C60 film (146 m2 g−1) compared to that of activated carbon film (234 m2 g−1). Despite the smaller surface area, the C60 film exhibits a better electrochemical response in S2−/S22− system using a Pt wire as auxiliary electrode and a SCE electrode as reference electrode, respectively. As seen from Fig. 3, one pair of redox peaks (2S2− ↔ S22− + 2e−) has been clearly detected for both electrodes based on C60 and activated carbon. It is known that the catalytic ability of counter electrodes toward S22− reduction in QDSCs can be evaluated by the intensity of the reduction peak.35 From Fig. 3 it is obviously seen that the peak intensity of C60-based electrode is higher than that of activated carbon-based one, indicating a higher electrochemical activity of C60-based electrode. In contrast, under the same condition the response of Pt electrode is too weak to be recognized.
Fig. 4 presents a set of CV curves of C60-based electrode versus the scan rate. It is clearly seen that the intensity of the reduction peak increases and the position of the reduction peak shifts toward lower voltage with increasing scan rate from 10 to 40 mV s−1. A linear relationship between the peak intensity and the square root of scan rate is found (inset of Fig. 4), indicating the redox reaction on the C60-based electrode is diffusion-controlled.36 The diffusion process is probably assigned to the transport of S2− out of the C60 film after the S22− reduction. The relatively larger pore size and higher volume of pores towards C60 electrode is benefit for the wetting of the electrode surface and the charge transportation between the electrode and the electrolyte.
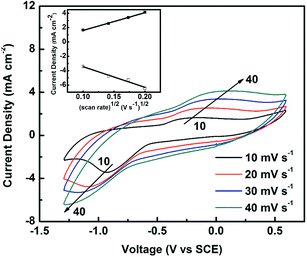 | ||
| Fig. 4 Cyclic voltammograms of the C60-based electrode under various scan rates. Inset shows the linear relationship of the peak intensity and the square root of the scan rate. | ||
In QDSCs, CBD is facile and straightforward and is thus one of the most popular methods to fabricate QD-sensitized photoanode. In order to find the optimized photoanode which is most suitable to match the C60 counter electrode, we adjusted the CdSe deposition time from 3.5 to 6.5 h. From the UV-visible transmittance of the CdS/CdSe-coated TiO2 electrodes at different CdSe deposition time (Fig. S2†), it is clearly seen that with increasing deposition time the transmittance edge gradually shifts to longer wavelengths, indicating that the size of QDs increases at prolonged deposition time. After assembling the photoanodes with C60 counter electrodes to form QDSCs, on the best photovoltaic performance was obtained at a CdSe deposition time of 4.5 h (Table S1†). The same trend was noticed for the QDSCs with activated carbon counter electrodes. Therefore, photoanodes obtained at 4.5 h CdSe deposition time are selected for further investigation.
Fig. 5a shows the IPCE results of the QDSCs with different counter electrodes. The IPCE values increase successively for QDSCs with Pt-, AC- and C60-based counter electrodes, and the values at 550 nm are 68%, 76% and 83%, respectively. Fig. 5b gives corresponding J–V curves of the three QDSCs and the derived photovoltaic parameters are summarized in Table 1, in which the trend of the results towards the three counter electrodes is repeatable and the same as those in Table S1.† The cell with C60-based counter electrode exhibits the highest photovoltaic performance a short-circuit photocurrent (JSC) of 12.6 mA cm−2, an open-circuit photovoltage (VOC) of 546 mV and a fill factor (FF) of 0.60. This yields a PCE (η) of 4.18%, which is better than that of the cell with activated carbon-based counter electrode (η = 3.48%) and comparable to those of reported highly efficient QDSCs using metal sulfide as counter electrodes.37,38 Meanwhile, the performance of the cell with Pt-based counter electrode is much worse (Table 1), which is consistent with the CV and IPCE measurements.
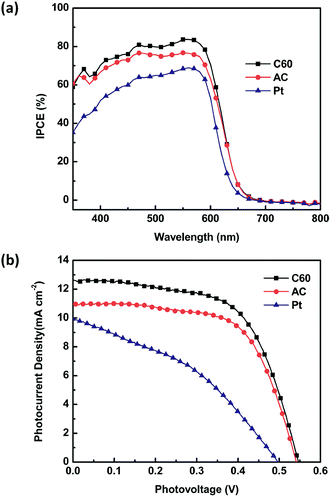 | ||
| Fig. 5 IPCE spectra (a) and J–V characteristics (b) of CdS/CdSe co-sensitized QDSCs with different counter electrodes. CdSe deposition time is 4.5 h. | ||
| Counter electrode | JSC (mA cm−2) | VOC (mV) | FF | η (%) |
|---|---|---|---|---|
| C60 | 12.6 | 546 | 0.60 | 4.18 |
| AC | 10.9 | 542 | 0.57 | 3.48 |
| Pt | 9.93 | 496 | 0.38 | 1.89 |
It is known that the performance of solar cell, especially the FF, is significantly influenced by its internal resistance.39,40 Thus, EIS measurement in a symmetrical cell was carried out to evaluate the electrochemical properties of different counter electrodes on the cell performance. The schematic structure of the symmetric thin-layer cell is shown in Fig. 6a. Fig. 6b presents typical Nyquist plots of the cells with different electrodes. Experimental curves are illustrated by symbols while the solid lines correspond to the fitted curves obtained with Zview software by using the equivalent circuit shown in the above inset of Fig. 6b. Two semicircles are obviously observed. The small one at high frequency represents the charge transfer resistance (RCT1) and interfacial capacitance (C) at the solid–solid interfaces, while the large one reflects the charge-transfer resistance (RCT2) and constant phase element (CPE) at the counter electrode/electrolyte interface in the mid/low frequency range.41 Similar to the reported EIS results, no obvious response can be found toward the diffusion impedance of the redox species in the electrolyte, which is assigned to short circuit in the QDSC system.42,43 In the high frequency (over 105 Hz) where the phase is zero, the ohmic series resistance (RS) of the FTO layer, the electrode layer and the electrolyte can be determined. The fitting data using the equivalent circuit were shown in Table S2.†
RCT1 values for the three electrodes are all as low as about 2 Ω, indicating the well interconnection between the FTO glass and the films. The RCT2 values are 84.0, 106, 338 Ω for C60-, AC- and Pt-based electrodes, respectively. C60-based electrode shows smaller RCT2 value than that of AC-based one, which is mainly because the intrinsic excellent electron conductivity toward C60 and the hybrid nanostructure of C60 film which facilitates electron transport and reduction of charge-transfer resistance.25–27 Meanwhile, the large RCT2 value of Pt-based electrode demonstrates its poor catalytic activity in polysulfide electrolyte, resulting in a low FF and η in corresponding QDSC. The RS data also reveal that the conductivity of the Pt film is distinctly influenced by the strong interaction between sulfides (S2−, S22− ions) and the surface of the Pt-based electrode. Our results again demonstrate that carbon materials are superior to Pt because of its good corrosion inertness toward polysulfide electrolyte.19
To further understand the electrocatalytic activity of the different counter electrodes, Tafel curve analysis was carried out in the same symmetric cells, as seen in Fig. 6c. The C60-based electrode shows higher exchange current density (J0 = RT/nFRCT) toward the polysulfide redox species reduction than AC- and Pt-based electrodes.22,44 The C60-based electrode has the best electrocatalytic activity characterized by the highest J0 and the lowest RCT, in well accordance with the CV and EIS results.
Besides PCE, another important aspect of QDSCs is their long-term stability. When a symmetric cell with C60-based counter electrode and CdS/CdSe coated photoanode was stored at room temperature in the dark, no obvious decrease of both η and FF could be observed over 14 days (Fig. 7), revealing the good stability of the cell. This is crucial when put these cells in practical applications. Upon further optimizing the nanostructure of the C60 film in the counter electrode as well as the QDs-sensitized TiO2 photoanode, the performance of the QDSCs could be further improved. Efforts towards this direction is currently underway in our lab and will be reported in near future.
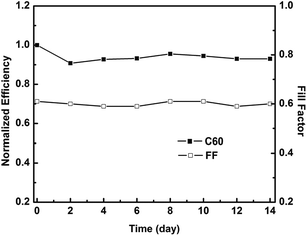 | ||
| Fig. 7 Normalized PCE and FF of QDSCs fabricated with C60 counter electrode versus conservation time. | ||
4. Conclusions
In summary, electrodes based on fullerene C60 have been successfully prepared through a simple doctor blade process. The C60-based electrodes have relatively high surface area, large inner pores and hybrid nanostructure, which facilitate electrolyte infiltration and electron transportation. Compared to Pt- and traditional activated carbon-based electrodes, C60 electrodes exhibit better electrocatalytic activity, lower charge-transfer resistance, and higher exchange current density. When assembled into QDSCs together with QDs-sensitized photoanodes and polysulfide electrolyte, the cells show good performance with η up to 4.18%, outperforming the identical cells with Pt- (1.17%) and activated carbon-based electrodes (3.48%). Preliminary stability test shows that the cell can be stable for more than 14 days at room temperature in the dark, indicating that the C60-based electrodes are stable with polysulfide electrolyte. Our research may pave the way for optimizing the performance of QDSCs by development of nanocarbon-based counter electrodes.Acknowledgements
This work was financially supported by the Hundred Talents Program of Chinese Academy of Sciences (Y20245YBR1) and National Natural Science Foundation of China (no. 21402215, no. 61474124).References
- J.-H. Bang and P. V. Kamat, ACS Nano, 2009, 3, 1467–1476 CrossRef CAS PubMed.
- Y.-L. Lee and Y.-S. Lo, Adv. Funct. Mater., 2009, 19, 604–609 CrossRef.
- S. Giménez, I. Mora-Seró, L. Macor, N. Guijarro, T. Lana-Villarreal, R. Gómez, L. J. Diguna, Q. Shen, T. Toyoda and J. Bisquert, Nanotechnology, 2009, 20, 295204 CrossRef PubMed.
- Q. X. Zhang, X. Z. Guo, X. M. Huang, S. Q. Huang, D. M. Li, Y. H. Luo, Q. Shen, T. Toyoda and Q. B. Meng, Phys. Chem. Chem. Phys., 2011, 13, 4659–4667 RSC.
- Z. S. Yang, C. Y. Chen, C. W. Liu and H. T. Chang, Chem. Commun., 2010, 46, 5485–5487 RSC.
- Z. Tachan, M. Shalom, I. Hod, S. Rühle, S. Tirosh and A. Zaban, J. Phys. Chem. C, 2011, 115, 6162–6166 CAS.
- C. Shen, L. D. Sun, Z. Y. Koh and Q. Wang, J. Mater. Chem. A, 2014, 2, 2807–2813 CAS.
- K. Zhao, H. J. Yu, H. Zhang and X. H. Zhong, J. Phys. Chem. C, 2014, 118, 5683–5690 CAS.
- H. N. Chen, L. Q. Zhu, H. C. Liu and W. P. Li, J. Phys. Chem. C, 2013, 117, 3739–3746 CAS.
- L. L. Li, P. N. Zhu, S. J. Peng, M. Srinivasan, Q. Y. Yan, A. S. Nair, B. Liu and S. Samakrishna, J. Phys. Chem. C, 2014, 118, 16526–16535 CAS.
- I. Mora-Seró, S. Giménez, F. Fabregat-Santiago, R. Gómez, Q. Shen, T. Toyoda and J. Bisquert, Acc. Chem. Res., 2009, 42, 1848–1857 CrossRef PubMed.
- C. Ratanatawanate, C. Xiong and K. J. Balkus Jr, ACS Nano, 2008, 2, 1682–1688 CrossRef CAS PubMed.
- H. Chen, L. Zhu, H. Liu and W. Li, J. Power Sources, 2014, 245, 406–410 CrossRef CAS PubMed.
- X. W. Zeng, W. J. Zhang, Y. Xie, D. H. Xiong, W. Chen, X. B. Xu, M. K. Wang and Y. B. Cheng, J. Power Sources, 2013, 226, 359–362 CrossRef CAS PubMed.
- G. Zhu, L. K. Pan, H. C. Sun, X. J. Liu, T. Lv, T. Lu, J. Yang and Z. Sun, ChemPhysChem, 2012, 13, 769–773 CrossRef CAS PubMed.
- X. L. Zhang, X. M. Huang, Y. Y. Yang, S. Wang, Y. Gong, Y. H. Luo, D. M. Li and Q. B. Meng, ACS Appl. Mater. Interfaces, 2013, 5, 5954–5960 CAS.
- S. Peng, L. Tian, J. Liang, S. G. Mhaisalkar and S. Ramakrishna, ACS Appl. Mater. Interfaces, 2012, 4, 397–404 CAS.
- P. K. Santra and P. V. Kamat, J. Am. Chem. Soc., 2012, 134, 2508–2511 CrossRef CAS PubMed.
- G. Hodes, J. Manassen and D. Cahen, J. Electrochem. Soc., 1980, 127, 544–549 CrossRef CAS PubMed.
- D. Cahen, G. Dagan, Y. Mirovsky, G. Hodes, W. Giriat and M. Lubke, J. Electrochem. Soc., 1985, 132, 1062–1070 CrossRef CAS PubMed.
- Y. Mirovsky, R. Tenne, D. Cahen, G. Sawatzky and M. Polak, J. Electrochem. Soc., 1985, 132, 1070–1076 CrossRef CAS PubMed.
- Q. Zhang, Y. Zhang, S. Huang, X. Huang, Y. Luo, Q. Meng and D. Li, Electrochem. Commun., 2010, 12, 327–330 CrossRef CAS PubMed.
- S. Q. Fan, B. Fang, J. H. Kim, J. J. Kim, J. S. Yu and J. Ko, Appl. Phys. Lett., 2010, 96, 063501 CrossRef PubMed.
- T. Shu and Z. L. Ku, J. Alloys Compd., 2014, 586, 257–260 CrossRef CAS PubMed.
- J. H. Bang and P. V. Kamat, ACS Nano, 2011, 5, 9421–9427 CrossRef CAS PubMed.
- S. Sarkar, B. Rajbanshi and P. Sarkar, J. Appl. Phys., 2014, 116, 114303 CrossRef PubMed.
- P. Brown and P. V. Kamat, J. Am. Chem. Soc., 2008, 130, 8890–8891 CrossRef CAS PubMed.
- N. Kuramoto, T. Hino and Y. Ogawa, Carbon, 2006, 44, 880–887 CrossRef PubMed.
- G. T. Yue, J. H. Wu, Y. M. Xiao, J. M. Lin, M. L. Huang, L. Q. Fan and Z. Lan, Sci. China: Chem., 2013, 56, 93–100 CrossRef CAS PubMed.
- S. Ito, P. Chen, P. Comte, M. K. Nazeeruddin, P. Liska, P. Péchy and M. Grätzel, Progress in Photovoltaics: Research and Applications, 2007, 15, 603–612 CrossRef CAS.
- O. Niitsoo, S. K. Sarkar, C. Pejoux, S. Rühle, D. Cahen and G. Hodes, J. Photochem. Photobiol., A, 2006, 181, 306–313 CrossRef CAS PubMed.
- Z. Huang, X. Liu, K. Li, D. Li, Y. Luo, H. Li, W. Song, L. Chen and Q. Meng, Electrochem. Commun., 2007, 9, 596–598 CrossRef CAS PubMed.
- G. Q. Wang, R. F. Lin, Y. Lin, X. P. Li, X. W. Zhou and X. R. Xiao, Electrochim. Acta, 2005, 50, 5546–5552 CrossRef CAS PubMed.
- M. Kruk and M. Jaroniec, Chem. Mater., 2001, 13, 3169–3183 CrossRef CAS.
- M. D. Ye, C. Chen, N. Zhang, X. R. Wen, W. X. Guo and C. J. Lin, Adv. Energy Mater., 2014, 4, 1301564 Search PubMed.
- H. Sun, Y. Luo, Y. Zhang, D. Li, Z. Yu, K. Li and Q. Meng, J. Phys. Chem. C, 2010, 114, 11673–11679 CAS.
- H. J. Kim, S. W. Kim, C. Gopi, S. K. Kim, S. S. Rao and M. S. Jeong, J. Power Sources, 2014, 268, 163–170 CrossRef CAS PubMed.
- F. F. Wang, H. Dong, J. L. Pan, J. J. Li, Q. Li and D. S. Xu, J. Phys. Chem. C, 2014, 118, 19589–19598 CAS.
- N. Papageorgiou, Coord. Chem. Rev., 2004, 248, 1421–1446 CrossRef CAS PubMed.
- A. Hauch and A. Georg, Electrochim. Acta, 2001, 46, 3457–3466 CrossRef CAS.
- Y. Yang, L. Zhu, H. Sun, X. Huang, Y. Luo, D. Li and Q. Meng, ACS Appl. Mater. Interfaces, 2012, 4, 6162–6168 CAS.
- V. González-Pedro, X. Q. Xu, I. Mora-Seró and J. Bisquert, ACS Nano, 2010, 4, 5783–5790 CrossRef PubMed.
- Q. Zhang, G. Chen, Y. Yang, X. Shen, Y. Zhang, C. Li, R. Yu, Y. Luo, D. Li and Q. Meng, Phys. Chem. Chem. Phys., 2012, 14, 6479–6486 RSC.
- J. Dong, S. Jia, J. Chen, B. Li, J. Zheng, J. Zhao, Z. Wang and Z. Zhu, J. Mater. Chem., 2012, 22, 9745–9750 RSC.
Footnote |
| † Electronic supplementary information (ESI) available: SEM images of TiO2, C60 and activated carbon films on FTO, transmittance of photoanodes, photovoltaic performances of the QDSCs with varying CdSe deposition time, EIS fitting data and BET analysis. See DOI: 10.1039/c5ra02091c |
| This journal is © The Royal Society of Chemistry 2015 |

