Adsorption of hexavalent chromium by polyacrylonitrile (PAN)-based activated carbon fibers from aqueous solution
Zhengjiang Jiangab,
Yunguo Liu*ab,
Guangming Zengab,
Weihua Xuab,
Bohong Zhengc,
Xiaofei Tanab and
Shufan Wangab
aCollege of Environmental Science and Engineering, Hunan University, Changsha 410082, P.R. China. E-mail: jzhjsex@hnu.edu.cn; Fax: +86 731 88822829; Tel: +86 731 88649208
bKey Laboratory of Environmental Biology and Pollution Control (Hunan University), Ministry of Education, Changsha 410082, P.R. China
cSchool of Architecture and Art Central South University, Central South University, Changsha 410082, P.R. China
First published on 5th March 2015
Abstract
Polyacrylonitrile (PAN)-based activated carbon fibers (PAC400 and PAC600) were prepared by heating Zn(NO3)2 pretreated-PAN at 400 °C and 600 °C for the removal of Cr(VI) from aqueous solution. Formation of PAC400 and PAC600 was confirmed by FTIR and XPS. Field Emission Scanning Electron Microscopy (FESEM) imaging of PAC400 and PAC600 revealed the formation of nearly spherical agglomerated particles. The conditions for adsorption of Cr(VI) onto PAC400 and PAC600 had been optimized and kinetics and isotherm studies were performed. Although the adsorption took place in the range of pH (2–6), pH 3 was found to be most suitable. The adsorption data fitted well with the pseudo-second-order rate model and Langmuir isotherm model. PAC600 showed much greater ability in the adsorption of Cr(VI) than PAC400, and Qmax were calculated to be 187.79 mg g−1 and 136.87 mg g−1 based on the Langmuir model, respectively. Desorption experiments showed PAC600 and PAC400 can be regenerated and reused. The adsorption process for the removal of Cr(VI) was governed by the ionic interaction between protonated amine groups of PAC and HCrO4− ions.
1. Introduction
There has been increasing attention on chromium contamination in the environment in recent decades. As a major pollutant in surface water and groundwater, Cr is released to the environment by industrial activities including plating, chromate manufacturing, leather tanning and wood preservation.1–3 Industrialists have now been looking for effective measures to comply with the stringent contaminant limits set by the World Health Organization (WHO).4In natural water, chromium is present as both Cr(III) and Cr(VI). Cr(III) is an essential micronutrient that helps the body in metabolizing sugar, protein and fat (requirement is 50–200 μg per day).5 However, Cr(VI) occurs naturally and is the main pollutant compound due to its high water solubility and mobility. Cr(VI) is of significant environmental concern due to its carcinogenic, mutagenic and teratogenic effects on biological system.6,7 So, it is important to control chromium in potable water and discharge into inland surface water.8
Recently, activated carbon is widely used as contaminant removal media to tackle Cr(VI) in water pollution problems9 considering its simplicity, cheap, easy to scale-up and ability to remove low concentration contaminants. The adsorption of heavy metals by activated carbon greatly relies upon its physical properties such as specific surface area and pore size distribution and surface chemistry.10 The surface chemistry of activated carbon can be changed by treating it with an oxidizing agent either in gas phase,11 in aqueous solution10 or through impregnating foreign materials such as surfactants,12 PAN (polyacrylonitrile) is common and inexpensive commercial product and has been applied for the production of nanofibers via electro spinning.13 Using PAN as adsorbent is a highly efficient material for the removal and recovery of metal ions due to the high adsorption capacity, fast adsorption equilibrium, high recycling rate, and low cost.14 Moreover, PAN has desirable chemical resistance, thermal stability, low flammability, and good mechanical properties.15–18
PAN-based activated carbon fiber has high carbon content,19,20 high molecular weight21,22 and also high degree of molecular orientations.22–24 Recently, PAN-based activated carbon fiber has been receiving increasing attention as adsorbent for gas adsorption and water treatment25,26 due to its high adsorption performance as compared to other counterparts. Many studies have kept a watchful eye on the preparation of PAN-based activated carbon from its raw precursor, where the values of specific surface area varying from 500 to 900 m2 g−1.27–29 However, there is little concerning about the use of PAN-based activated carbon to remediate metal contaminated wastewater in the most of published literature.
In the present work, polyacrylonitrile (PAN)-based activated carbon fiber (PAC400 and PAC600) was prepared by heating Zn(NO3)2 pretreated-PAN at 400 °C and 600 °C and their metal binding ability was evaluated. The effect of several parameters, such as pH, contact time, dose of adsorbent and initial concentration of Cr(VI) were tested in batch mode. PAC400 and PAC600 were also characterized by FESEM, ATR-FTIR and XPS. In addition, PAC400 and PAC600 were examined to understand the mechanism of the adsorption process.
2. Materials and methods
2.1. Preparation for materials
Polyacrylonitrile, a commercial product, was provided by Tianjin Heowns Biochem LLC. The other chemicals used in the study were of reagent grade.10 g of PAN was added to a 250 mL beaker with 100 mL of water solution containing 1 mol L−1 Zn(NO3)2. The mixture was stirred in a shaking water bath at 40 °C for 24 h. The mixture was dried to constant weight in an oven at 70 °C. The mixture was divided into two portions. Then, the mixture fed into a lab-scale tubular reactor within a muffle furnace. The chamber of tube furnace was sealed and replenished with nitrogen gas (400 mL min−1) to keep the inert atmosphere along with the heating process. The furnace temperature was programmed to increase to 400 °C and 600 °C within one hour, and held at the peak temperature for 1 h. The resulted activated carbon deriving from polyacrylonitrile was permitted to cool at room temperature under a flow of nitrogen gas, which was referred as PAC400 and PAC600, respectively. Then, it was washed with ultrapure water, and dried in an oven at 65 °C. 5 g of PAN was added to a 250 mL beaker with 100 mL of water. There are AC400 and AC600 without adding Zn according to the same way as above.
2.2. Characterization methods
The Brunner Emmett Teller (BET) surface areas were determined by N2 adsorption–desorption isotherm. The morphology of polyacrylonitrile (PAN)-based activated carbon was characterized by field-emission scanning electron microscopy (FESEM, JSM 6700F, Japan). FTIR measurements were performed using a Fourier Transform Infrared Spectrometer (IRAffinity-1, Shimadzu) with KBr as background over the range of 4000–400 cm−1. The elements of PAC400 and PAC600 were determined by an ESCALAB 250Xi X-ray Photoelectron spectrometer (XPS) (Thermo Fisher, USA). Binding energies (BEs) of the spectra were performed with the C1s neutral carbon peak at 284.6 eV with accuracy of ±0.05 eV. The zeta potential of PAC400 and PAC600 were obtained using Electroacoustic Spectrometer by varying solution pH from 1.0 to 6.0.2.3. Adsorption and desorption experiments
The stock solution containing 1 g L−1 Cr(VI) was prepared by dissolving K2CrO4 in ultrapure water. The pH was adjusted by drop-wise addition of 1.0 mol L−1 HCl or 1.0 mol L−1 NaOH solution.Adsorption experiments were performed as follows: the influence of pH on Cr(VI) adsorption onto activated carbon was performed by varying solution pH from 1.0 to 6.0. 0.0500 g PAC400 and PAC600 were weighted into 150 mL conical flask which contained 50 mL of 200 mg L−1 Cr(VI) solution. Then conical flask was shaken at 150 rpm in a water shaker at room temperature for 24 h. The influence on the dosage of adsorbent was researched in the range of 0.02 g to 0.2 g by keeping Cr(VI) at 200 mg L−1 and pH at 3. Kinetic experiment was conducted at Cr(VI) 200 mg L−1 and pH at 3. After shaking, the solution samples were withdrawn at different time period. Equilibrium experiment was performed using different concentrations of Cr(VI) including 50 mg L−1, 80 mg L−1,100 mg L−1, 150 mg L−1, 200 mg L−1, 250 mg L−1, 300 mg L−1, 400 mg L−1, and pH at 3. PAC adsorption amount (qt) can be calculated as follows:30
 | (1) |
Desorption experiments were performed as follows: 0.05 g of PAC400 and PAC600 were added to 50 mL of 200 mg L−1 Cr(VI) solution with the same conditions of the adsorption experiments. When the adsorption equilibrium was reached, the PAC was taken out and rinsed with ultrapure water to remove residual solution trapped among the PAC. Then, the PAC loading with Cr(VI) was transferred to a flask with 50 mL of 1 mol L−1 NaOH solution to desorb the pre-adsorbed Cr(VI), and this step was repeated five times over. The data of adsorption and desorption were average value by three times parallel experiments.
3. Results and discussion
3.1. Characterization of polyacrylonitrile (PAN)-based activated carbon fiber
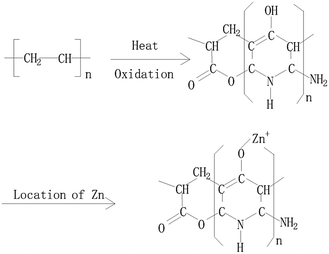
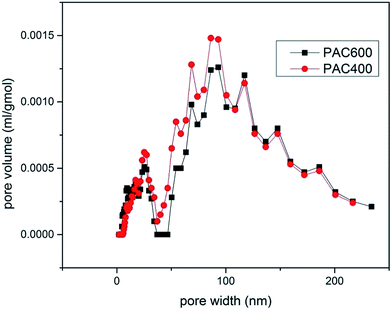
Characterization of PAC400 and PAC600 help to understand the properties that may affect the removal of metal ions. A lot of oxygen enter the mixture in the process of drying. The heat treatment process in the furnace which converted PAN fiber to carbon fiber, was the oxidation and stabilization. The oxidation of PAN is the first and important stage and form linear PAN. In the stabilization step, the linear PAN is converted to a cyclic structure. However, cyclization is very complicated process and there are different kinds of opinion on the reaction mechanisms. The most likely structure is to form ladder PAN chains structure which can withstand the high temperature processing.31–34 Zn was added to the PAC in the heating. The location of the hydrogen was probably displaced by Zn.27 This is because the position of hydrogen is lively, easy to be replaced. In addition, Zn mainly exists in the form of ZnO which can be proved by FTIR and XPS. So, the above explanations can be visualized in Fig. 1.35 PAC400 (surface area: 10.8036 m2 g−1) and PAC600 (surface area: 12.1801 m2 g−1) possessed a lower surface area. However, Fig. 2 showed the pore size distribution and the average pore radiuses were large by analyzing adsorption and desorption data points using the Brunner Emmett Teller (BET) measurements. This was probably because PAC400 and PAC600 contain considerable proportion of zinc oxide, which had small surface areas and abundant transitional pores.Surface morphology of PAC400 and PAC600 was studied using scanning electron microscopy (Fig. 3). Scanning electron microscopy (SEM), which had been a primary tool for characterizing the surface morphology and fundamental physical properties of the adsorbent's surface, was useful for determining the particle shape, porosity and appropriate size distribution of the adsorbent.36 It was clear that PAC400 and PAC600 had a considerable number of pores, where there was a good possibility for Cr(VI) to be trapped and adsorbed into these pores.
 | ||
Fig. 3 SEM images showing the surface morphologies of: (a) (PAC600, 50![[thin space (1/6-em)]](https://www.rsc.org/images/entities/char_2009.gif) 000×); (b) (PAC400, 50 000×); (b) (PAC400, 50![[thin space (1/6-em)]](https://www.rsc.org/images/entities/char_2009.gif) 000×); (c) (PAC600, 10 000×); (c) (PAC600, 10![[thin space (1/6-em)]](https://www.rsc.org/images/entities/char_2009.gif) 000×) (d) (PAC400, 10 000×) (d) (PAC400, 10![[thin space (1/6-em)]](https://www.rsc.org/images/entities/char_2009.gif) 000×). 000×). | ||
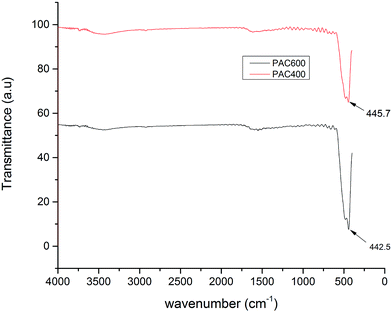
The chemical structures of the PAC400 and PAC600 were analyzed by using FTIR spectroscopy. Fig. 4 shows the FTIR spectrum of PAC400 and PAC600 in the frequency range (4000–0 cm−1). The FTIR spectra of Zn-loaded PAC revealed one distinct absorption band at around 464 cm−1.37 The position and number of these bands not only depend on crystal structure and chemical composition but also on particle morphology.29,38,39 Therefore, reference spectra of ZnO often shows among from 406 cm−1 to 512 cm−1.34 ZnO may be the cause of the high adsorption Cr(VI).
Fig. 5 shows C 1s, O 1s and Zn 1s XPS spectra of PAC400 and PAC600. The C 1s spectrum of PAC600 appeared at 283.8 eV, 284.7 eV, 285.6 eV and 288.7 eV, assigned to the forms of C–H/C–C,40 C–O,40 C–N,41 COO− (carboxyl and ester)42 (Fig. 5a). However, four different peaks centered on 284.5 eV, 284.6 eV, 286.3 eV and 288.4 eV were observed in Fig. 5b, corresponding to C–C, C–H, C–O and C![[double bond, length as m-dash]](https://www.rsc.org/images/entities/char_e001.gif) O.41 O 1s XPS spectra of the samples obtained in high resolution were presented in Fig. 5c and d. Three peaks were observed at similar binding energies: 529.5 eV, 529.9 eV and 531.4 eV (Fig. 5c), which could be ascribed to hydroxide, molecular water and zinc oxide, respectively.43 There were some subtle differences between PAC600 (Fig. 5c) and PAC400 (Fig. 5d) due to different calcination temperature. The Zn2p3/2 peak (PAC600 (Fig. 5e) and PAC400 (Fig. 5f)) at binding energy (BE) = 1021.3 ± 0.1 eV was attributed to zinc oxide.44,45 The Zn2p3/2 peak at higher binding energy, 1022.2 ± 0.1 eV could be attributed to zinc hydroxide in agreement with data available in the literature.45–47
O.41 O 1s XPS spectra of the samples obtained in high resolution were presented in Fig. 5c and d. Three peaks were observed at similar binding energies: 529.5 eV, 529.9 eV and 531.4 eV (Fig. 5c), which could be ascribed to hydroxide, molecular water and zinc oxide, respectively.43 There were some subtle differences between PAC600 (Fig. 5c) and PAC400 (Fig. 5d) due to different calcination temperature. The Zn2p3/2 peak (PAC600 (Fig. 5e) and PAC400 (Fig. 5f)) at binding energy (BE) = 1021.3 ± 0.1 eV was attributed to zinc oxide.44,45 The Zn2p3/2 peak at higher binding energy, 1022.2 ± 0.1 eV could be attributed to zinc hydroxide in agreement with data available in the literature.45–47
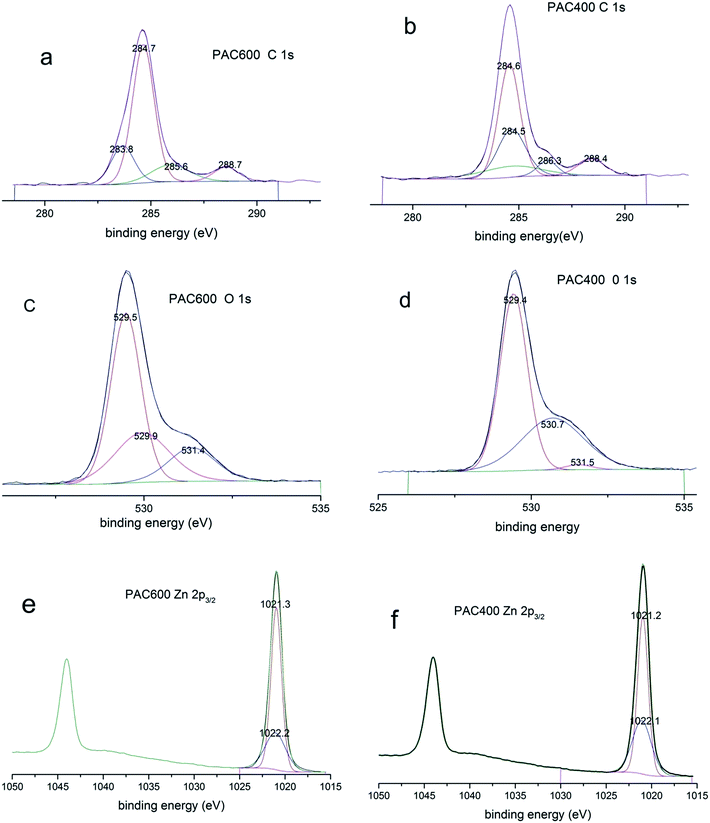 | ||
| Fig. 5 XPS spectra of PAC400 and PAC600: C 1s ((a) (PAC600), (b) (PAC400)); O 1s ((c) (PAC600), (d) (PAC400)), and Zn 2p3/2 ((e) (PAC600), (f) (PAC400)) core level spectra. | ||
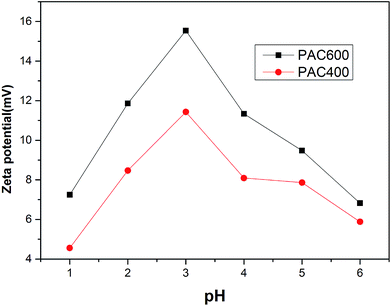
As shown in Fig. 6, zeta potential values of PAC400 and PAC600 in the chosen pH range are indicative of the highly positive charged surface. The presence of more positive charges in the structure of PAC400 and PAC600 significantly improves their ability to immobilize Cr(VI) ions, which may be caused by the edge surface charges of Zn–O groups. Due to their most positive charge, PAC400 and PAC600 may provide a favorable environment for adsorbing negative charged Cr(VI) ions through electrostatic interactions.
3.2. Effect of pH on Cr(VI) adsorption
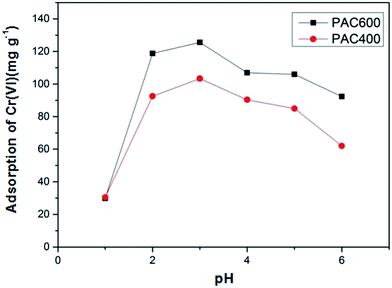
As shown in Fig. 7 that the pH significantly affected the Cr(VI) adsorption. And the effect on PAC600 was more pronounced than PAC400. The maximum removal of Cr(VI) was achieved at pH = 3. Precipitations of chromium occurred when pH was higher than 6. Therefore, absorption was not studied beyond pH of 6. The amount of Cr(VI) adsorption by PAC400 and PAC600 increased sharply when pH increased from 1.0 to 2.0. At pH 2.0–3.0, the amount of Cr(VI) adsorption increased slowly. However, decrease of adsorption of Cr(VI) was observed when pH increased from 3.0 to 6.0.Cr(VI) exists as salts of H2CrO4, HCrO4− and CrO42− depending on the pH and concentration of Cr(VI) in the solution. H2CrO4 predominates at pH less than about 1.0, HCrO4− at pH between 1.0 and 6.0, and CrO42− at pH above about 6.0.48 The adsorption of metal ions by PAC400 and PAC600 depended on solution pH, which is because pH influenced the adsorbent surface charge. When the pH value is low, adsorbent (PAC400 and PAC600) static charges was presented in positively charged form. However, more and more negative charge formed on the surface of the adsorbent with the increasing of pH. Therefore, the optimum sorption, that was to say pH was 3.0, the dominant species of Cr ion in solution was HCrO4−. The chromate anion interact strongly with the positive charged ions of the PAC400 and PAC600. So, The reason of the adsorption of Cr(VI) on the surface of PAC400 and PAC600 perhaps is the electrostatic interaction between the positive electric charge of Zn ions and the negative electric charge of HCrO4− ions, just as shown in Fig. 8. It was also found from Fig. 7 that higher pH, lower removal efficiency of PAC400 and PAC600. This may be due to the retarded interaction between adsorbent (PAC400 and PAC600) and Cr(VI) at higher pH.49
3.3. Adsorption kinetics
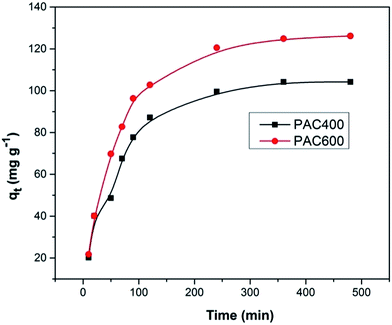
Fig. 9 presented the effect of contact time on Cr(VI) adsorption onto activated carbon. The data indicated that the rate of Cr(VI) adsorption was fast, with 90% of the ultimate adsorption occurring in the first 200 min, followed a very slow way to equilibrium. Generally, adsorption reached equilibrium within 24 h, so 24 h was used in all batch experiments. The initial rapid increase in amount of adsorption may be due to many vacant sites available at the initial time interval, as a result there was an increased concentration gradient of adsorbate between solution and adsorbent.50 Generally speaking, the initial adsorption in rapid, because this time the adsorption involved a surface reaction process. Then, a slower adsorption could be due to the gradual decrease of the available adsorption site.5Adsorption kinetic was modeled by the first-order, and the second-order, rate equation expressed as follows:
 | (2) |
 | (3) |
The rate constants and R2 values for the different kinetic models for the adsorption were showed in Table 1. The Fig. 10 showed that kinetic rate of Cr(VI) adsorption with PAC400 and PAC600 were described less by the pseudo-first-order equation (R2 = 0.972, 0.983) than by the pseudo-second-order equation (R2 = 0.986, 0.995). So, the adsorption kinetic is not diffusion controlled but chemisorptions.
| Adsorbents | Pseudo-first-order model | Pseudo-second-order model | ||||
|---|---|---|---|---|---|---|
| K1 (min−1) | qe (mg g−1) | R2 | K2 (g mg−1 min−1) | qe (mg g−1) | R2 | |
| PAC400 | 0.017 | 102.518 | 0.972 | 1.823 | 116.925 | 0.986 |
| PAC600 | 0.016 | 123.976 | 0.983 | 1.419 | 142.693 | 0.995 |
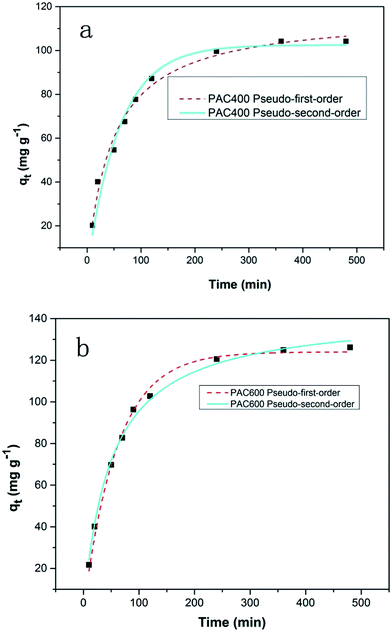 | ||
| Fig. 10 The pseudo-first-order equation and the pseudo-second-order equation plots for Cr(VI) adsorption by PAC400 (a) and PAC600 (b) at pH 3. | ||
3.4. Effect of adsorbent dose
The effect of the adsorbent dose on Cr(VI) adsorption was perform by varying the adsorbent dose PAC600 and PAC400. Fig. 11 showed that there were non-significant increase adsorption capacity of Cr(VI) when adsorbent dose was increased from 0.02 g to 0.05 g. But the removal efficiency for Cr(VI) was increased sharply when adsorbent dose was increased from 0.02 g to 0.05 g. These suggest that PAC400 and PAC600 reached maximum adsorption capacity, but there was still Cr(VI) in the solution. However, the lack of Cr(VI) in the solution and the excessive adsorbent dose make the amount of Cr(VI) adsorption decreased sharply with the increase of adsorbent dose. This is because the adsorbent is increased, but the Cr(VI) is constant, not reaching adsorption equilibria. So, the removal efficiency for Cr(VI) were slightly changed when adsorbent dose was increased from 0.10 g to 0.20 g.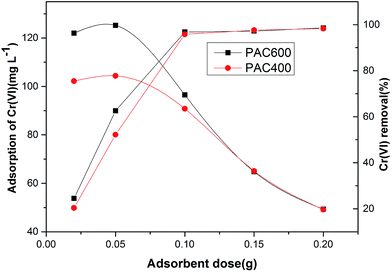 | ||
| Fig. 11 Effect of adsorbent dose on Cr(VI) adsorption at fixed Cr(VI) concentration (200 ppm) and Cr(VI) removal (%) pH 3.0, batch volume (25 mL), contact time (24 h, 120 rpm) at 25 °C. | ||
3.5. Adsorption isotherm
The adsorption isotherms of Cr(VI) were studied with Cr(VI) concentrations ranging from 50 mg L−1 to 400 mg L−1. Fig. 12 showed that the adsorption capacity of AC400 and AC600 are significantly lower than PAC400 and PAC600. Even, the adsorption capacity of AC400 and AC600 were lower than the general activated carbon. This suggests that PAC400 and PAC600 have significantly improved the ability of adsorbing Cr(VI) by adding Zn. Langmuir and Freundlich equations are classical models for adsorption isotherms. Freundlich equation is expressed as:| qe = kf × Cen | (4) |
 | (5) |
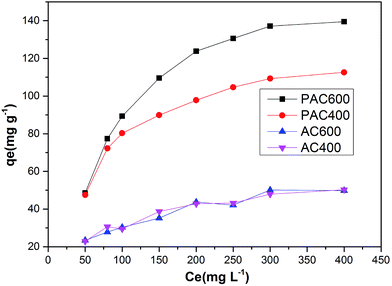 | ||
| Fig. 12 Adsorption (in ppm) vs. Cr(VI) concentration at fixed adsorbent dose (0.05 g), pH 3.0, contact time (24 h, 120 rpm) at 25 °C, Ce (Cr(VI) concentration). | ||
| Adsorbents | Langmuir isotherm | Freundlich isotherm | ||||
|---|---|---|---|---|---|---|
| b | qm (mg g−1) | R2 | Kf | n | R2 | |
| PAC400 | 0.012 | 136.87 | 0.976 | 12.936 | 0.411 | 0.903 |
| PAC600 | 0.008 | 187.79 | 0.980 | 16.093 | 0.335 | 0.911 |
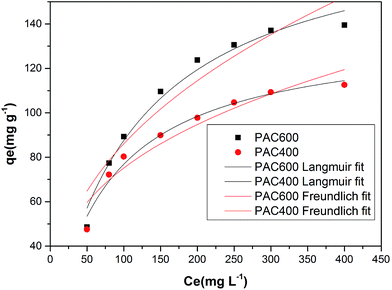 | ||
| Fig. 13 Langmuir and Freundlich isotherm for PAC400 and PAC600 (Cr(VI) solution volume: 50 mL; adsorbent dose: 0.05 g; contact time: 24 h; pH: 3.0). | ||
3.6. Desorption of Cr(VI)
To make the sorption media cost effectively for Cr(VI) removal from industrial wastewater, it is important that the PAC400 and PAC600 should be reused for repeated cycles. Fig. 14 was the result of the desorption of Cr(VI) from the adsorbent. It is observed that the removal efficiencies were 98.8% (PAC400) and 98.3% (PAC600) in one cycle. In the second cycle the material removed 90.6% (PAC400) and 89.3% (PAC600) Cr(VI). The removal efficiencies also were reached more than 80%. It indicated that the reduction property of PAC400 and PAC600 to Cr(VI) was diminished after first adsorption. In the subsequent twice cycles the removal efficiencies reduced to 73.7% (PAC400), 74.8% (PAC600) and 63.2% (PAC400), 70.4% (PAC600). In the process of desorption it found that desorption reached equilibrium within ten minutes. Desorption recyclability studies indicated that PAC400 and PAC600 could be repeatedly used as efficient adsorbent in process of adsorbing Cr(VI).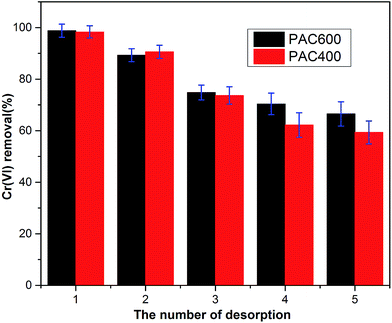 | ||
| Fig. 14 Desorption cycles of the desorption condition: stripping solution 1 mol L−1 NaOH, total volume 50 mL, equilibration time 120 min. | ||
4. Conclusion
The present work demonstrated the feasibility of PAC400 and PAC600 to remove heavy metals Cr(VI) from aqueous solution. PAC400 and PAC600 were prepared by heating PAN which was immersed 100 mL of water solution containing 1 mol L−1 Zn(NO3)2 and oxidation drying in air. Activated carbons deriving from PAN fiber are highly pores centered at the supermicropore region. The adsorption process was high dependence on pH. The favorable pH value for the adsorption was 3. PAC600 showed better adsorption efficiency than PAC600. It was found that the pseudo second order equation was able to better describe the adsorption of Cr(VI) by comparing the correlation coefficient (R2). Adsorption of Cr(VI) accorded with the Langmuir model better as evidenced by comparing with correlation value. This paper was an attempt to demonstrate the possible interaction mechanism of Cr(VI) and PAC, and for the purpose of obtaining the optimal conditions for the maximum removal of Cr(VI). PAC400 and PAC600 adsorbents could be regenerated and reused for three consecutive cycles. Therefore, they could be useful material in treatment water contaminated with Cr(VI).Acknowledgements
The authors would like to thank financial support from the National Natural Science Foundation of China (Grant no. 41271332, 51108167 and 51478470).References
- S. D. Kim, K. S. Park and M. B. Gu, J. Hazard. Mater., 2002, 93, 155–164 CrossRef CAS.
- J. Papp, US Geological Survey, Washington, DC, 2001 Search PubMed.
- G. Donmez and Z. Aksu, Process Biochem., 2002, 38, 751–762 CrossRef CAS.
- G. Y. S. Chan, L. Wai-Hung, T. A. Kurniawan and S. Babel, Chem. Eng. J., 2006, 118, 83–98 CrossRef PubMed.
- S. Pandey and S. B. Mishra, J. Colloid Interface Sci., 2011, 361, 509–520 CrossRef CAS PubMed.
- S. Fendorf, B. W. Wielinga and C. M. Hansel, Int. Geol. Rev., 2000, 42, 691–701 CrossRef.
- M. Costa, Toxicol. Appl. Pharmacol., 2003, 188, 1–5 CrossRef CAS.
- X. Dong, L. Q. Ma and Y. Li, J. Hazard. Mater., 2011, 190, 909–915 CrossRef CAS PubMed.
- M. A. Zaini, Y. Amano and M. Machida, J. Hazard. Mater., 2010, 180, 552–560 CrossRef CAS PubMed.
- J. Rivera-Utrilla, M. Sanchez-Polo, V. Gomez-Serrano, P. M. Alvarez, M. C. Alvim-Ferraz and J. M. Dias, J. Hazard. Mater., 2011, 187, 1–23 CrossRef CAS PubMed.
- C. K. Ahn, Y. M. Kim, S. H. Woo and J. M. Park, Hydrometallurgy, 2009, 99, 209–213 CrossRef CAS PubMed.
- C. Yin, M. Aroua and W. Daud, Sep. Purif. Technol., 2007, 52, 403–415 CrossRef CAS PubMed.
- S. Deng, R. Bai and J. Chen, Interface Sci., 2003, 260, 265–272 CrossRef CAS.
- P. K. Neghlani, M. Rafizadeh and F. A. Taromi, J. Hazard. Mater., 2011, 186, 182–189 CrossRef CAS PubMed.
- A. M. Shoushtari, M. Zargaran and M. Abdouss, J. Appl. Polym. Sci., 2006, 101, 2202–2209 CrossRef CAS.
- P. Tahaei, M. Abdouss, M. Edrissi, A. Shoushtari and M. Zargaran, Materialwiss. Werkstofftech., 2008, 39, 839–844 CrossRef CAS.
- S. Deng, R. Bai and J. P. Chen, Langmuir, 2003, 19, 5058–5064 CrossRef CAS.
- K. Saeed, S. Haider, T.-J. Oh and S.-Y. Park, J. Membr. Sci., 2008, 322, 400–405 CrossRef CAS PubMed.
- T.-H. Ko, S.-C. Liau and M.-F. Lin, J. Mater. Sci., 1992, 27, 6071–6078 CrossRef CAS.
- X. Tan, Y. Liu, G. Zeng, X. Wang, X. Hu, Y. Gu and Z. Yang, Chemosphere, 2015, 125, 70–85 CrossRef CAS PubMed.
- C. Hou, R. Qu, J. Liu, L. Ying and C. Wang, J. Appl. Polym. Sci., 2006, 100, 3372–3376 CrossRef CAS.
- D. Sawai, Y. Fujii and T. Kanamoto, Polymer, 2006, 47, 4445–4453 CrossRef CAS PubMed.
- N. An, Q. Xu, L. H. Xu and S. Z. Wu, Adv. Mater. Res., 2006, 11, 383–386 CrossRef PubMed.
- J. Liu and W. Zhang, J. Appl. Polym. Sci., 2005, 97, 2047–2053 CrossRef CAS.
- P. J. Sánchez-Soto, M. Aviles, J. del Rıo, J. Ginés, J. Pascual and J. Pérez-Rodrıguez, J. Anal. Appl. Pyrolysis, 2001, 58, 155–172 CrossRef.
- X. Huang, Materials, 2009, 2, 2369–2403 CrossRef CAS PubMed.
- I. Martín-Gullón, R. Andrews, M. Jagtoyen and F. Derbyshire, Fuel, 2001, 80, 969–977 CrossRef.
- A. Gupta and I. Harrison, Carbon, 1996, 34, 1427–1445 CrossRef CAS.
- P. Wang, Z. Yue and J. Liu, J. Appl. Polym. Sci., 1996, 60, 923–929 CrossRef CAS.
- Y. Fan, H. J. Liu, Y. Zhang and Y. Chen, J. Hazard. Mater., 2014, 283C, 321–328 Search PubMed.
- M. S. A. Rahaman, A. F. Ismail and A. Mustafa, Polym. Degrad. Stab., 2007, 92, 1421–1432 CrossRef CAS PubMed.
- D. Edie, Carbon, 1998, 36, 345–362 CrossRef CAS.
- T.-H. Ko, T.-C. Day and M.-F. Lin, J. Mater. Sci. Lett., 1993, 12, 343–345 CrossRef CAS.
- A. Shokuhfar, A. Sedghi and R. E. Farsani, Mater. Sci. Technol., 2006, 22, 1235–1239 CrossRef CAS PubMed.
- O. Dulub, L. A. Boatner and U. Diebold, Surf. Sci., 2002, 519, 201–217 CrossRef CAS.
- A. A. El-Bindary, M. A. Hussien, M. A. Diab and A. M. Eessa, J. Mol. Liq., 2014, 197, 236–242 CrossRef CAS PubMed.
- M. A. Vergés, A. Mifsud and C. Serna, J. Chem. Soc., Faraday Trans., 1990, 86, 959–963 RSC.
- S. Hayashi, N. Nakamori and H. Kanamori, J. Phys. Soc. Jpn., 1979, 46, 176–183 CrossRef CAS.
- A. M. Oen, B. Beckingham, U. Ghosh, M. E. Krusa, R. G. Luthy, T. Hartnik, T. Henriksen and G. Cornelissen, Environ. Sci. Technol., 2011, 46, 810–817 CrossRef PubMed.
- I. Kaminska, A. Barras, Y. Coffinier, W. Lisowski, S. Roy, J. Niedziolka-Jonsson, P. Woisel, J. Lyskawa, M. Opallo, A. Siriwardena, R. Boukherroub and S. Szunerits, ACS Appl. Mater. Interfaces, 2012, 4, 5386–5393 CAS.
- H.-L. Ma, Y. Zhang, Q.-H. Hu, D. Yan, Z.-Z. Yu and M. Zhai, J. Mater. Chem., 2012, 22, 5914 RSC.
- A. Z. Badruddoza, Z. B. Shawon, W. J. Tay, K. Hidajat and M. S. Uddin, Carbohydr. Polym., 2013, 91, 322–332 CrossRef CAS PubMed.
- V. I. Nefedov, M. N. Firsov and I. S. Shaplygin, J. Electron Spectrosc. Relat. Phenom., 1982, 26, 65–78 CrossRef CAS.
- G. Deroubaix and P. Marcus, Surf. Interface Anal., 1992, 18, 39–46 CrossRef CAS.
- T. L. Barr, M. Yin and S. Varma, J. Vac. Sci. Technol., A, 1992, 10, 2383–2390 CAS.
- T. L. Barr and J. J. Hackenberg, Appl. Surf. Sci., 1982, 10, 523–545 CrossRef CAS.
- L. Dake, D. Baer and J. Zachara, Surf. Interface Anal., 1989, 14, 71–75 CrossRef CAS.
- D. Mohan and C. U. Pittman Jr, J. Hazard. Mater., 2006, 137, 762–811 CrossRef CAS PubMed.
- N. Ballav, A. Maity and S. B. Mishra, Chem. Eng. J., 2012, 198–199, 536–546 CrossRef CAS PubMed.
- D. Kavitha and C. Namasivayam, Bioresour. Technol., 2007, 98, 14–21 CrossRef CAS PubMed.
| This journal is © The Royal Society of Chemistry 2015 |

