
 Open Access Article
 This Open Access Article is licensed under a Creative Commons Attribution-Non Commercial 3.0 Unported Licence
SPION@polydehydroalanine hybrid particles†
Moritz von der Lüheab,
Ulrike Güntherab,
Andreas Weidnerc,
Christine Gräfed,
Joachim H. Clementbd,
Silvio Dutzce and
Felix H. Schacher*ab
aInstitute of Organic and Macromolecular Chemistry (IOMC), Friedrich Schiller University Jena, Humboldtstraße 10, 07743 Jena, Germany. E-mail: felix.schacher@uni-jena.de
bJena Center for Soft Matter (JCSM), Friedrich Schiller University Jena, Philosophenweg 7, 07743 Jena, Germany
cInstitute of Biomedical Engineering and Informatics, Technische Universität Ilmenau, 98693 Ilmenau, Germany
dKlinik für Innere Medizin II, Abteilung Hämatologie und Internistische Onkologie, Universitätsklinikum Jena, 07743 Jena, Germany
eDepartment of Nano Biophotonics, Leibniz Institute of Photonic Technology, 07745 Jena, Germany
First published on 26th March 2015
Abstract
It is generally accepted that a protein corona is rapidly formed upon exposure of nanoparticles to biological fluids and that both the amount and the composition of adsorbed proteins affect the dispersion properties of the resulting particles. Hereby, the net charge and overall charge density of the pristine nanoparticles are supposed to play a crucial role. In an attempt to control both charge and charge distribution, we report on the coating of superparamagnetic iron oxide nanoparticles (SPIONs) with different polyelectrolytes. Starting from orthogonally protected polydehydroalanine, the material can be easily transformed into a polyanion (poly(tert-butoxycarbonyl acrylic acid), PtBAA), polycation (poly(aminomethylacrylate), PAMA), or even a polyzwitterion (polydehydroalanine, PDha). While coating of SPIONs with PtBAA and PDha was shown to be successful, approaches using PAMA have failed so far. The dispersion properties of the resulting hybrid particles have been investigated using dynamic light scattering (DLS), zeta-potential, and TEM measurements – the amount of adsorbed polymer was quantified using vibrating sample magnetometry (VSM) and thermogravimetric analysis (TGA).
Introduction
During the last decades, magnetic nanoparticles (MNP) have gained remarkable interest regarding their use in biomedical applications.1 They are used as contrast agents for nuclear magnetic resonance imaging (MRI)2,3 as well as in therapeutic approaches like hyperthermia,4–7 drug targeting via external magnetic fields,8–11 and targeted drug delivery. Conventional materials often cannot fulfill the strict requirements necessary for materials in biomedical applications, and therefore innovative materials are needed, where certain properties such as size, shape, charge, and charge density can be precisely controlled.Recently, a lot of effort has been devoted to the synthesis and characterization of hybrid materials featuring inorganic magnetic cores and organic coatings. Such hybrid materials offer many options as they combine the properties of both components: the magnetic core and, thus, the opportunity of manipulation via external fields as well as an organic coating, which allows the adjustment of particle properties like solubility, surface charge, and particle–particle as well as particle–tissue interactions. The organic coating also enables further surface functionalization with, e.g., antibodies, proteins, or dyes for medical imaging and their use in therapeutic approaches.12 Regarding the core materials, superparamagnetic iron oxide nanoparticles (SPION) consisting of iron oxides like magnetite (Fe3O4) and maghemite (γ-Fe2O3) are of peculiar interest because of their lowered toxicity in comparison to other magnetic materials like Ni or Co at comparably high magnetizations.13 Hereby, the inherent magnetic characteristics of the core depend on the particle size.14 Already in 1930 it was predicted that MNPs with radii below 15 nm would consist of a single magnetic domain and feature superparamagnetic properties, i.e. the absence of magnetic moments in MNP without the presence of an external magnetic field.15
Upon the application of MNP into biological systems, a protein corona is formed due to immediate protein adsorption onto the particle surface.16 This corona formation is influenced by a number of particle-associated factors like size, surface charge,17,18 and incubation temperature. The temperature is supposed to influence both the formation and the composition of the protein corona,19 whereas the particle size only seems to influence the amount of adsorbed protein but not the corona composition itself.16 Surface charge on the other hand has an impact on the corona formation as well as the particle toxicity and cell uptake. It was already shown that positively charged nanoparticles show increased cell uptake and cytotoxicity compared to particles exhibiting negative charges.20 However, here the focus has been put on the particle net charge whereas the influence of charge density so far has not been investigated. An elegant way to adjust the surface charge of magnetic nanoparticles is via different coating materials. In that respect, different polyelectrolyte coatings for inorganic nanoparticles are described in the literature, often adsorbed to the particle surface using layer by layer (LBL) techniques based on attractive electrostatic forces.21 In 2004, the preparation of magnetite MNPs coated with poly(allylamine hydrochloride) (PAH) by LBL approaches was reported where PAH was adsorbed onto negatively charged MNPs at pH = 8.22
Also, LBL multishell hybrid particles labeled with poly(9,9-di[3′-(1-ethyl-1,1-dimethylammonio)propyl]2,7-fluorenyl-alt-1,4-phenylene dibromide),23 coated with poly(acrylic acid) (PAA),24 or natural polyelectrolytes like alginate25 and chitosan for drug delivery applications11 have been described. Wotschadlo et al. reported the encapsulation of SPION aggregates within alternating layers of carboxymethyldextrane (CMD) and poly(diallyldimethylammonium chloride) (PDADMAC).26 They also investigated the influence of shell composition on subsequent interactions of these hybrid materials with cells, with the result that CMD shows rapid uptake into tumor cells, whereas carboxymethylated cellulose and pullulan show interactions with tumor cells as well as with leukocytes.27 Another example, rather focusing on heterogeneous catalysis, used amino cellulose as coating for SPIONs. The resulting Fe3O4@amino cellulose MNPs could then be used as heterogeneous catalysts in atom transfer radical polymerizations of styrene.28 Also, “grafting from” strategies starting from SPIONs have been analyzed quantitatively.29
Our work focuses on the preparation of hybrid nanoparticles featuring a SPION core, consisting of both maghemite (γ-Fe2O3) and magnetite (Fe3O4), and a polyelectrolyte shell. The polymer we employ as organic coating can be selectively transformed into a polycation, polyanion, or even a polyzwitterion without variations of the polymer backbone being necessary. Starting from poly(tert-butoxycarbonylamino methylacrylate) (PtBAMA), a material which carries both a protected amino group (tert-butoxycarbonyl, boc) and a protected carboxylic acid group (methyl ester), each group can be deprotected separately. This leads to either polycationic poly(aminomethyl acrylate) (PAMA), polyanionic poly(tert-butoxycarbonylamino acrylic acid) (PtBAA), or in the case of complete deprotection, to polyzwitterionic poly(dehydroalanine) (PDha, Scheme 1).30
 | ||
| Scheme 1 Synthesis and polymerization of tBAMA, followed by deprotection leading to poly(tert-butoxycarbonylamino acrylic acid) (PtBAA), poly(aminomethyl acrylate) (PAMA), and poly(dehydroalanine) (PDha). | ||
Magnetite MNP with 8 nm in diameter have been successfully coated with both PtBAA and PDha in different amounts. The obtained hybrid particles have been characterized by dynamic light scattering (DLS), zeta-potential measurements, vibrating sample magnetometry (VSM), and transmission electron microscopy (TEM). Whereas PtBAA and PDha readily seem to form adsorbed layers on MNP, up to now this could not be achieved in case of PAMA due to solubility issues. First in vitro biocompatibility assays revealed no cytotoxic effects of both PtBAA and PDha.
Results and discussion
Synthesis of polyelectrolytes
Poly(tert-butoxycarbonylamino methacrylate) (PtBAMA) was synthesized via free radical polymerization (FRP) using Lucirin-TPO® as UV-photoinitiator. Compared to our earlier study,30 we also used solution polymerization in 1,4-dioxane (50 wt%) as, in this case, it was possible to obtain materials with molar masses below 50![[thin space (1/6-em)]](https://www.rsc.org/images/entities/char_2009.gif) 000 g mol−1 in a straightforward manner. The reason for using PtBAMA with molar masses below 50000 g mol−1 is that we anticipated the encapsulation of single MNPs to be achieved more easily compared to longer polymer chains. After 5 minutes under UV exposure, the polymerization was stopped and materials with a molar mass of Mw = 43000 g mol−1 according to size exclusion chromatography (DMAc as solvent, poly(methyl methacrylate) (PMMA) calibration) could be obtained. The purification was carried out by dialysis against methanol.
000 g mol−1 in a straightforward manner. The reason for using PtBAMA with molar masses below 50000 g mol−1 is that we anticipated the encapsulation of single MNPs to be achieved more easily compared to longer polymer chains. After 5 minutes under UV exposure, the polymerization was stopped and materials with a molar mass of Mw = 43000 g mol−1 according to size exclusion chromatography (DMAc as solvent, poly(methyl methacrylate) (PMMA) calibration) could be obtained. The purification was carried out by dialysis against methanol.
The obtained polymer was characterized using NMR spectroscopy (Fig. S1†) as well as SEC measurements (Fig. S2†). The 1H-NMR-spectrum of PtBAMA was measured in CDCl3 and shows signals at δ = 5.4 ppm (b, 1H) for the amino function, δ = 3.7 ppm (3H) for the methyl ester and δ = 1.4 ppm (11H) for the boc protective group and the polymer backbone according to literature.30 SEC measurements in DMAc (Fig. S2†) revealed the molar masses shown in Table 1. As SEC only provides apparent values, we also used static light scattering (SLS) in MeOH with concentrations ranging from 0.5 to 5 g L−1 (Fig. S3†). In contrast to earlier studies, SLS yielded slightly lower Mw values (37000 g mol−1, leading to PtBAMA184 with the subscripts denoting the degrees of polymerization) than obtained by SEC. At this point, we explain this by certain polymer–column interactions, which also might explain the tailing observed in the SEC elugrams.
Next, PtBAMA was partially deprotected to either poly(aminomethyl acrylate) (PAMA) or poly(tert-butoxycarbonylamino acrylic acid) (PtBAA). For alkaline deprotection of the methyl ester, PtBAMA was stirred with 14 equivalents of LiOH in a 1,4-dioxane–water mixture (1/1) at 100 °C for 3 hours. The product (PtBAA184) was purified by dialysis against water. 1H-NMR in D2O/NaOD with pD = 12 showed signals at δ = 2.7 ppm (b, 2H for the polymer backbone) and δ = 1.3 ppm (s, 9H) for the boc-protective group.
PAMA was obtained by acidic deprotection of the boc protective group in PtBAMA. Therefore, PtBAMA was stirred in trifluoro acetic acid at 50 °C for 1 hour and the product was purified by subsequent precipitation in methanol. The 1H-NMR spectrum measured in DMSO-d6 shows signals at δ = 3.6 ppm (3H) for the methyl ester and δ = 2.1 ppm (2H) for the polymer backbone. Also, 13C-NMR measurements show the absence of the signal at δ = 153 ppm for the boc protective group. PAMA was then further treated with LiOH at 100 °C for 3 hours to obtain completely deprotected polydehydroalanine (PDha).
The obtained polyelectrolytes exhibit very different solubilities. Both, the polyanionic PtBAA and the polycationic PAMA only dissolve at pH values higher than 10, in case of PAMA unfortunately under partial deprotection of the boc protective group. The fully deprotected PDha is directly soluble in alkaline media of pH = 8 or higher, but can be brought to lower pH values by subsequent titration steps. For biocompatibility tests, the polyelectrolytes were dissolved at pH = 8 (PDha184) and pH = 10 (PtBAA184) with 5 g L−1 and then titrated to pH = 7 using small aliquots of 1 M HCl.
Biocompatibility of PDha and PtBAA
In order to validate the biocompatibility of both polyanionic and polyzwitterionic polyelectrolytes (PAMA was not tested – again due to solubility issues), in vitro viability studies were performed. Human brain microvascular endothelial cells (HBMEC) serving as sensitive cell culture model representing the human blood–brain barrier were exposed to increasing concentrations of PtBAA184 or PDha184 for indicated durations and subsequently subjected to a fluorescence-based viability assay. As can be seen, both PDha184 and PtBAA184 do not exert cytotoxic effects on HBMEC up to a concentration of 75.6 μg mL−1 and over a 24-hour treatment period (Fig. 1). | ||
| Fig. 1 Increasing concentrations of PDha184 and PtBAA184 do not affect viability of HBMEC; HBMEC cultures were incubated with both polymers for 3 h (A) or 24 h (B) with concentrations as indicated. neg. control: MilliQ water, negative control with regard to cytotoxicity; pos. control: detergent TritonX100 (final conc. 0.02% (v/v)), positive control with regard to cytotoxicity. | ||
Synthesis of the SPION core
The nanoparticles were synthesized by co-precipitation of FeCl2 and FeCl3 in alkaline media as described earlier.31 The pristine particles are stabilized in acidic media (pH = 2) due to repulsive electrostatic forces resulting from positive surface charges. Table 2 shows number-weighted particle size distributions, obtained from CONTIN analysis of the measured autocorrelation functions at different pH values. They show an average diameter of 8 nm at pH = 2 which was also confirmed by transmission electron microscopy (TEM: d = 12 ± 2 nm, Fig. S3 and S4†). The DLS CONTIN-plot at pH 7 is also included in Fig. 3A–C. At pH-values >7 aggregation of the SPION cores occurred, followed by precipitation after several minutes. Characterization with vibrating sample magnetometry (VSM) showed prevailing superparamagnetic properties, i.e. a high saturation magnetization Ms (72 Am2 kg−1) and low coercivity Hc (1.6 kA m−1). The particle diameter of 8.3 nm from VSM (Chantrell method) is in good agreement with DLS at pH values up to 6. The hysteresis loop is shown together with those of the hybrid particles after coating with PtBAA or PDha in Fig. 5.| pH | dDLS after ultrasonication [nm] |
|---|---|
| 2 | 8 |
| 6 | 8 |
| 12 | 22 |
TGA measurements of the pristine particles under inert atmosphere show a weight loss of 3.3% in three steps. The first step from 20 to 125 °C (1.1%) can be attributed to the evaporation of adsorbed water. The second step from 200 to 500 °C (1.4%) might result from a phase transformation of a small amount of impurity phases (hydrated oxides and hydroxides of iron) to hematite, and during the last step from 500 to 800 °C (0.8%) remaining salts and carbonates trapped inside the particles evaporate. The corresponding thermogram is depicted together with those for the hybrid particles after coating with PtBAA or PDha in Fig. 4.
Nanoparticle coating
As discussed above, SPIONs form stable dispersions in acidic media whereas both PtBAA and PDha are soluble at pH values above 7. In case of PAMA, DMSO as organic co-solvent had to be employed to ensure solubility. Therefore, separate coating conditions had to be found for each combination of polyelectrolyte and SPION (Scheme 2).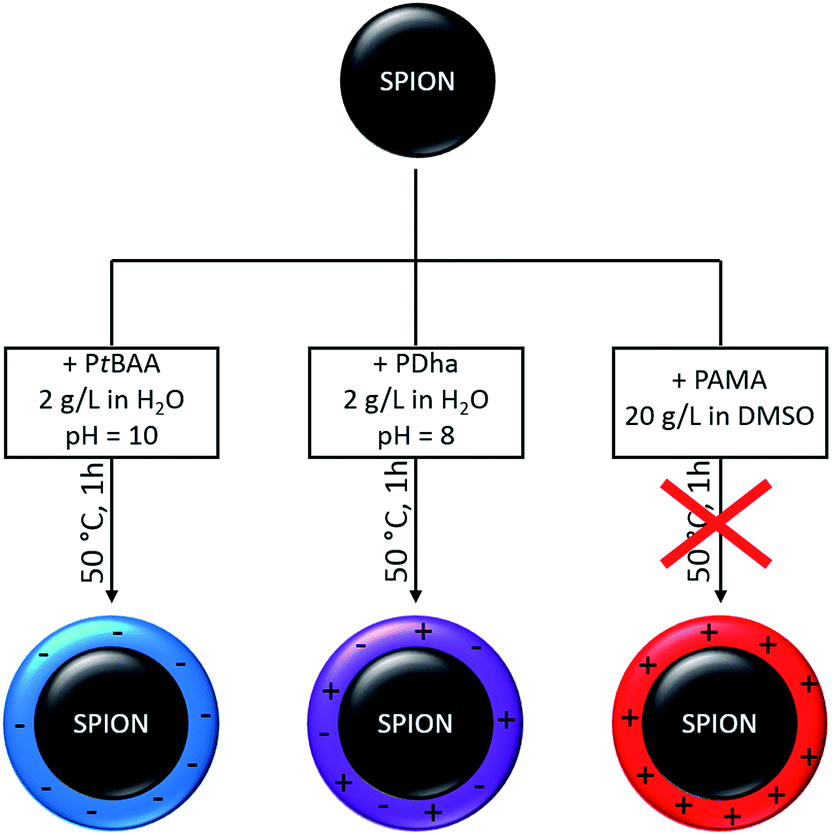 | ||
| Scheme 2 SPION coating with different polyelectrolytes – PtBAA (left), PDha (middle), and PAMA (right), leading to SPION@polyelectrolyte hybrid particles with different surface charge. | ||
:M, MNP:polymer 1:2) down to −31.8 mV (1:8) at pH = 7 (Fig. 2A). The values for SPION@PDha184 at pH = 7 also decrease to values between +11.2 (1:8) and +14.9 (1:2).
 | ||
| Fig. 2 ζ-potentials of SPION@PtBAA184 at pH = 7 at different Fe:polymer ratios (A) and SPION@PDha184 (B) at pH = 7; (C) dispersion properties of pristine MNP (left) and SPION@PDha184 at different Fe:polymer ratios (1:1, 1:2, 1:4 and 1:8; C) at pH = 7. | ||
The changes in surface charge directly influence the dispersion stability of SPION@PtBAA184 and SPION@PDha184. Whilst pristine SPIONs showed good dispersion stability under acidic conditions up to pH = 7, both SPION@PtBAA184 and SPION@PDha184 behaved differently: stable dispersions were formed at higher pH values (Fig. 2C), whereas precipitation occurred upon pH = 7 or lower in case of SPION@PtBAA184. SPION@PDha184 forms stable dispersions under acidic conditions and shows precipitation at pH = 7 if not agitated, but can be redispersed using, e.g. ultrasound. We attribute this to successful adsorption of material on the particle surface and the fact that SPION@PDha184 is only partially stable at pH = 7 can be attributed to the isoelectric point of PDha which has been determined to be around pH 6.6 in earlier studies.30
Due to certain agglomeration of the hybrid particles occurring independent of the polymer used for surface modification, DLS results regarding changes in particle size are difficult to interpret quantitatively. We therefore relied mostly on TEM measurements to determine the average sizes of SPION@polyelectrolyte hybrid particles. In all cases, TEM data showed only a slight increase in particle diameter (Fig. 3, see also Table 3). For the size determination, 100 particles from different micrographs of the same sample were measured to estimate the mean diameter.
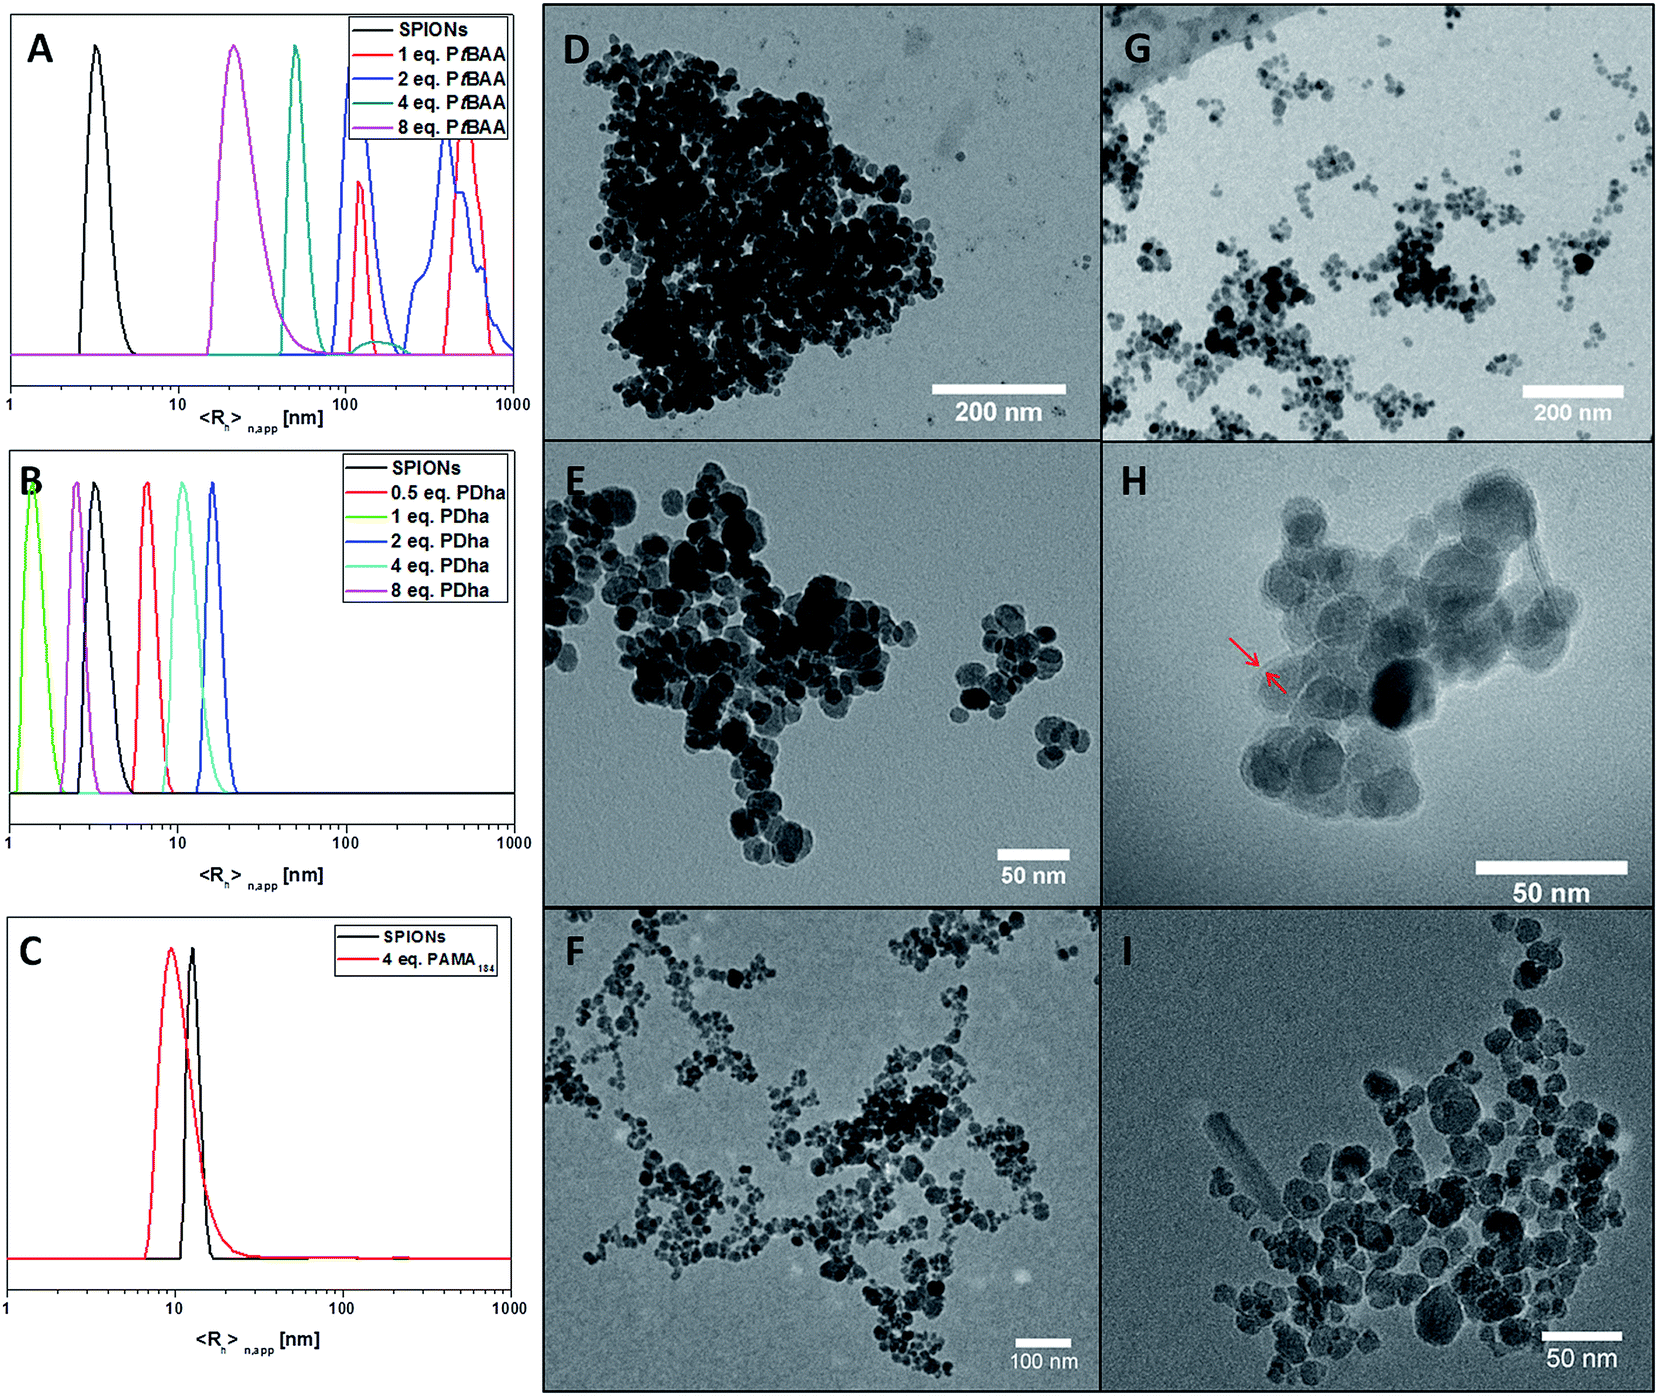 | ||
| Fig. 3 Particle sizes of (A) SPION@PtBAA184, (B) SPION@PDha184, and (C) SPION@PAMA184 as determined by DLS; TEM micrographs of SPION@PtBAA184 with 1 (D) and 8 equivalents (G) PtBAA184; SPION@PDha184 with 1 (E) and 8 equivalents (H) PDha184; and (F) SPION@PAMA184 (higher magnification shown in (I)). | ||
| Sample | Eq. PE | dDLS [nm] | dTEM [nm] | Weight loss TGA [%] | ζ-potential (pH = 7) [mV] | rs calc. from eqn (1) [nm] | Ms [Am2 kg−1] |
|---|---|---|---|---|---|---|---|
| SPIONs | 8 | 12 ± 2 | 3.3 | 31.7 | — | 72 | |
| SPION@PtBAA184 | 1 | 354 | 13 ± 3 | 3 | 5.3 | 1.5 ± 0.5 | 65.4 |
| SPION@PtBAA184 | 2 | 226 | 12 ± 3 | 9 | −18.8 | 4.2 ± 1.4 | 64.3 |
| SPION@PtBAA184 | 4 | 103 | 13 ± 2 | 13 | −31.8 | 6.8 ± 1.7 | 61.5 |
| SPION@PtBAA184 | 8 | 40 | 12 ± 3 | 12 | −25.9 | 6.5 ± 1.6 | 60.8 |
| SPION@PDha184 | 0.5 | 14 | 13 ± 3 | 1.0 | 13.5 | 2.2 ± 0.7 | 65.6 |
| SPION@PDha184 | 1 | 3 | 13 ± 3 | 0.6 | 14.9 | 1.8 ± 0.6 | 71.2 |
| SPION@PDha184 | 2 | 32 | 12 ± 2 | 1.3 | 16.0 | 2.4 ± 0.8 | 68.5 |
| SPION@PDha184 | 4 | 23 | 14 ± 3 | 0.6 | 13.8 | 1.8 ± 0.6 | 68.5 |
| SPION@PDha184 | 8 | 5 | 13 ± 3 | 4.4 | 11.2 | 3.6 ± 1.2 | 65.9 |
| SPION@PAMA184 | 4 | 10 | 12 ± 3 | 1.7 | 24.3 | — | — |
The number weighted DLS measurements show strongly increased particle diameters after the addition of PtBAA184. The pristine particles show a diameter of 8 nm, which is increased to 354 nm after the addition of 1 equivalent of PtBAA184 (Fig. 3A). This hints towards strong agglomeration of the coated particles. The formed agglomerates show decreasing apparent sizes with increasing polyelectrolyte content: 226 nm for 2, 103 nm for 4 and 40 nm for 8 equivalents. This can be interpreted as an increase in particle stability. The particle size determined from TEM micrographs shows almost no changes as the polyelectrolyte shell cannot be observed due to large differences in the electron density between core and shell material. The particle sizes were determined to 13 ± 3 nm after the addition of 1 eq. PtBAA184, 12 ± 3 nm (2 eq.), 13 ± 2 nm (4 eq.), and 12 ± 3 nm (8 eq.). The size distributions are included in the ESI (Fig. S5†). Nevertheless, TEM micrographs show decreasing agglomerate sizes with increasing polyelectrolyte content as well (Fig. 3D and G). In case of SPION@PDha184, the DLS measurements exhibit no trend for particles coated with different amounts of PDha. After the addition of 0.5 mass equivalents PDha184, the DLS measurement shows a particle size of 13 nm. After 1 equivalent PDha added, the size is determined to 3 nm, 32 nm after 2 equivalents, 23 nm after 4 equivalents and 5 nm after 8 equivalents (Fig. 3B). TEM data revealed comparable particle diameters of 13 ± 3 nm after the addition of 0.5 and 1 eq. PDha184, 12 ± 2 nm (2 eq.), 14 ± 3 nm (4 eq.), and 13 ± 3 nm (8 eq.). The size distributions are shown in Fig. S6.† For the TEM micrographs of the particles coated with 8 equivalents PDha184, the grey shade around the SPION cores might indicate the presence of a polymer shell of 2–5 nm (Fig. 3H, indicated by red arrows). Fig. 3C shows the number weighted size distribution functions as obtained from CONTIN analysis of the measured time autocorrelation functions of SPION@PAMA. As the measurements were carried out in DMSO, the sizes are not directly comparable with the other measurements. The particle size is shifted to slightly smaller values, but the particle size determined from TEM micrographs did not change significantly in comparison to the pristine particles.
The changes in dispersion stability and the results from TEM after treatment of SPIONs with solutions of PtBAA184 and PDha184 indicate a successful coating. To further quantify the amount of adsorbed polymer, both thermogravimetric analysis (TGA) and vibrating sample magnetometry (VSM) measurements were performed. The TGA measurements were realized under argon in a temperature range from 20–800 °C and at a heating rate of 10 K min−1. Both SPION@PtBAA184 and SPION@PDha184 hybrid particles show increasing weight loss with increasing amounts of polymer adsorbed to the particle surface (Fig. 4).
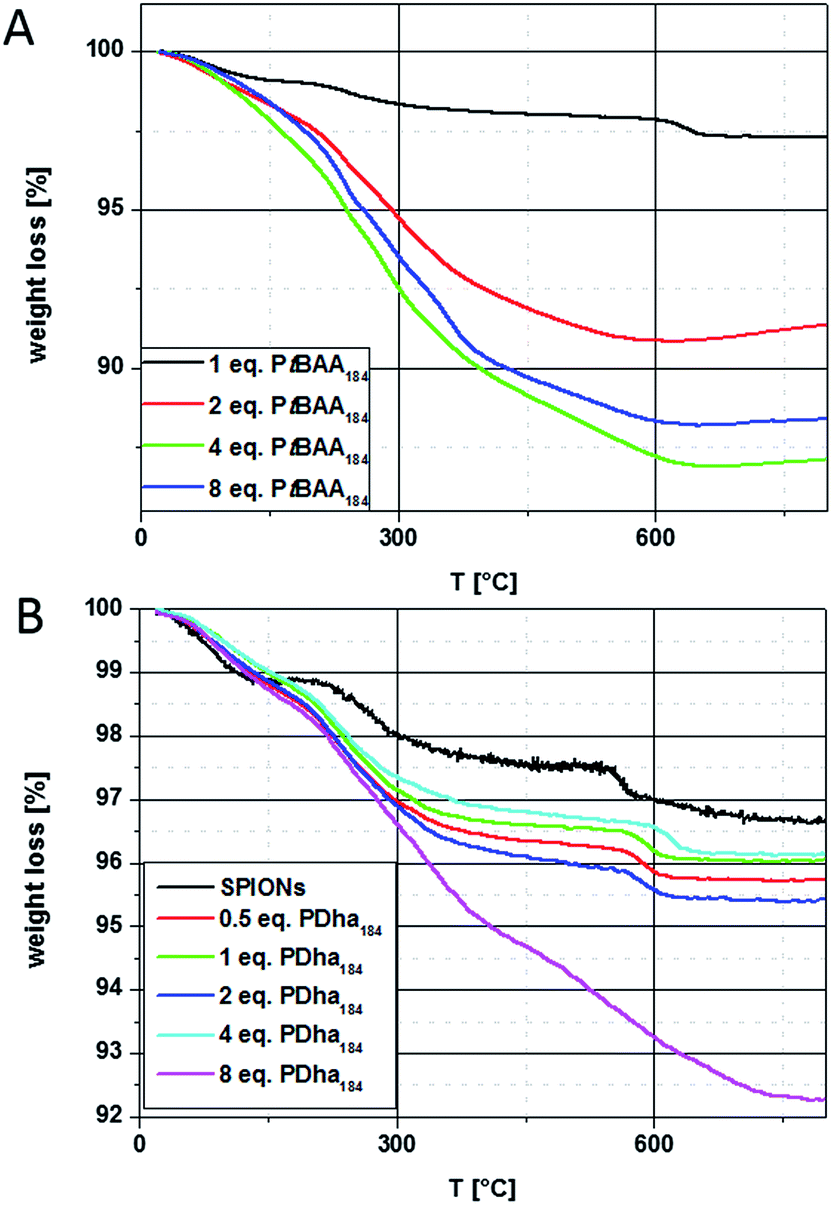 | ||
| Fig. 4 Thermogravimetric analysis of (A) SPION@PtBAA184 with 1 (black solid line), 2 (red line), 4 (green line) and 8 (blue line) equivalents of PtBAA184 added showing distinct increasing weight loss, and (B) SPION (black line), SPION@PDha184 with 0.5 (red line), 1 (green line), 2 (blue line), 4 (cyan line), and 8 equivalents PDha184 (pink line) added, approximately 7.7% weight loss in total. | ||
For SPION@PtBAA184, TGA data show only one main decomposition step between 200 and 800 °C. The remaining masses are 97% for a 1:1 ratio (Fe:polymer), 91% (1:2), 87% (1:4) and 88% in case of a 1:8 ratio (Fig. 4A). Comparable values for the addition of 4 and 8 equivalents hint towards saturation of the particle surface during shell formation. The weight loss during heating of SPION@PDha materials also occurs in three steps, similar to the observation made earlier for the pristine particles. The first step occurs up to 160 °C and can be attributed to the release of water embedded within the polymer shell. The next step between 200 and 500 °C is distinctly increased in comparison to the pristine particles, and the last step between 500 and 800 °C again is comparable but slightly shifted to higher temperatures. This might be explained by remaining degradation products on the particle surface that hinder the evaporation of carbonate salts. In case of the particles coated with 8 equivalents of PDha184, both the last two steps are strongly increased and are not separated as observed for the other cases. The overall weight loss is 4.3% for 0.5 equivalents PDha184, 4% for 1, 4.6% for 2, 3.9% for 4 and 7.7% for 8 equivalents of PDha184 (Fig. 4B). Deducting the 3.3% weight loss of the pristine particles, this leads to polymer contents of 1% for 0.5, 0.6% for 1, 1.3% for 2, 0.6% for 4, and 4.4% for 8 equivalents of PDha. The TGA measurement of SPION@PAMA184 shows only 5% weight loss, which would represent an adsorption of 1.7% – nevertheless, the unaltered dispersion properties in this case rather hint towards the adsorption of DMSO on the particle surface.
Using eqn (1), the polymer shell thickness rs can be calculated, using the radius of the core rc as determined by DLS and TEM, the density of Fe3O4 ρc (approximately 5.2 g cm−3), the density of the shell ρs, the weight loss wl and the residual mass rm, both determined by TGA. The density of the polymers has been determined using a 5 mL pyknometer and hexane as liquid phase.
| ρ(PtBAA184) = 0.918 g mL−1; ρ(PDha184) = 1.11 g mL−1 |
 | (1) |
The calculated values are depicted in Table 3. The resulting shell thicknesses for SPION@PtBAA184 are: 1.5 nm for 1 equivalent, 4.2 nm for 2 equivalents, 6.8 nm for 4 equivalents, and 6.5 nm for 8 equivalents. For SPION@PDha184 the calculations reveal shell thicknesses of 2.2 nm for 0.5 equivalents, 1.8 nm for 1 equivalent, 2.4 nm for 2 equivalents, 1.8 nm for 4 equivalents and 3.6 nm for 8 equivalents. Please note that these calculations use several approximations and, hence, these values are best treated as rough estimations. Nevertheless, coatings with a thickness in the range of 1–6 nm confirm results from DLS and TEM and, to our opinion, are realistic, taking into account that also loosely adsorbed material can contribute to these values in TGA. As mentioned before, the shell thicknesses determined from TEM micrographs for SPION@PDha184 with 8 equivalents of PDha184 vary from 2–8 nm, which is in the range of the calculations presented above.
VSM measurements were additionally performed to investigate the magnetic properties of the particles before and after coating with a polyelectrolyte shell. For VSM measurements, the sample is placed in a uniform magnetic field and the sample holder vibrates along the z-axis. The magnetic moment of the sample induces a voltage in the four pickup-coils, which is proportional to the magnetic moment. This allows measurements of the magnetization in dependence on the magnetic field and provides the saturation magnetization (Ms) and the coercivity (Hc) of magnetic nanoparticles. According to VSM measurements, both for SPION@PtBAA184 and SPION@PDha184 superparamagnetic behavior is retained, but distinctly lowered saturation magnetizations due to adsorbed non-magnetic material (Fig. 5) can be observed. According to this data, for a Fe:polymer ratio (PtBAA184) of 1:1 9.2 wt% of nonmagnetic material are adsorbed, 10.7% for ratio 1:2, 14.6% in case of 1:4, and 15.6 wt% in case of 1:8. Except for the ratio 1:1, these values are in good agreement with the values obtained by TGA measurements. For the addition of PDha184, a decrease of 8.8% can be seen already for a 2:1 ratio. In case of 1:1, Ms is only decreased by 1.2%, 4.8% decrease are shown for 2 and 4 equivalents of PDha184 and 8.5% for 8 equivalents. Except for the 2:1 ratio, the amounts of adsorbed non-magnetic material according to VSM measurements show the same trend as the TGA measurements, although the values obtained are slightly higher.
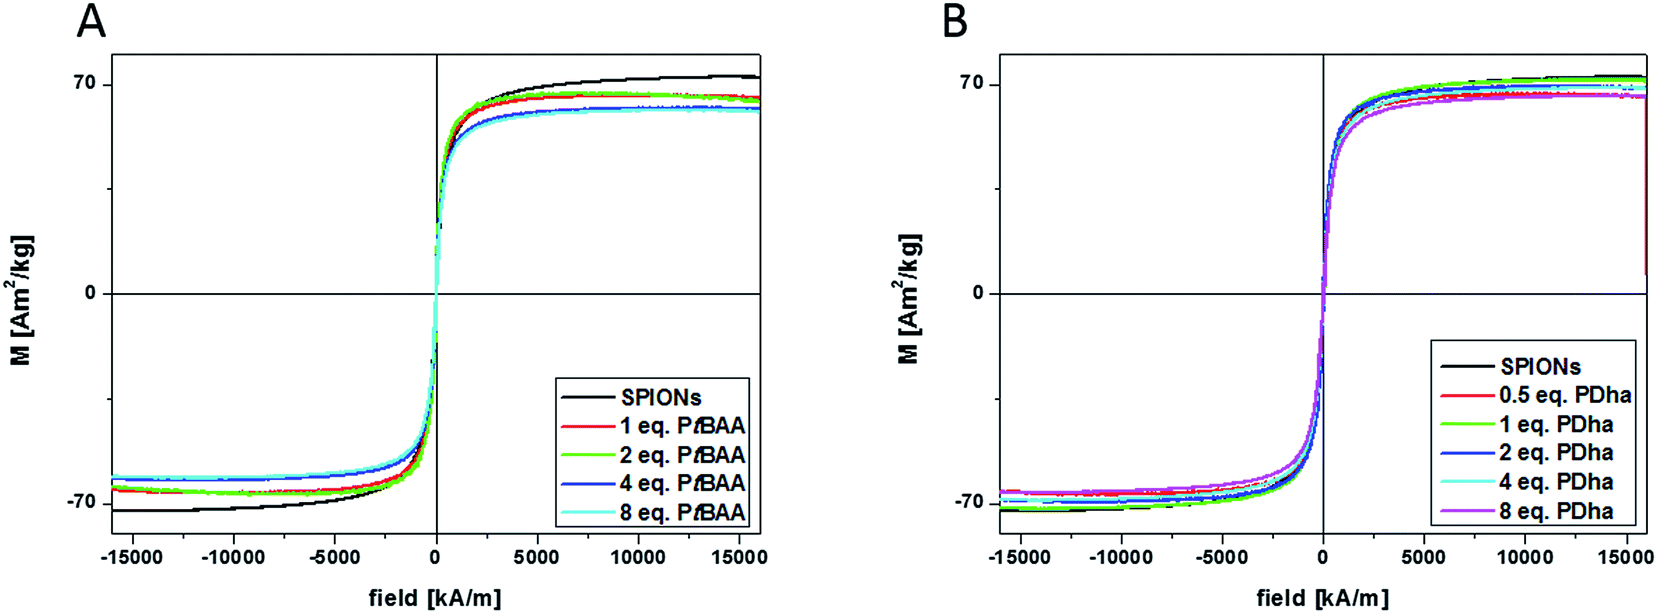 | ||
| Fig. 5 VSM measurements of different polymer coated SPION NP: (A) pristine SPIONs (black line) and coated with 1 (red line), 2 (green line), 4 (blue line), and 8 (cyan line) equivalents of PtBAA184, showing distinct decreasing Ms; (B) pristine MNP (black line) and coated with 0.5 (red line), 1 (green line), 2 (blue line), 4 (cyan line), and 8 (pink line) equivalents of PDha184. | ||
In case of SPION@PAMA184, no changes in saturation magnetization (Ms) were found, confirming our assumptions drawn earlier during discussion of the dispersion properties. We speculate that PAMA is not adsorbed on the particle due to the protected carboxylic acid and the lower affinity of iron to nitrogen. It is also possible that the SPION surface is influenced by the presence of large amounts of DMSO. In further studies, as an alternative a catechol-functionalized PAMA derivative will be used – although this will then represent an entirely different grafting strategy.
Conclusion
We have investigated the adsorption of partially or fully deprotected polydehydroalanines onto the surface of SPIONs. Three different polyelectrolytes based on the protected polydehydroalanine were synthesized by polymerization and consecutive deprotection of either one or both of the protected functionalities. According to TGA, VSM and zeta-potential measurements, coating of SPIONs with the two materials featuring a carboxylic acid functionality (PtBAA and PDha) in different amounts was successful, whereas coating with the polycationic PAMA could not be achieved so far. We attribute this to the repulsion due to the positive surface charges of both, the pristine particles and PAMA, as well as to solubility issues.Further work will focus on the PAMA adsorption as well as on charge control by adjusting the adsorbed amount of polyelectrolyte. The formed hybrid SPION@polyelectrolyte nanoparticles will furthermore be used for the investigation of the influence of charge and charge density on the corona formation by incubation of the particles in biological fluids.
Experimental part
Chemicals were purchased from Sigma-Aldrich or Carbolution (Saarbrücken, Germany) in p.a. grade and used without further purification. The photoinitiator Lucirin-TPO was kindly provided by BASF.Synthesis of poly(tert-butoxycarbonylaminomethyl acrylate) (PtBAMA)
Free radical polymerization in the bulk: to a solution of 500 mg (2.485 mmol) tBAMA in 2.5 mL acetone 17 mg (0.0497 mmol) TPO (M:I = 50:1) were added. The solution was degassed with argon until acetone was completely removed. During these steps, the reaction vial was protected with aluminum foil. Then the solution was placed in a UV-cube (250 W) for 2 hours.
The clear solid was redissolved in methanol and precipitated in a mixture of ethyl acetate and hexane (1:4). Yield: 90%.
Free radical polymerization in solution: a solution of 2.9 mg (0.0084 mmol) TPO in 300 μL 1,4-dioxane was added to 300 mg (1.49 mmol) of tBAMA (M:I = 200:1). The mixture was placed in an UV-cube (250 W) for 5 minutes. The polymer was precipitated in a mixture of ethyl acetate and hexane (1:4). Yield: 52%.
Synthesis of poly(tert-butoxycarbonyl aminoacrylic acid) (PtBAA)
6 mg TPO were added to a solution of 300 mg tBAMA in 300 μL 1,4-dioxane (50 wt%, M:I = 100:1). The mixture was placed in a UV cube for 5 minutes. Another 300 μL dioxane and a solution of 1.5 g LiOH in 6 mL H2O were added. The mixture was stirred at 100 °C for 3 hours and neutralized with diluted HClaq.. During the neutralization, PtBAA precipitated. Yield: 38%.
Synthesis of poly(aminomethyl acrylate) (PAMA)
6 mg TPO were added to a solution of 300 mg tBAMA in 300 μL 1,4-dioxane (50 wt%, M:I = 100:1). The mixture was placed in a UV cube for 5 minutes. 2.4 mL TFA were added and the mixture was stirred at 50 °C for 1 hour. The product was precipitated in methanol. Yield: 33%.
Synthesis of polydehydroalanine (PDha)
250 mg PAMA were dissolved in 10 mL 1,4-dioxane and a solution of 2.5 g LiOH (∼45 eq.) in 10 mL H2O was added. The mixture was stirred at 100 °C for 3 hours and neutralized with diluted HClaq.. During the neutralization, PDha precipitated. Yield: 97%.Nanoparticle coating
Size exclusion chromatography (SEC)
:4:2) at a flow rate of 1 mL min−1 on a PSS-SDV-linear M 5 μm column at 40 °C. The system was calibrated with PMMA (410–88000 Da) standards.Zeta-potential measurements
The zeta-potentials were measured on a ZetaSizer Nano ZS from Malvern via M3-PALS technique with a laser beam at 633 nm. The detection angle was 13°. The electrophoretic mobilities (u) were converted into zeta-potentials via the Henry equation in the Smoluchowski approximation, ζ = uη/ε0ε, where η denotes the viscosity and ε0ε the permittivity of the solution.Dynamic light scattering
Dynamic light scattering (DLS) measurements were performed using an ALV Laser CGS3 Goniometer equipped with a 633 nm HeNe Laser. DLS measurements were performed at 25 °C and at a detection angle of 90°. The CONTIN analysis of the obtained correlation functions was performed with the ALV 7002 FAST Correlator Software.Static light scattering
Static light scattering (SLS) measurements were performed using an ALV Laser CGS3 Goniometer equipped with a 633 nm HeNe Laser. PtBAMA184 was dissolved in methanol at five different concentrations (2, 3, 4, 5, 6 g L−1). The dn/dc (0.152 mL g−1) was measured on a Wyatt Technology Optilab-rEX Refractive Index Detector. SLS measurements were performed at 25 °C and at detection angles from 20° to 150° in 5° steps. The measured data was evaluated using a ZIMM plot.Vibrating sample magnetometry
VSM measurements were performed with a Micromag 3900, Princeton Measurement Corporation, at room temperature.Transmission electron microscopy (TEM)
For TEM from aqueous dispersions, copper grids were rendered hydrophilic by Ar plasma cleaning for 30 s (Diener Electronics). 15 μL of the respective sample dispersion were applied to the grid and excess sample was blotted with a filter paper. TEM images were acquired with a 200 kV FEI Tecnai G2 20 equipped with a 4k × 4k Eagle HS CCD and a 1k × 1k Olympus MegaView camera for overview images.UV-irradiation
UV-irradiations were carried out using a Hoehnle UVACUBE 100 equipped with a 250 W lamp.Ultrasonication
Ultrasonication was performed using an ElmaSonic S30H ultrasonic unit.TGA
TGA measurements were carried out from room temperature up to 800 °C under nitrogen with a Netzsch STA-449F1 device.In vitro viability assay
Cytotoxic effects were investigated using a cell culture-based viability assay as described previously.32 In brief, human brain microvascular endothelial cells (HBMEC) were cultured in RPMI 1640 supplemented with 10% fetal calf serum (FCS) at 37 °C and 5% CO2 in a humidified atmosphere. 45000 cells per cm2 were seeded into black-walled 96-well plates in quadruples and cultured overnight. Polyelectrolytes were added in concentrations as indicated; then, cell cultures were incubated for additional 3 h or 24 h, respectively. Polymer-associated effects on incubated cells were measured with the PrestoBlue Cell Viability Assay (Invitrogen, Darmstadt, Germany). There, in presence of viable metabolically active cells the virtually non-fluorescent resazurin is reduced to highly fluorescent resufurin. Fluorescence signals were detected and quantified using the plate-reader Infinite M200 PRO (TECAN, Crailsheim, Germany).
Acknowledgements
FHS, SD, AW, CG, JC and MvdL are grateful to the Deutsche Forschungsgemeinschaft (DFG, SPP1681, FKZ: SCHA1640/7-1, DU 1293/4-1, CL202/3-1) for financial support. We acknowledge Grit Festag for SEC analysis, and Antje Wehrmann for TGA measurements. The TEM facilities were funded by a grant of the DFG and EFRE (European Fund for Regional Development). FHS further thanks the Thuringian Ministry for Education, Science, and Culture (TMBWK, projects #B515-10065, ChaPoNano and #B514-09051, NanoConsens) for funding and Prof. Ulrich S. Schubert for continuous support.References
- P. Tartaj, M. d. P. Morales, S. Veintemillas-Verdaguer, T. González-Carreño and C. J. Serna, J. Phys. D: Appl. Phys., 2003, 36, R182–R197 CrossRef CAS.
- I. Coroiu, J. Magn. Magn. Mater., 1999, 201, 449–452 CrossRef CAS.
- W. H. Chiang, V. T. Ho, H. H. Chen, W. C. Huang, Y. F. Huang, S. C. Lin, C. S. Chern and H. C. Chiu, Langmuir, 2013, 29, 6434–6443 CrossRef CAS PubMed.
- W. C. Dewey, Int. J. Hyperthermia, 1994, 10, 457–483 CrossRef CAS.
- P. Wust, B. Hildebrandt, G. Sreenivasa, B. Rau, J. Gellermann, H. Riess, R. Felix and P. M. Schlag, Lancet Oncol., 2002, 3, 487–497 CrossRef CAS.
- R. K. Gilchrist, R. Medal, W. D. Shorey, R. C. Hanselman, J. C. Parrott and C. B. Taylor, Ann. Surg., 1957, 146, 506–606 CrossRef PubMed.
- S. Dutz and R. Hergt, Nanotechnology, 2014, 25, 452001 CrossRef PubMed.
- M. W. Freeman, A. Arrott and J. H. L. Watson, J. Appl. Phys., 1960, 31, 404–406 CrossRef PubMed.
- D. Schmaljohann, Adv. Drug Delivery Rev., 2006, 58, 1655–1670 CrossRef CAS PubMed.
- B. Mu, P. Liu, Y. Dong, C. Lu and X. Wu, J. Polym. Sci., Part A: Polym. Chem., 2010, 48, 3135–3144 CrossRef CAS.
- B. Mu, P. Liu, P. Du, Y. Dong and C. Lu, J. Polym. Sci., Part A: Polym. Chem., 2011, 49, 1969–1976 CrossRef CAS.
- J. Gao, H. Gu and B. Xu, Acc. Chem. Res., 2009, 42, 1097–1107 CrossRef CAS PubMed.
- K. Wormuth, J. Colloid Interface Sci., 2001, 241, 366–377 CrossRef CAS.
- X. Batlle and A. Labarta, J. Phys. D: Appl. Phys., 2002, 35, R15–R42 CrossRef CAS.
- J. Frenkel and J. Doefman, Nature, 1930, 126, 274–275 CrossRef.
- S. Tenzer, D. Docter, S. Rosfa, A. Wlodarski, J. Kuharev, A. Rekik, S. K. Knauer, C. Bantz, T. Nawroth, C. Bier, J. Sirirattanapan, W. Mann, L. Treuel, R. Zellner, M. Maskos, H. Schild and R. H. Stauber, ACS Nano, 2011, 5, 7155–7167 CrossRef CAS PubMed.
- M. Lundqvist, J. Stigler, G. Elia, I. Lynch, T. Cedervall and K. A. Dawson, Proc. Natl. Acad. Sci. U. S. A., 2008, 105, 14265–14270 CrossRef CAS PubMed.
- C. D. Walkey, J. B. Olsen, H. Guo, A. Emili and W. C. Chan, J. Am. Chem. Soc., 2012, 134, 2139–2147 CrossRef CAS PubMed.
- M. Mahmoudi, A. M. Abdelmonem, S. Behzadi, J. H. Clement, S. Dutz, M. R. Ejtehadi, R. Hartmann, K. Kantner, U. Linne, P. Maffre, S. Metzler, M. K. Moghadam, C. Pfeiffer, M. Rezaei, P. Ruiz-Lozano, V. Serpooshan, M. A. Shokrgozar, G. U. Nienhaus and W. J. Parak, ACS Nano, 2013, 7, 6555–6562 CrossRef CAS PubMed.
- D. Hühn, K. Kantner, C. Geidel, S. Brandholt, I. De Cock, S. J. H. Soenen, P. Rivera_Gil, J.-M. Montenegro, K. Braeckmans, K. Müllen, G. U. Nienhaus, M. Klapper and W. J. Parak, ACS Nano, 2013, 7, 3253–3263 CrossRef PubMed.
- G. Decher, Science, 1997, 277, 1232–1237 CrossRef CAS.
- X. Hong, J. Li, M. Wang, J. Xu, W. Guo, J. Li, Y. Bai and T. Li, Chem. Mater., 2004, 16, 4022–4027 CrossRef CAS.
- B. Sun, Y. Zhang, K. J. Gu, Q. D. Shen, Y. Yang and H. Song, Langmuir, 2009, 25, 5969–5973 CrossRef CAS PubMed.
- D. Yang, J. Ma, Q. Zhang, N. Li, J. Yang, P. A. Raju, M. Peng, Y. Luo, W. Hui, C. Chen and Y. Cui, Anal. Chem., 2013, 85, 6688–6695 CrossRef CAS PubMed.
- B. Mu, W. Zhong, Y. Dong, P. Du and P. Liu, J. Biomed. Mater. Res., Part B, 2012, 100, 825–831 CrossRef PubMed.
- J. Wotschadlo, T. Liebert, J. H. Clement, N. Anspach, S. Hoppener, T. Rudolph, R. Müller, F. H. Schacher, U. S. Schubert and T. Heinze, Macromol. Biosci., 2013, 13, 93–105 CrossRef CAS PubMed.
- J. Wotschadlo, T. Liebert, T. Heinze, K. Wagner, M. Schnabelrauch, S. Dutz, R. Müller, F. Steiniger, M. Schwalbe, T. C. Kroll, K. Höffken, N. Buske and J. H. Clement, J. Magn. Magn. Mater., 2009, 321, 1469–1473 CrossRef CAS PubMed.
- L. C. Fidale, M. Nikolajski, T. Rudolph, S. Dutz, F. H. Schacher and T. Heinze, J. Colloid Interface Sci., 2013, 390, 25–33 CrossRef CAS PubMed.
- A. Kaiser, S. Dutz and A. M. Schmidt, J. Polym. Sci., Part A: Polym. Chem., 2009, 47, 7012–7020 CrossRef CAS.
- U. Günther, L. V. Sigolaeva, D. V. Pergushov and F. H. Schacher, Macromol. Chem. Phys., 2013, 2202–2212 Search PubMed.
- S. Dutz, W. Andrä, R. Hergt, R. Müller, C. Oestreich, C. Schmidt, J. Töpfer, M. Zeisberger and M. E. Bellemann, J. Magn. Magn. Mater., 2007, 311, 51–54 CrossRef CAS PubMed.
- F. Bähring, F. Schlenk, J. Wotschadlo, N. Buske, T. Liebert, C. Bergemann, T. Heinze, A. Hochhaus, D. Fischer and J. H. Clement, IEEE Trans. Magn., 2013, 49, 383–388 CrossRef.
Footnote |
| † Electronic supplementary information (ESI) available. See DOI: 10.1039/c5ra01737h |
| This journal is © The Royal Society of Chemistry 2015 |