Improved oral bioavailability of novel antithrombotic S002-333 via chitosan coated liposomes: a pharmacokinetic assessment

Kiran Khandelwalae, Shakti Deep Pachauria, Abhishek Aryaad, Vivek K. Pawarad, Trapti Joshibe, Pankaj Dwivedia, Hafsa Ahmada, Bupendra Singha, Komal Sharmaad, Sanjeev Kanojiyab, Manish K. Chourasiaa, Anil Kumar Saxenac and Anil Kumar Dwivedi*a
aPharmaceutics Division, CSIR-Central Drug Research Institute, Sector 10, Janki Puram Extention, Sitapur Road, Lucknow, 226031, India. E-mail: anilcdri@gmail.com; renukadops@gmail.com; Tel: +91 9415910144
bSAIF Division, CSIR-Central Drug Research Institute, Lucknow, India
cMedicinal and Process Chemistry Division, CSIR-Central Drug Research Institute, Lucknow, India
dAcademy of Scientific & Innovative Research, New Delhi-110025, India
eJawaharlal Nehru University, New Delhi-110067, India

Received 26th January 2015 , Accepted 20th April 2015

First published on 23rd April 2015


Abstract

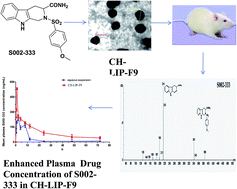
S002-333, a novel anti-thrombotic agent, exhibits excellent platelet mediated antithrombotic action and subsequently has no effect on the coagulation cascade. However, its oral bioavailability is hampered due to inherent low aqueous solubility. In order to circumvent this issue, chitosan coated liposomes were prepared by an ethanol injection method. S002-333 loaded liposomes (CH-LIP-F9) were reproduced with homogeneous particle sizes. The liposomal formulation was characterized with respect to size and surface morphology by transmission electron microscopy (TEM). The optimized formulation exhibited spherical shapes with a nano-metric size (249.64 ± 10.36 nm). The percentage entrapment efficiency (% EE) offered by the various developed formulations was found to be in the range between 72.36 ± 1.76 and 76.87 ± 2.32%. An in vitro release experiment demonstrated prolonged release of S002-333 from the optimized liposomal formulation. A cytotoxicity study represented that both blank liposomes (BLK-LIP) as well as the drug bearing liposomal formulation displayed negligible toxicity towards Caco-2 cells. The results of a pharmacokinetic study indicated that liposomal formulation significantly enhanced oral absorption of S002-333 in rats (AUC0–t; 7016.02 ± 128.96 h ng mL−1) compared to its aqueous suspension (AUC0–t; 2382.02 ± 77.17 h ng mL−1). These results together elicited that the developed liposomal formulation would improve preclinical and clinical application of S002-333.
1. Introduction

A clot or a thrombus is a consequence of an interruption to normal, smooth and efficient blood flow through our arteries and veins, which results in thrombosis. Diseases arising from clots in blood vessels include myocardial infarction, deep vein thrombosis, pulmonary embolism and stroke, annually affect millions of people worldwide and the leading causes of mortality and morbidity in the developed world.1,2 The current therapies available for venous and embolic thrombosis include anticoagulants such as warfarin and heparin, which are effective, but have a constricted therapeutic index.3,4 The use of anti-platelet agents; aspirin, ticlopidine, and clopidogrel do not work in acute conditions and require extended periods of strictly supervised therapy mainly because of the high risk of bleeding.4–6 In search for safe and effective antithrombotic agents, CSIR-Central Drug Research Institute, India have developed a new compound S002-333 that is chemically [2-(4-methoxy-benzenesulfonyl)-2,3,4,9-tetrahydro-1H-b-carboxylic acid amide] (Fig. 1).7–11 The S002-333 is practically insoluble in water and hexane, where as it is most soluble in acetone, acetonitrile and chloroform (>10 mg mL−1). The partition coefficient of S002-333 was determined between octanol and water (buffer pH = 7.4) and the information indicates that the compound under investigation is lipophilic in nature.
log[thin space (1/6-em)]P(octanol/water) = 3.63

log[thin space (1/6-em)]P(octanol/buffer) = 4.05

image file: c5ra01543j-f1.tif
Fig. 1 Structural representations of compound S002-333 and IS (methyl 2-(4-methoxy phenylsulfonyl)-2,3,4,9-tetrahydro-1H-pyrido[3,4-b]indole-3-carboxylate).

It is a novel anti-thrombotic agent that exhibits platelet mediated significant antithrombotic action, having no effect on coagulation cascade. A collagen mediated platelet activation (aggregation and adhesion) and release reaction is reduced by S002-333, which results in reduction in human platelet aggregation.11 The antithrombotic agent, S002-333 suffers from poor water solubility, thus presenting major hurdles in the dissolution leading to poor bioavailability.12

Liposomes are used for effective drug delivery as they enclose an aqueous solution within a membrane of phospholipids. Satisfactory encapsulation of the drug is an important advantage offered by the liposomal formulations which is the reason for its extensive use by the researchers.13–16 The liposomes due to their structural characteristics provided by amphipathic lipids, have also been widely investigated to entrap the lipophilic drug within the lipid bilayer.17,18 Few drugs that are successfully marketed as liposomal formulations include Sustiva® (efavirenz), Fortovase® (saquinavir), Norvir® (ritonavir), Lamprene® (clofazimine). Liposomes act as a solubilizing agent and they also protect the drug from degradation against different physiological environment in the body. Liposomal delivery of the drug can change the pharmacokinetic behavior and bioavailability resulting in better delivery at the intended site of action.19–21

Lipids have gained much attention as carriers for the delivery of small molecules with poor water solubility.22 Lipid complexes were also explored to siRNA delivery for gene silencing.23 The accessibility to novel lipid excipients with acceptable regulatory and safety profiles coupled with their ability to enhance oral bioavailability has helped in the development of lipid based formulations as a means for drug delivery. Lipid-based drug delivery (LBDD) systems have gained much importance due to their capability to improve the solubility and bioavailability of drugs with poor water solubility.24,25 A water-insoluble drug can be formulated as a lipid-based formulation when the drug's conventional formulation approaches do not enhance its oral bioavailability.19,25–27

The purpose of present study was to develop and optimize a liposomal formulation comprising S002-333 in order to improve its oral bioavailability. S002-333 loaded liposomes were prepared by ethanol injection method and characterized for various physicochemical parameters. A validated UPLC-MS/MS method was developed for the determination of S002-333 in rat plasma and its pharmacokinetic application was investigated.

2. Results

2.1. Preparation and characterization of liposomes bearing S002-333

Modified ethanol injection method was successfully employed to develop drug loaded liposomes and the method was found to be simple and highly reproducible.
2.1.1. Effect of cholesterol concentration. Various batches of liposomes were prepared using different concentration of cholesterol to find its effect on mean particles size, PDI and zeta potential. Results demonstrated that cholesterol has intense effect on the mean particle size of the liposomes (Table 1). When the amount of cholesterol was increased from 25 mg to 50 mg i.e.14.28% w/w to 25% w/w of total lipid mass, the mean particles size and PDI were reduced from 259.37 ± 14.37 to 164.34 ± 11.54 nm and 0.435 ± 0.096 to 0.127 ± 0.032, respectively. On the other hand, zeta potential of formulations was not much affected upon increase in the concentration of cholesterol.
Table 1 Physicochemical characterization of different batches of drug loaded liposomes
Formulation code Size (nm) ± S.D. PDI ± S.D. Zeta potential (mV) ± S.D. % entrapment efficiency
BLK-LIP-F1 259.37 ± 14.37 0.435 ± 0.096 −09.48 ± 1.83
BLK-LIP-F2 171.24 ± 06.92 0.155 ± 0.045 −13.67 ± 0.45
BLK-LIP-F3 164.34 ± 11.54 0.127 ± 0.032 −15.16 ± 2.34
CH-BLK-LIP-F4 183.84 ± 08.54 0.374 ± 0.092 09.56 ± 2.61
CH-BLK-LIP-F5 197.56 ± 11.36 0.427 ± 0.083 21.64 ± 1.84
CH-BLK-LIP-F6 214.21 ± 09.84 0.296 ± 0.028 33.57 ± 2.87
CH-BLK-LIP-F7 254.51 ± 13.61 0.381 ± 0.073 38.42 ± 3.27
CH-LIP-F8 236.81 ± 07.72 0.374 ± 0.076 31.73 ± 2.72 72.36 ± 1.76
CH-LIP-F9 249.64 ± 10.36 0.258 ± 0.035 29.34 ± 1.84 76.87 ± 2.32
CH-LIP-F10 297.42 ± 13.24 0.176 ± 0.069 18.79 ± 1.47 74.39 ± 1.98


2.1.2. Effect of chitosan concentration. Chitosan was found to have prominent effect on the particle size and zeta potential of the liposomes. Increased mean particles size and positive zeta potential of the coated liposomes suggested that chitosan was successful coated over the surface of the liposomes. The mean particle size of the liposomes was increased from 171.24 ± 06.92 nm to 249.64 ± 10.36 nm and the PDI was decreased from 0.155 ± 0.045 to 0.258 ± 0.035 whereas zeta potential was altered from −13.67 ± 0.45 mV to 29.34 ± 1.84 mV (CH-LIP-F9) when concentration of chitosan was increased from 0.1 to 1.2% w/v (Fig. 2).
image file: c5ra01543j-f2.tif
Fig. 2 Effect of chitosan concentration on the mean particle size and zeta potential of the liposomes.
2.1.3. Optimization of drug concentration. To optimize the drug concentration other formulation parameters such as concentration of lipid (cholesterol, egg phosphatidylcholine) and chitosan were kept constant and concentration of drug was varied to notice its effect on the particle size, zeta potential and entrapment efficiency. Table 1 is representing change in physicochemical parameters of the liposomes after drug loading. The mean particle size was increased and zeta potential was decreased upon increment in the concentration of the drug. The percent entrapment efficiency was found in the range between 72.36 ± 1.76% to 76.87 ± 2.32% for S002-333. On the basis of results of physicochemical parameters and drug entrapment efficiency, formulation CH-LIP-F9 was considered as optimized and utilized for further studies.

2.2. Characterization of S002-333 liposomes

2.2.1. Transmission electron microscope (TEM). The TEM image of developed formulation is represented in Fig. 3. CH-LIP-F9 has uniform spherical shape with smooth texture as shown in Fig. 3.
image file: c5ra01543j-f3.tif
Fig. 3 TEM image of the liposomal formulation CH-LIP-F9.
2.2.2. In vitro release profile of S002-333 liposomes. S002-333 release profile from its aqueous suspension and its liposomal formulation CH-LIP-F9 is summarized in Fig. 4. The rate of release of the drug candidate S002-333 from its liposomal formulation CH-LIP-F9 is prolonged as compared to its aqueous suspension in the same dissolution media.
image file: c5ra01543j-f4.tif
Fig. 4 In vitro release of S002-333 from CH-LIP-F9 and aqueous suspension; data are represented as mean ± S.D. (n = 3).
2.2.3. Cytotoxicity studies. The concentration dependent cytotoxicity (50, 100, 150 and 200 μg mL−1) of the formulations was determined by MTT assay.28,29 The cytotoxicity of the developed liposomes was comparable with free drug when tested against Caco-2 cell lines. The 50% cytotoxic concentration (CC50) of drug loaded liposomes was found to be 629.8 μM which is 1.51 fold higher in comparison to free drug (CC50: 417.1 μM). These results might be attributed to sustained release of drug in culture medium from the liposomal formulation. Basically the drug is entrapped within the liposomal bilayer network that acts as hindrance for free movement of drug. Since the entire amount of drug is available at a time it results in faster cell death leading to lower CC50 value for free drug. The blank liposomes exhibited almost negligible cytotoxicity (CC50: 1134 μM) proving the safety of the excipients used in the formulations. The cell viability of S002-333 loaded liposomes is represented in the Fig. 5.
image file: c5ra01543j-f5.tif
Fig. 5 Percent cell viability of pure drug candidate S002-333, blank liposomes and CH-LIP-F9 at different concentrations.

2.3. Chromatography

S002-333 is a lipophilic compound with poor solubility in water. The chromatographic conditions were optimized to obtain chromatograms with better peak shape within a short time. Different combination(s) of solvents were tried including acetonitrile or methanol as the organic component along with different buffers such as, formic acid, acetic acid and ammonium acetate with variable pH range to get suitable chromatographic resolution of S002-333 and IS. Studies were conducted with C8 and C18 columns of different dimensions to optimize the sensitivity, selectivity and resolution of the chromatographic method being developed. Finally, LC separation of S002-333 and IS was achieved on Thermo Accucore RP-MS (100 mm × 3 mm, 2.6 μm) with 0.01 M ammonium acetate–acetonitrile (50[thin space (1/6-em)]:[thin space (1/6-em)]50, v/v) as mobile phase with a flow rate of 0.5 mL min−1, thus enabling the determination of electrospray response.

2.4. Mass spectrometry

For the optimization ESI conditions for S002-333 and IS, scans (MS1) were performed in positive ion detection mode. In direct infusion studies the mass spectra for compound S002-333 and IS had shown peaks at m/z 386 and 401, respectively as [M + H]+. The product ion mass spectrum for S002-333 clearly shows (ESI Fig. 1) the formation of characteristic product ions at m/z 199, 214, 341, and 386. After thorough optimization of mass spectrometry conditions, the m/z 386 precursor ion to the m/z 214 was used for quantification for S002-333. In the same way, for IS m/z 401 precursor ion to the m/z 169 was used for quantification studies.

2.5. Recovery

The recovery of the compound S002-333 was evaluated by comparing the peak areas of the analytical samples with that of the plasma samples after extraction at concentration level 6.25, 50 and 200 ng mL−1. The mean recovery for compound S002-333 and IS was found to be 82.6% and 76.1%, respectively. The recovery of IS was determined at single concentration of 500 ng mL−1.

2.6. Stability

A series of stability tests were carried out on the known concentrations of compound S002-333 (6.25 and 200 ng mL−1) and the outcomes were in the acceptable limits throughout the experiment (Table 2).
Table 2 Stability of S002-333 in rat plasma
Nominal concentration (ng mL−1) Stability Mean ± S.D. Precision (%) Accuracy
6.25 0 h (for all) 5.96 ± 0.22 3.86 95.36
18 h (auto sampler) 5.89 ± 0.86 2.63 94.29
4 h (bench top) 5.86 ± 0.10 1.68 93.76
3rd freeze thaw 6.01 ± 0.17 2.78 96.16
15 days at −80 °C 5.98 ± 0.17 2.88 95.63
200 0 h (for all) 204.0 ± 5.57 2.73 102.0
18 h (auto sampler) 192.33 ± 3.21 1.67 96.17
4 h (bench top) 186.33 ± 3.79 2.03 93.17
3rd freeze thaw 190.33 ± 8.02 4.21 95.17
15 days at −80 °C 191.0 ± 6.08 3.18 95.50


2.7. Dilution integrity

Dilution integrity study was performed at six replicates by diluting two times with blank plasma and assay precision and accuracy were determined as mentioned in the experimental section. The % accuracy and precision observed for the concentrations for diluted QCs was 104.54 and 4.8% respectively. The outcome of the studies recommended that the samples where a concentration exceeded the upper limit of calibration curve could be analyzed by suitable dilution.

2.8. Pharmacokinetics

The blood concentration–time profile of liposomal formulation CH-LIP-F9 and its comparison with aqueous suspension of S002-333 is shown in Fig. 6. Data has been subjected to non-compartmental analysis. The area under curve (AUC) in case of CH-LIP-F9 (AUC0–t 7016.02 ± 128.96 h ng mL−1) and AUC0–∞ (8576.10 ± 158.33 h ng mL−1) was significantly higher (p < 0.05) than aqueous suspension of S002-333 (AUC0–t 2382.02 ± 77.17 h ng mL−1) and AUC0–∞ (2644.61 ± 82.20 h ng mL−1). t1/2 of CH-LIP-F9 was found to be 25.75 ± 0.58 h whereas S002-333 aqueous suspension has t1/2 of 17.83 ± 0.46 h. The Cmax of CH-LIP-F9 (531.55 ± 36.2 ng mL−1) was also higher than S002-333 aqueous suspension (241.39 ± 29.72 ng mL−1) whereas Tmax of CH-LIP-F9 and S002-333 aqueous suspension was 2.0 ± 0.74 h and 1.0 ± 0.23 h respectively. The pharmacokinetic parameters have been illustrated in Table 3.
image file: c5ra01543j-f6.tif
Fig. 6 Blood concentration–time profile of S002-333 from CH-LIP-F9 and aqueous suspension; data represented as mean ± S.D. (n = 3).
Table 3 Pharmacokinetic parameters of S002-333 from CH-LIP-F9 and aqueous suspension; data represented as mean ± S.D. (n = 3)
Pharmacokinetic parameter CH-LIP-F9 Aqueous suspension
t1/2 (h) 25.75 ± 4.58 17.83 ± 3.46
AUC0–t (h ng mL−1) 7016.02 ± 726.98 2382.02 ± 187.39
AUC0–∞ (h ng mL−1) 8576.10 ± 678.73 2644.61 ± 287.45
Cmax (ng mL−1) 531.55 ± 36.2 241.39 ± 29.72
Tmax (h) 1 ± 0.23 2 ± 0.74


3. Discussion

The oral route remains a preferred route for administration of drugs and delivery systems due to high patient compliance offered by it. The lipid based technologies especially liposomal formulations put forward a promising approach to deliver active molecules with poor water solubility and low bioavailability to the site of action and several such formulations are either introduced in the market or have entered the clinical testing stage.24 We have prepared the chitosan coated liposomes bearing novel S002-333 for the treatment of thrombosis via oral administration. S002-333 is a lipophilic drug candidate having inadequate physicochemical properties in terms of pharmaceutical acceptability such as poor aqueous solubility with consequent retardation of its oral bioavailability. Chitosan coated liposomes have been investigated to improve the aqueous solubility of S002-333 by diminishing its precipitation in the gastrointestinal fluid.

For the preparation of liposomes various methods are available in the literature including micro emulsification, sonication, membrane extrusion, lipid film hydration, French pressure cell, ethanol injection, and ether injection.19,24,30,31 We have opted for ethanol injection method for the preparation of liposomes based on its versatility and its suitability to be employed for large scale production which is an essential requirement for tapping into the commercial market. The method is cost effective and generates quality product acceptable by the regulatory authorities.20,30,32

The mean particle size and PDI of optimized liposomes were found to be 249.64 ± 10.36 nm and 0.258 ± 0.035, respectively which describes the deviation (smaller in our case) of the measured auto-correlation function from that of a dispersion of mono disperse spheres with the same diameter. The above facet provides large surface area exposing greater amount of S002-333 for absorption and thus, can improve its oral performance. The CH-LIP-F9 size has also been confirmed by TEM study.

Entrapment efficiency was found to improve with increase in the cholesterol content up to a considerable and optimum extent followed by decline. Rigidity of the bilayer membrane depends on the concentration of cholesterol and at lower concentration vesicles with leaky bilayer structure are produced with consequent lower entrapment. Increasing the concentration of cholesterol prevented leakage with subsequent high entrapment efficiency of S002-333. In vitro release study has demonstrated that the release of S002-333 from CH-LIP-F9 is prolonged which might enhance the solubility of drug and is also desirable to protect S002-333 from being degraded in the gastrointestinal tract.

Cytotoxicity studies depicted that blank liposomes exhibited almost negligible cytotoxicity exposing the safety profile of the excipients used in the formulations, whereas CC50 of drug loaded liposomes was found to be 1.51 fold higher in comparison to the free drug suggesting improved safety profile of S002-333 after being incorporated in liposomes.

During pharmacokinetic study in rats, protein precipitation method was used for the extraction of S002-333 from blood samples and the method proved to be robust. The mean recovery for compound S002-333 and IS was found to be 82.6% and 76.1%, respectively. UPLCMS/MS method was developed and validated for S002-333 to analyze it at low blood levels which aided in the evaluation of pharmacokinetic parameters. The AUC of CH-LIP-F9 was found to be higher in comparison to aqueous suspension of S002-333 indicating improved oral bioavailability of CH-LIP-F9.

AUC reflects the extent of drug absorption and is an important parameter for the comparative bioavailability studies. AUC of CH-LIP-F9 was 3.24 times more than that of S002-333 in aqueous suspension which might be due to the increased absorption of S002-333 in its liposomal form. The sustained drug release pattern and chitosan coating over lipid core also significantly enhanced the oral absorption of S002-333 from CH-LIP-F9 by improving the affinity between the particles and intestinal membrane.33–35 This improved oral bioavailability would present optimum amount of drug in systemic circulation which would contribute in the effective treatment of thrombus formation.

4. Materials and methods

4.1. Chemicals and reagents

S002-333 and methyl 2-(4-methoxyphenylsulfonyl)-2,3,4,9-tetrahydro-1H-pyrido[3,4-b]indole-3-carboxylate (IS) (Fig. 5f) were supplied by the Medicinal and Process Chemistry Division of our Institute. HPLC grade acetonitrile, ammonium acetate and glacial acetic acid (GAA) AR were purchased from E Merck Limited (Mumbai, India). HPLC grade methanol was purchased from Thomas Baker Pvt. Ltd (Mumbai, India). LIPOID E 80 S (egg phosphatidylcholine) was received as generous gift from Lipoid GmbH, Germany. Chitosan (low molecular weight), cholesterol and dextrose were purchased from Sigma-Aldrich (St. Louis, USA). Beparine, a heparin sodium injection I.P. with 25[thin space (1/6-em)]000 IU in 5 mL was obtained from Biological E. Limited (Hyderabad, India). Ethanol was purchased from Merck (India). Purified Millipore water used during the study was obtained from a Millipore Elix water purification system purchased from Millipore India Pvt. Ltd (New Delhi, India). Sprague Dawley rats were used for the study after the prior permission of Institutional Animal Ethics Committee. Blank plasma sample was collected from healthy male Sprague Dawley rats by centrifuging the heparinised blood (25 IU mL−1) at 2000 × g for 15 min at 20 °C.

4.2. Fabrication of liposomes

Chitosan coated liposomes were prepared by a two step process. Initially, ethanol injection method was employed to develop the drug loaded liposomes with slight modifications.20,31,32 Accurately weighed amount of egg phosphatidylcholine (LIPOID E 80 S), cholesterol and drug were dissolved in ethanol (3 mL) to prepare pro-liposome concentrate mixture. Subsequently, organic phase was heated up to 60 °C for 5 min and rapidly introduced into the 40 mL aqueous phase containing dextrose (5%) to instantly form drug loaded liposomes. In second step, chitosan coated liposomes were prepared by dissolving chitosan in 1% v/v acetic acid solution followed by dilution with acetate buffer to make different working concentrations of chitosan (0.1, 0.3, 0.6, and 1.2% w/v). Liposomes developed in previous step were incubated with chitosan solutions in equal volume up to 10 h for generation of chitosan coating over the liposomes. Finally, chitosan coated liposomes were recovered through ultracentrifugation (30[thin space (1/6-em)]000 × g). Various batches of liposomes were prepared in order to optimize the concentration of cholesterol, drug and chitosan (Table 4).
Table 4 Composition of different batches of liposomes
Formulation code LIPOID E 80 S (mg) Cholesterol (mg) S002-333 (mg) Chitosan (% w/v)
BLK-LIP-F1 150 25
BLK-LIP-F2 150 37.5
BLK-LIP-F3 150 50
CH-BLK-LIP-F4 150 37.5 0.1
CH-BLK-LIP-F5 150 37.5 0.3
CH-BLK-LIP-F6 150 37.5 0.6
CH-BLK-LIP-F7 150 37.5 1.2
CH-LIP-F8 150 37.5 10 0.6
CH-LIP-F9 150 37.5 20 0.6
CH-LIP-F10 150 37.5 30 0.6


4.3. Characterization of S002-333 liposomes

4.3.1. Particle size and zeta potential. Photon correlation spectroscopy was utilized to measure the particle size and polydispersity index (PDI) whereas a laser-based multiple angle particle electrophoresis was performed to assess the zeta potential of the developed liposomes. Samples were diluted with Milli-Q water prior to analysis. All the measurements were carried out in triplicate using a Nano-Zs zetasizer (Malvern Instruments, Malvern, UK) at 25 °C.
4.3.2. Transmission electron microscope (TEM). The S002-333 liposomes were further characterized with TEM studies. A drop of the fresh CH-LIP-F9 formulation was placed onto a carbon-coated copper grid, forming a thin liquid film. The film on the grid was negatively stained with drop of 1% (w/v) phosphotungstic acid. The excess staining solution was drained off with a filter paper followed by air drying. After drying the grid was placed in the machine, scanned in various zones and photographed.
4.3.3. % entrapment efficiency (% EE). For determination of entrapment efficiency, lyophilized liposomes (10 mg) were dissolved in 0.5 mL DMSO followed by centrifugation at 15[thin space (1/6-em)]000 × g and estimation of drug candidate S002-333 using a RP-HPLC method. Waters HPLC system (Milford, MA, USA) consisting of a Waters 515 pumps, a Waters pump-control module, a Waters 2707 Auto-sampler, a Waters 2998 photodiode array detector, Empower-2 software, and an online degasser was used in this study. HPLC was carried out on a C18 column (Lichrocart®, 250 × 4 mm, 5 μm, MERCK) using a mobile phase consisting of acetonitrile–0.1% acetic acid in water (60[thin space (1/6-em)]:[thin space (1/6-em)]40, v/v) at a flow rate of 1 mL min−1 and the elution was monitored by photo diode array detector at 225 nm. Mobile phase was duly filtered through 0.2 μm Millipore filter (Billerica, USA) and degassed ultrasonically for 15 min before use. The column oven temperature was maintained at 30 °C and injection volume was 20 μL.

The percent entrapment efficiency was calculated using the following formula:

Percent entrapment = [amount of drug in liposomes/total amount of drug added] × 100

4.3.4. In vitro release of S002-333 liposomes. The in vitro release of S002-333 from its aqueous suspension and the liposomal formulation CH-LIP-F9 was conducted using dialysis bag diffusion technique at 37 °C as described previously with minor modifications (Singodia et al., 2012). In vitro release studies were conducted in USP type II apparatus using phosphate buffer pH 6.8 containing Tween 80 (0.5%) and ethanol (10%) as dissolution medium. Optimized formulation (5 mg equivalent of S002-333) was filled into dialysis bag (Sigma, USA, MWCO: 12[thin space (1/6-em)]000) and suspended in 200 mL dissolution medium. Temperature was maintained at 37 °C at 50 rpm in dissolution apparatus. The samples were collected at different time durations viz. 0, 30 min, 1 h, 2 h, 3 h, 6 h, 8 h, 12 h, 24 h, 36 h, 48 h and 72 h. The release medium was exchanged with equal volume of fresh dissolution medium to maintain the complete sink condition. The concentration of released S002-333 was determined by HPLC as described previously.

4.4. Cytotoxicity studies

In vitro cytotoxicity of blank liposomes, free S002-333 and optimized formulation was studied using Caco-2 cells through a (3-(4,5-dimethylthiazol-2-yl)-2,5-diphenyl tetrazolium bromide) MTT assay. Caco-2 cells were maintained in sulforhodamine B growth medium supplemented with 10% heat inactivated in FBS, 2 mM L-glutamine, penicillin 100 U mL−1, streptomycin 100 μg mL−1. Cells were grown in incubator (5% CO2, 37 °C) for the stated length of time. Briefly, cells (4 × 10³ cells per well) were cultured in 96 wells plate and treated with free drug, blank formulation, and drug loaded liposomes at different equivalent concentrations of S002-333 up to 24 h. At the end of incubations, 10 μL of MTT (10 mg mL−1) was added to the wells and incubated for 3 h followed by addition of dimethyl sulfoxide (100 μL per well) to dissolve developed formazan crystals.36,37 Absorbance was recorded at 540 nm using Elisa Plate Reader. All the experiments were repeated at least thrice independently and the data reported in the manuscript represents mean values from three different experiments.

4.5. Instrumentation and chromatographic conditions

ACQUITY UPLC H-Class System (Waters Corporation, Milford, United States) was employed for analytical estimation of the samples. Chromatographic separation was achieved on a Thermo Accucore RP-MS (100 mm × 3 mm, 2.6 μm) using a mobile phase consisting of acetonitrile–0.01 M ammonium acetate buffer (50[thin space (1/6-em)]:[thin space (1/6-em)]50, v/v) at a flow rate of 0.5 mL min−1. Mobile phase was duly filtered through 0.22 μm Millipore filter (Billerica, USA) and degassed ultrasonically for 15 min before putting into the system. The column temperature was maintained at 30 °C using a column oven and injection volume was 10 μL.

Mass spectrometric detection was performed on a ACQUITY UPLC TQD bench-top, ultra-compact, tandem quadrupole, mass detector-based system (Waters corporation, Milford, USA) equipped with an API electro spray ionization (ESI) source. The ion spray voltage was set at 5500 V. The instrument parameters viz., nebulizer gas, curtain gas, auxillary gas and collision gas were set at 50, 35, 45 and 12, respectively. Compounds parameters viz. capillary voltage (CPV), cone voltage (CV) and collision energy (CE) were 3.5 kV, 25 V, 12 V and 3.5 kV, 30 V, 20 V for S002-333 and internal standard (IS), respectively. Zero air was used as source gas while nitrogen was used as both curtain and collision gas. The mass spectrometer was operated at ESI positive ion mode and detection of the ions was performed in the multiple reaction monitoring (MRM) mode, monitoring the transition of m/z 386.0 precursor ion [M + H]+ to the m/z 214.0 product ion for S002-333 and m/z 401.0 precursor ion [M + H]+ to the m/z 169.0 product ion for IS. Quadrupoles Q1 and Q3 were set on unit resolution. Data acquisition and quantitation were performed using MassLynx 4.1 SCN 714 software (Waters, Milford, MA, USA).

4.6. Preparation of stock and standard solutions

The primary stock solutions of S002-333 and IS were prepared by dissolving the compounds in acetonitrile to achieve concentration of 1 mg mL−1 for both the solutions. These solutions were further diluted with the mobile phase to achieve suitable dilution as working stock solutions (8, 2, 0.5, 0.25, 0.0625 and 0.0312 μg mL−1) and resultant solutions were used to prepare dilutions for the calibration curve (CC). An additional set of working stock solutions of compound S002-333 with concentrations 4, 1, 0.125 and 0.025 μg mL−1 were made for the preparation of quality control (QC) samples. Individually QC and CC working stock solutions of S002-333 were spiked into blank plasma to prepare QC and CC samples. The concentration of the working stock of IS was 10 μg mL−1 prepared in acetonitrile. On the day of analysis the calibration standards were prepared by spiking 190 μL of rat plasma with the suitable working stock solution of S002-333 (10 μL) and IS (10 μL). QC samples were prepared by spiking rat plasma at four concentration levels [1.25 ng mL−1 (lower limit of quantitation, LLOQ), 6.25 ng mL−1 (QC low), 50 ng mL−1 (QC medium) and 200 ng mL−1 (QC high)] and stored at −80 ± 10 °C until analysis.

4.7. Sample preparation

For the extraction of S002-333 from rat plasma, simple protein precipitation method was used. The samples were analyzed after thawing the frozen samples and allowed to equilibrate at room temperature. To an aliquot of 200 μL of spiked plasma sample; 10 μL internal standard (10 μg mL−1) was added and vortexed for 20 s. The plasma proteins were precipitated by adding 800 μL of acetonitrile. The mixture was then vortexed for 2 min, followed by centrifugation at 3000 × g for 5 min at 4 °C on Sigma 3–18 K (Frankfurt, Germany). The supernatant was transferred to a clean test tube, dried and finally reconstituted with 200 μL of mobile phase. The reconstituted solution was transferred to an auto-sampler vial and 10 μL was injected into UPLC-MS/MS.

4.8. Recovery

The recovery of compound S002-333 and IS was accessed by comparing the responses of the analytes extracted from QC of the samples (spiked blank plasma) with the response of analytes of the analytical standards (n = 6).38–40 Recoveries of S002-333 were evaluated at QC low, QC medium and QC high concentrations, viz., 6.25, 50 and 200 ng mL−1 whereas the recovery of the IS was accessed at a concentration of 500 ng mL−1.

4.9. Stability experiments

The stability experiments were performed at two concentration levels (QC low and QC high) with six replicates at each concentration. The peak areas of analyte and IS during first cycle were used as the reference to establish the stability at consequent points. Replicate of the processed samples were analyzed up to 18 h to ascertain auto-sampler stability of analyte.

Freeze thaw stability was assessed up to three cycles. For each cycle, samples were frozen for 12 h at −80 ± 10 °C. The (bench top) stability of S002-333 in the biological matrix was determined by exposing the drug candidate to rat plasma for a period of 4 h at ambient temperature (25 ± 2 °C). Freezer stability of S002-333 in rat plasma was evaluated by analyzing the QC samples stored at −80 ± 10 °C for at least 15 days. Samples were considered to be stable if assay values were within the acceptable limits of accuracy (i.e., ±15% S.D.) and precision (i.e., ±15% R.S.D.).

4.10. Dilution integrity

Dilution of biological matrix becomes essential where concentration of some samples in the experiment may be higher than the upper limit of quantitation (400 ng mL−1). These dilution studies were performed on plasma sample whereas concentration 400 ng mL−1 of S002-333 was diluted two times with blank plasma to obtain samples with concentration 200 ng mL−1 of the compound S002-333.

4.11. Application to a pharmacokinetic study in rats

In vivo oral pharmacokinetic study was carried out in male Sprague-Dawley rats (weight range 180–200 g) to put on display the purpose of the developed and validated bio-analytical method as well as to evaluate the efficiency of the developed liposomal formulation. Optimized liposomal formulation and S002-333 in 0.25% sodium carboxymethyl cellulose (CMC) suspension were administered orally at an equivalent dose of 20 mg kg−1. The blood samples from SD rats were taken through its retro-orbital plexus under light anesthesia into micro centrifuge tubes containing heparin at 0.25, 0.5, 1, 2, 4, 8, 12, 24, 48 and 72 h after the oral dosing.

Plasma was collected by centrifuging the blood at 2000 × g for 15 min at 4 °C and stored frozen at −80 ± 10 °C until analysis. Rat plasma (200 μL) samples were spiked with IS and further processing was done as mentioned in section 2.4 and data was accepted as per FDA guidelines for bio-analytical method validation. Plasma concentration–time data of S002-333 in its liposomal formulation and aqueous suspension were analyzed by non-compartmental method using WinNonlin Version 5.1 (Pharsight Corporation, Mountain View, USA).

5. Conclusions

To the best of our information, this is a first report on the liposomal formulation of the candidate drug S002-333. The liposomal formulation CH-LIP-F9 was well characterized and evaluated for its efficacy. UPLC-MS/MS method developed for the quantification of S002-333 was reproducible, simple, specific and sensitive. The method developed and validated has an advantage that it requires small volumes of rat plasma along with its short time of analysis. The method is economical, simple and time saving, thus suitable for pharmacokinetics and preclinical studies. UPLC-MS/MS assay method was effectively applied to a pharmacokinetic study performed on oral administration of S002-333 in rats both in aqueous suspension as well as liposomal formulation. The current liposomal formulation CH-LIP-F9 has offered significant improvement in plasma drug concentration in comparison to the native drug candidate S002-333 in aqueous suspension, and therefore this formulation technique could be used to reduce the therapeutic dose of drug to be administered.

6. Ethical statement

Rats were obtained from CSIR-CDRI Lucknow, India. The animal experiments have been carried out by following experimental protocol guidelines of Council for the Purpose of Control and Supervision of Experiments on Animals (CPCSEA), Ministry of Social Justice and Empowerment, Government of India. Experiments were conducted after ethical clearance by the Institutional Animal Ethics Committee of the institute (CPCSEA Registration no.: 34/1999 dated 11.3.99) dated on 13.11.13.

Conflict of interest

The authors declare they have no competing financial interest.

Acknowledgements

Financial support to Kiran Khandelwal, Shakti Deep Pachauri and Abhishek Arya from Council of Scientific and Industrial Research (CSIR) New Delhi, India, are gratefully acknowledged. CDRI Communication no. 8979.

References

  1. P. A. Beere, S. Glagov and C. K. Zarins, Arterioscler. Thromb., 1992, 12, 1245–1253 CrossRef CAS.
  2. J. K. Mishra, K. Samanta, M. Jain, M. Dikshit and G. Panda, Bioorg. Med. Chem. Lett., 2010, 20, 244–247 CrossRef CAS PubMed.
  3. P. C. Wong, M. L. Quan, E. J. Crain, C. A. Watson, R. R. Wexler and R. M. Knabb, J. Pharmacol. Exp. Ther., 2000, 292, 351–357 CAS.
  4. C. Chi, L. Liang, P. Padovani and S. Unger, J. Chromatogr. B: Anal. Technol. Biomed. Life Sci., 2003, 783, 163–172 CrossRef CAS.
  5. K. V. Sashidhara, A. Kumar, M. Kumar, S. Singh, M. Jain and M. Dikshit, Bioorg. Med. Chem. Lett., 2011, 21, 7034–7040 CrossRef CAS PubMed.
  6. K. V. Sashidhara, G. R. Palnati, S. R. Avula, S. Singh, M. Jain and M. Dikshit, Bioorg. Med. Chem. Lett., 2012, 22, 3115–3121 CrossRef CAS PubMed.
  7. S. Gaur, Z. Fatima, A. Dixit, Z. Ali, W. R. S. Surin, K. Kapoor, K. Bhutani, M. S. Ansari, M. Dikshit and A. K. Saxena, WO/2006/070385, 2006.
  8. A. Saxena, G. K. Jain, H. H. Siddiqui, S. S. Bhunia, A. K. Saxena and J. R. Gayen, Xenobiotica, 2013, 1–14 CAS.
  9. R. Bhatta, Y. Chhonker, D. Kumar, A. Saxena and G. Jain, Med. Chem. Res., 2011, 20, 1581–1588 CrossRef CAS.
  10. T. Balganesh, T. K. Kundu, T. K. Chakraborty and S. Roy, ACS Med. Chem. Lett., 2014, 5(7), 724–726 CrossRef CAS PubMed.
  11. R. S. Bhatta, D. Kumar, Y. S. Chhonker, A. K. Saxena and G. K. Jain, Biomed. Chromatogr., 2010, 24, 1234–1239 CrossRef CAS PubMed.
  12. C. W. Pouton, Eur. J. Pharm. Sci., 2006, 29, 278–287 CrossRef CAS PubMed.
  13. T. Nii and F. Ishii, Int. J. Pharm., 2005, 298, 198–205 CrossRef CAS PubMed.
  14. R. M. Mainardes and L. P. Silva, Curr. Drug Targets, 2004, 5, 449–455 CrossRef CAS.
  15. B. Heurtault, P. Saulnier, B. Pech, M.-C. Venier-Julienne, J.-E. Proust, R. Phan-Tan-Luu and J.-P. Benoît, Eur. J. Pharm. Sci., 2003, 18, 55–61 CrossRef CAS.
  16. A. Sharma and U. S. Sharma, Int. J. Pharm., 1997, 154, 123–140 CrossRef CAS.
  17. Y. Barenholz, J. Liposome Res., 2003, 13, 1–8 CrossRef CAS PubMed.
  18. M. Ciobanu, B. Heurtault, P. Schultz, C. Ruhlmann, C. Muller and B. Frisch, Int. J. Pharm., 2007, 344, 154–157 CrossRef CAS PubMed.
  19. D. J. Hauss, Oral lipid-based formulations: enhancing the bioavailability of poorly water-soluble drugs, CRC Press, 2013 Search PubMed.
  20. D. Singodia, A. Verma, P. Khare, A. Dube, K. Mitra and P. R. Mishra, J. Liposome Res., 2012, 22, 8–17 CrossRef CAS PubMed.
  21. P. K. Dubey, D. Singodia and S. Vyas, J. Drug Targeting, 2010, 18, 373–380 CrossRef CAS PubMed.
  22. T. M. Allen, Drugs, 1998, 56, 747–756 CrossRef CAS PubMed.
  23. L. Gu, L. M. Nusblat, N. Tishbi, S. C. Noble, C. M. Pinson, E. Mintzer, C. M. Roth and K. E. Uhrich, J. Controlled Release, 2014, 184, 28–35 CrossRef CAS PubMed.
  24. S. Kalepu, M. Manthina and V. Padavala, Acta Pharm. Sin. B, 2013, 3, 361–372 CrossRef PubMed.
  25. C.-M. Chiang and N. Weiner, Int. J. Pharm., 1987, 40, 143–150 CrossRef CAS.
  26. M. Manconi, A. Nácher, V. Merino, M. Merino-Sanjuan, M. L. Manca, C. Mura, S. Mura, A. M. Fadda and O. Diez-Sales, AAPS PharmSciTech, 2013, 1–12 Search PubMed.
  27. P. Dwivedi, R. Khatik, K. Khandelwal, R. Srivastava, I. Taneja, K. S. R. Raju, H. Dwivedi, P. Shukla, P. K. Gupta and S. Singh, RSC Adv., 2014, 4(110), 64905–64918 CAS.
  28. M. He, Z. Zhao, L. Yin, C. Tang and C. Yin, Int. J. Pharm., 2009, 373, 165–173 CrossRef CAS PubMed.
  29. R. Khatik, R. Mishra, A. Verma, P. Dwivedi, V. Kumar, V. Gupta, S. K. Paliwal, P. R. Mishra and A. K. Dwivedi, J. Nanopart. Res., 2013, 15, 1–15 CrossRef.
  30. A. Wagner and K. Vorauer-Uhl, J. Drug Delivery, 2011, 591325 Search PubMed.
  31. A. Akbarzadeh, R. Rezaei-Sadabady, S. Davaran, S. W. Joo, N. Zarghami, Y. Hanifehpour, M. Samiei, M. Kouhi and K. Nejati-Koshki, Nanoscale Res. Lett., 2013, 8, 1–9 CrossRef PubMed.
  32. D. Singodia, A. Verma, R. K. Verma and P. R. Mishra, Nanomedicine: Nanotechnology, Biology and Medicine, 2012, 8, 468–477 CrossRef CAS PubMed.
  33. Z. Wu, Q. Ping, Y. Wei and J. Lai, Acta Pharmacol. Sin., 2004, 25, 966–972 CAS.
  34. V. P. Torchilin, Nat. Rev. Drug Discovery, 2005, 4, 145–160 CrossRef CAS PubMed.
  35. P. Dwivedi, R. Khatik, K. Khandelwal, I. Taneja, K. S. R. Raju, S. K. Paliwal, A. K. Dwivedi and P. R. Mishra, Int. J. Pharm., 2014, 466, 321–327 CrossRef CAS PubMed.
  36. P. Dwivedi, S. Kansal, M. Sharma, R. Shukla, A. Verma, P. Shukla, P. Tripathi, P. Gupta, D. Saini and K. Khandelwal, J. Drug Targeting, 2012, 20, 883–896 CrossRef CAS PubMed.
  37. S. K. Sahoo, W. Ma and V. Labhasetwar, Int. J. Cancer, 2004, 112, 335–340 CrossRef CAS PubMed.
  38. R. Dams, M. A. Huestis, W. E. Lambert and C. M. Murphy, J. Am. Soc. Mass Spectrom., 2003, 14, 1290–1294 CrossRef CAS.
  39. C. FDA, 2001.
  40. M. Wahajuddin, S. P. Singh and G. K. Jain, J. Chromatogr. B: Anal. Technol. Biomed. Life Sci., 2009, 877, 1133–1139 CrossRef PubMed.

Footnote

Electronic supplementary information (ESI) available. See DOI: 10.1039/c5ra01543j

This journal is © The Royal Society of Chemistry 2015