Enhanced fast charge–discharge performance of Li4Ti5O12 as anode materials for lithium-ion batteries by Ce and CeO2 modification using a facile method

Ting-Feng Yi*a, Jin-Zhu Wua, Mei Lia, Yan-Rong Zhua, Ying Xie*b and Rong-Sun Zhua
aSchool of Chemistry and Chemical Engineering, Anhui University of Technology, Maanshan, Anhui 243002, PR China. E-mail: tfyihit@163.com; Fax: +86-555-2311552; Tel: +86-555-2311807
bKey Laboratory of Functional Inorganic Material Chemistry, Ministry of Education, School of Chemistry and Materials Science, Heilongjiang University, Harbin 150080, PR China. E-mail: xieying@hlju.edu.cn

Received 10th January 2015 , Accepted 7th April 2015

First published on 7th April 2015


Abstract

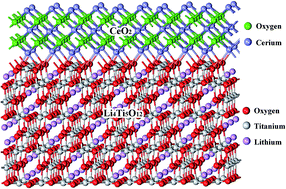
A facile solid-state method to improve the fast charge–discharge and kinetic performance of Li4Ti5O12 in lithium-ion batteries by Ce and CeO2 in situ modification is presented in this work. XRD shows that the Ce doping and CeO2 modification do not change the spinel structure of Li4Ti5O12. Little Ce doping (Ti/Ce = 4.9[thin space (1/6-em)]:[thin space (1/6-em)]0.1 and Ti/Ce = 4.85[thin space (1/6-em)]:[thin space (1/6-em)]0.15) reduces the lattice parameter of doped Li4Ti5O12, but more Ce4+ doping (Ti/Ce = 4.8[thin space (1/6-em)]:[thin space (1/6-em)]0.2) increases the lattice parameter due to the large ionic radius of Ce4+. Raman spectra reveal that CeO2 is not completely incorporated into the host structure and leads to the formation of a uniform coating on the surface of Li4Ti5O12. The doping of Ce4+ and the combination with in situ generated CeO2 in Li4Ti5O12 are favorable for reducing the electrode polarization and charge-transfer resistance and improve the lithium insertion/extraction kinetics of Li4Ti5O12, resulting in its relatively higher capacity at a high charge–discharge rate. The Ce-doped Li4Ti5O12–CeO2 composites show a much improved rate capability and cycling stability compared with pristine Li4Ti5O12 at a 10 C charge–discharge rate in a broad voltage window (0–2.5 V). The introduction of Ce and CeO2 enhances not only the electric conductivity of Li4Ti5O12, but also the lithium ion diffusivity in Li4Ti5O12, resulting in a significantly improved high-rate capability, cycling stability, and fast charge–discharge performance of Li4Ti5O12.


1. Introduction

Lithium-ion batteries have been considered as one of the most promising power batteries for electric vehicles (EVs) and hybrid electric vehicles (HEVs) due to their high energy density. However, safety is the essential criterion to evaluate if an LIB can be applied to these vehicles.1 At fast discharge rates, the anode potential drops to such a degree that dendritic lithium may deposit over the anode surface, which then causes safety issues. However, the batteries used in EVs and HEVs are required to be charged–discharged continually at high rates, which then causes serious safety issues. Spinel lithium titanate (Li4Ti5O12) has received considerable attention as a potential candidate for lithium-ion batteries due to its high lithium ion insertion potential at around 1.55 V (vs. Li/Li+), and excellent structural and thermodynamic stability during cycling.2 These indicate that Li4Ti5O12 used as an anode in high power lithium ion batteries is safe, long-living and reliable. Unfortunately, the low electronic conductivity (ca. 10−13 S cm−1) and lithium diffusion coefficient (ca. 10−9 to 10−13 cm2 s−1) result in the poor performance of Li4Ti5O12 materials, preventing them from being widely used.3 In order to overcome the kinetic problems of Li4Ti5O12, several methods have been developed. These include the preparation of nano-Li4Ti5O12 particles,4,5 doping Li4Ti5O12 with metal and non-metal ions (Na+,6 Mg2+,7 Zn2+,8 Ca2+,9 Al3+,10 La3+,11 Zr4+,12 Ru4+,13 V5+,14 Ta5+,15 W6+,16 F,17 and Br (ref. 18)) in the Li, Ti or O sites, and surface modification via coating with a conductive second phase including Ag,19 Au,20 carbon,21 graphene,22 polyacene (PAS),23 TiN,24 ZrO2,25 and TiO2 (ref. 26) etc. However, nanomaterial or carbon coating frequently results in a low volumetric energy density of the cell. Surface coating with a conductive second phase can increase the electronic conductivity of Li4Ti5O12, but the ionic conductivity is difficult to improve. It has been reported that ceria (CeO2) can produce a good electrical contact between oxides which facilitates the electron transfer between CeO2 and the supported metal oxide.27 CeO2 with good electrical conductivity has already been used as a coating material for improving the electrochemical performance of cathode materials, such as in LiMn2O4,28 LiFePO4,29 LiCo1/3Ni1/3Mn1/3O2,30 and Li-rich electrodes31 due to the direct and fast transformation between Ce(III) and Ce(IV). Yang et al.32 reported the electrochemical performance of CeO2-coated Li4Ti5O12 between 1 and 3 V synthesized by a one-pot co-precipitation method using tetrabutyl titanate as the raw material. However, this is difficult for commercial applications because of its relatively high synthetic cost. From a commercial viewpoint, the solid-state synthesis of Li4Ti5O12 powders exhibits a potential commercial application due to the simple synthesis route and low synthesis cost. In addition, a uniform surface coating around the whole Li4Ti5O12 particles is also obviously difficult to achieve. Compared with traditional structures, this unique inlaid architecture of Ce-doped Li4Ti5O12–CeO2 can enhance the lithium ion diffusion ability and conductivity of composites, and inherits the advantages of CeO2 coating and doping. It is well known that a high energy density of a battery results from a high voltage or high capacity. According to a previous report,33 Li4Ti5O12 can be lithiated to the state Li8.5Ti5O12 (discharged to 0 V), and can then provide a theoretical capacity of 260 mA h g−1 by means of first-principles calculations, which is about 1.5 times higher than that of the compound lithiated to Li7Ti5O12. In addition, considering the safety because of the risk of explosion from a possible inner short circuit of the lithium-ion battery, it is important to study the over-discharge behaviors of anode materials at a lower voltage.34 To the best of our knowledge, however, there have been no reports on the fast charge–discharge performance of Ce-doped Li4Ti5O12–CeO2 composites in a broad voltage window. In this paper, Ce-doped Li4Ti5O12–CeO2 composites as anode materials were synthesized by a facile solid-state reaction, and the composites show significantly improved fast charge–discharged performances.

2. Experimental

2.1 Materials preparation

Li4Ti5O12 and the Ce-doped Li4Ti5O12–CeO2 composites were synthesized by a solid-state method. Li2CO3, anatase-phase TiO2 and Ce(NO3)3·6H2O were used as the starting materials at a Li[thin space (1/6-em)]:[thin space (1/6-em)](Ti + Ce) molar ratio of 4.3[thin space (1/6-em)]:[thin space (1/6-em)]5. Excessive Li (5 wt%) was provided to compensate for the volatilization of Li during the synthesis. The molar ratios of Ti[thin space (1/6-em)]:[thin space (1/6-em)]Ce are 4.9[thin space (1/6-em)]:[thin space (1/6-em)]0.1, 4.85[thin space (1/6-em)]:[thin space (1/6-em)]0.15, and 4.8[thin space (1/6-em)]:[thin space (1/6-em)]0.2, respectively. The overall fabrication procedures of all samples are schematically illustrated in Fig. 1. All raw materials are mixed and ball-milled. The high-energy ball-milling processes were carried out at a constant speed of 400 rpm and a processing time of 3 h. Following the ball-milling process, the remaining alcohol medium was evaporated and the obtained powders were subsequently dried at 120 °C for 8 hours in an air atmosphere. The mixed raw materials were calcined at 450 °C for 6 h in a flowing air atmosphere to obtain the precursor. Then, the precursor was ball-milled with alcohol as the medium for about 3 hours. Finally, the precursors were calcined at 850 °C for 20 h in a flowing air atmosphere to obtain Li4Ti5O12 and the Ce-doped Li4Ti5O12–CeO2 composites. After cooling, all samples were ball-milled with alcohol as the medium for about 30 minutes to form the final products.
image file: c5ra00523j-f1.tif
Fig. 1 Fabrication procedures of Li4Ti5O12 and Ce-doped Li4Ti5O12–CeO2 samples in this study.

2.2 Battery preparation

A CR2025 coin-cell assembly was used for the electrochemical characterization. A slurry was formed by mixing the active material (80%), super P conductive carbon (10%), and the binder (10 wt% polyvinylidene fluoride, dissolved in N-methyl-2-pyrrolidone). After coating onto the Cu foil, the film was dried in a vacuum oven at 110 °C for 10 h and then cut into discs with a radius of 7 mm. The half-cells were assembled with the active material and a metallic lithium anode separated by a porous polypropylene film (Celgard 2300) filled with a 1 M LiPF6 in ethylene carbonate/dimethyl carbonate (1[thin space (1/6-em)]:[thin space (1/6-em)]1 by vol) solution.

2.3 Materials characterization and electrochemical tests

X-ray diffractometry (XRD) measurements were performed on a Rigaku instrument with Cu Kα radiation. Particle sizes, morphologies and microstructures were examined using scanning electron microscopy (SEM, SU8000). Raman measurements were performed on a SPEX-1403 Raman spectrometer. The laser light source was the 488 nm line of an Art laser excited at 400 mW. Cyclic voltammetry (CV) tests were carried out on a CHI 1000C electrochemical workstation with a voltage between 0 and 2.5 V at a scanning rate of 0.2 mV s−1. Electrochemical impedance spectroscopy (EIS) is measured by a Princeton P4000 electrochemical working station over a frequency range from 0.01 Hz to 10 kHz at a potentiostatic signal amplitude of 5 mV. The charge–discharge measurements were recorded on a multichannel Land Battery Test System (Wuhan Jinnuo, China) at room temperature in the 0.0–2.5 V (vs. Li/Li+) range carried out at different charge–discharge rates.

3. Results and discussion

Fig. 2 shows X-ray diffraction patterns of pristine Li4Ti5O12 and the Ce-doped Li4Ti5O12–CeO2 composites. No impurities were observed for pristine Li4Ti5O12. All the sharp diffraction peaks can be attributed to the cubic spinel structure of Li4Ti5O12. This indicates that the Ce doping and CeO2 modification do not change the spinel structure of Li4Ti5O12. However, a few impurity peaks can be observed in the XRD patterns of modified Li4Ti5O12, as shown in Fig. 2(b–d), and these can be ascribed to CeO2. In addition, with the increase in CeO2 additive, the peak intensity of CeO2 is enhanced correspondingly. Interestingly, there is a slight shift of the diffraction to higher diffraction angles for the Ce-doped Li4Ti5O12–CeO2 composites with Ti/Ce = 4.9[thin space (1/6-em)]:[thin space (1/6-em)]0.1 and Ti/Ce = 4.85[thin space (1/6-em)]:[thin space (1/6-em)]0.15, revealing that a few cerium ions can substitute titanium ions in the octahedron 16d site, and then reduce the lattice parameter of doped Li4Ti5O12. The reason may be that the bond strength of Ce–O is larger than that of Ti–O, so it has higher octahedral site preference energies (OPE) which results in the diminution of the bond length. However, with the increase in CeO2 additive, a slight shift of the diffraction to lower diffraction angles can be found for the Ce-doped Li4Ti5O12–CeO2 composites with Ti/Ce = 4.8[thin space (1/6-em)]:[thin space (1/6-em)]0.2. The reason may be due to the difference in the ionic radius between Ce4+ (0.87 Å)35 and Ti4+(0.605 Å), indicating that more cerium ions enter the crystal lattice. In this work, the Ce-doped Li4Ti5O12–CeO2 composites are prepared at 850 °C for 20 h in a flowing air atmosphere. Ce(NO3)3·6H2O can be decomposed into CeO2 at such a high temperature (850 °C) and long sintering time (20 h) in an air atmosphere. The decomposition process is described in eqn (1) and (2):
 
image file: c5ra00523j-t1.tif(1)
 
image file: c5ra00523j-t2.tif(2)

image file: c5ra00523j-f2.tif
Fig. 2 XRD patterns of the as-prepared of Li4Ti5O12 and Ce-doped Li4Ti5O12–CeO2 samples with different molar ratios between Ti and Ce: (a) Ti/Ce = 5[thin space (1/6-em)]:[thin space (1/6-em)]0, (b) Ti/Ce = 4.9[thin space (1/6-em)]:[thin space (1/6-em)]0.1, (c) Ti/Ce = 4.85[thin space (1/6-em)]:[thin space (1/6-em)]0.15, and (d) Ti/Ce = 4.8[thin space (1/6-em)]:[thin space (1/6-em)]0.2.

Hence, it can be confirmed that the main valence state of Ce is +4 in the Ti-based and Ce-based oxides. However, it is well known that CeO2 is a good oxygen storage material based on a reversible redox reaction as follows:

 
CeO2 ⇌ CeO2−x + 0.5xO2 (3)

Hence, it can be confirmed that the valence states of Ce are +4 and +3 in the Ti-based and Ce-based oxides. This phenomenon may be compared to a CeO2-coated Li(Li0.17Ni0.2Co0.05Mn0.58)O2 cathode.31

There are three possible doping sites in a Ce-doped Li4Ti5O12 crystal (Li site, Ti site, or both Li and Ti sites). The determination of the locations of the Li+ ions in transition metal oxides is usually very difficult to study by XRD alone because the atomic scattering factor of the lithium ion is very small.36 However, the location of the lithium ions at the tetrahedral (8a) or octahedral (16c) sites reflects upon the XRD intensities in the pattern especially for the (3 1 1) and (4 0 0) lines.37 As we know, the structural cation distribution of Li4Ti5O12 can be shown as [Li3]8a[LiTi4]16d[O12]32e. The Li ions sit in the tetrahedral and octahedral sites, and Ti only takes up octahedral sites. According to Ohzuku et al.,38 the integrated intensity ratios of the (3 1 1)/(4 0 0) and (2 2 0)/(3 1 1) peaks are indices of the extent of occupancy of the substituent ions in the 8a lithium sites. The (220) (at 2θ ≈ 30°) peaks cannot be found in the XRD patterns of Li4Ti5O12 and the Ce-doped Li4Ti5O12–CeO2 composites, indicating that there are no heavy cations (Ti4+ or Ce4+) in the tetrahedral 8a sites of the spinel-type structure.39 The relative intensity ratios between the (3 1 1) and (4 0 0) peaks of Li4Ti5O12 and the Ce-doped Li4Ti5O12–CeO2 composites with Ti/Ce = 4.9[thin space (1/6-em)]:[thin space (1/6-em)]0.1, Ti/Ce = 4.85[thin space (1/6-em)]:[thin space (1/6-em)]0.15 and Ti/Ce = 4.8[thin space (1/6-em)]:[thin space (1/6-em)]0.2 are 0.674, 0.720, 0.713 and 0.656, respectively. This indicates that Ce doping leads to a confused degree of ion locations, and the confused degree of ion locations decreases with increasing Ce content. The increased confused degree means that the locations of the lithium ions are changed because of the doped Ce, indicating that Li and Ti of the 16d sites may be substituted by Ce. This means that the partial charge compensation can be accomplished by a Li vacancy. Hence, it can be expected that the electronic conductivity of Li4Ti5O12 can be improved by Ce doping. The analysis described above indicates that the Ce-doped Li4Ti5O12–CeO2 composites can be successfully prepared by the solid-state method.

Fig. 3 shows the Raman spectra of pristine Li4Ti5O12 and the Ce-doped Li4Ti5O12–CeO2 composites. As shown in Fig. 3, it can be found that there are five main vibration peaks at about 238, 347, 427, 670 and 755 cm−1 representing the features of the spinel structure (A1g + Eg + 3F2u).40 No obvious differences of the Raman signals between pristine Li4Ti5O12 and the Ce-doped Li4Ti5O12–CeO2 powders were found. However, the Ce-doped Li4Ti5O12–CeO2 composites show low Raman signals. The reason may be that there is a lower homogeneity in the Ce-doped Li4Ti5O12–CeO2 composites because the low dose of Ce4+ ion doping may result in an increased confused degree of ion locations during the long time and high temperature sintering. The two higher frequency bands (670 and 755 cm−1) can be assigned to the vibrations of the Ti–O bonds in TiO6 octahedra. The middle frequency bands (350 and 426 cm−1) can be assigned to the stretching vibrations of the Li–O bonds in LiO4 and LiO6 polyhedra, respectively. The lower frequency bands (238 cm−1) are assigned to the bending vibrations of the O–Ti–O bonds.41 In addition, a weak feature at 267 cm−1 is assigned to the F2g modes in Fig. 3, which is well consistent with the results reported in the literature.42,43 As shown in Fig. 4, the CeO2 crystal possesses a cubic structure. There exists a symmetrical stretching mode of the Ce–O vibrational unit in CeO2. From Fig. 3, a sharp and symmetric peak at 465 cm−1 can be found, and it is associated with the F2g Raman active mode of the polycrystalline cubic structure of CeO2.44 These are the Raman characteristics of the spinel structure of Li4Ti5O12 and Ce-doped Li4Ti5O12–CeO2, which are consistent with the XRD characterization mentioned above.


image file: c5ra00523j-f3.tif
Fig. 3 Raman spectra of the as-prepared Li4Ti5O12 and Ce-doped Li4Ti5O12–CeO2 samples with different molar ratios between Ti and Ce: (a) Ti/Ce = 5[thin space (1/6-em)]:[thin space (1/6-em)]0, (b) Ti/Ce = 4.9[thin space (1/6-em)]:[thin space (1/6-em)]0.1, (c) Ti/Ce = 4.85[thin space (1/6-em)]:[thin space (1/6-em)]0.15, and (d) Ti/Ce = 4.8[thin space (1/6-em)]:[thin space (1/6-em)]0.2.

image file: c5ra00523j-f4.tif
Fig. 4 (a) Side view and (b) top view of the CeO2 bulk structure.

The scanning electron microscopy (SEM) images of Li4Ti5O12 and the Ce-doped Li4Ti5O12–CeO2 materials are shown in Fig. 5. As shown in Fig. 5, it is apparent that the morphologies of all samples are similar, and all samples show small and uniform particle dimensions in the range of 1–2 μm. Hence, it can be concluded that the effect of particle size on the electrochemical properties of Li4Ti5O12 can be ruled out, and the dissimilarity of performance can be mainly attributed to the Ce and CeO2 modification. The surface morphology of Li4Ti5O12 is highly smooth. However, some very small particles can be found to be highly dispersed on the Li4Ti5O12 particles, as shown in Fig. 5(b–d). The denser the small particles accumulate, the higher the coated CeO2 content. From a comparison of these four powder surface morphologies, it can be speculated that the surface of the prepared Li4Ti5O12 is covered with small CeO2 particles. This indicates that the surface modification leads to the formation of a uniform coating.


image file: c5ra00523j-f5.tif
Fig. 5 SEM images of the as-prepared Li4Ti5O12 and Ce-doped Li4Ti5O12–CeO2 samples with different molar ratios between Ti and Ce: (a) Ti/Ce = 5[thin space (1/6-em)]:[thin space (1/6-em)]0, (b) Ti/Ce = 4.9[thin space (1/6-em)]:[thin space (1/6-em)]0.1, (c) Ti/Ce = 4.85[thin space (1/6-em)]:[thin space (1/6-em)]0.15, and (d) Ti/Ce = 4.8[thin space (1/6-em)]:[thin space (1/6-em)]0.2.

Typical steady-state cyclic voltammetry (CV) plots of Li4Ti5O12 and the Ce-doped Li4Ti5O12–CeO2 composites obtained at a slow scan rate of 0.2 mV s−1 are presented in Fig. 6. A pair of redox peaks of all the samples appears at about 1.70/1.47 V, which can be attributed to the phase transition between spinel (Li4Ti5O12) and rock-salt (Li7Ti5O12). The pair of redox peaks below 0.6 V exists also due to further reduction of Ti4+ to Ti3+, indicating that the electrochemical lithium extraction/insertion reaction in these composite electrodes takes place in at least two stages during the discharge. The broad peak with envelope feature below 0.5 V indicates the formation of an amorphous phase. Different electrochemical polarization degrees can be found in different samples even at such a low scanning rate (0.2 mV s−1). The potential difference of the CV peaks can reflect the polarization degree of the electrodes. Table 1 gives the potential differences between the anodic and cathodic peaks of all samples. It is obvious that the potential differences of the Ce-doped Li4Ti5O12–CeO2 electrodes are lower than that of pristine Li4Ti5O12. The narrow potential differences of the Ce-doped Li4Ti5O12–CeO2 electrodes indicate the reduced polarization and enhanced electrochemical kinetics.25 The low potential interval demonstrates that the lithium insertion into the Ce-doped Li4Ti5O12–CeO2 electrodes can be treated as a quasi-reversible system with improved dynamic behaviors. Among all samples, the Ce-doped Li4Ti5O12–CeO2 composite with Ti/Ce = 4.9[thin space (1/6-em)]:[thin space (1/6-em)]0.1 exhibits the smallest potential difference, indicating the lowest polarization and excellent kinetics.


image file: c5ra00523j-f6.tif
Fig. 6 Cyclic voltammetry (CV) plots of Li4Ti5O12 and the Ce-doped Li4Ti5O12–CeO2 samples with different molar ratios between Ti and Ce: (a) Ti/Ce = 5[thin space (1/6-em)]:[thin space (1/6-em)]0, (b) Ti/Ce = 4.9[thin space (1/6-em)]:[thin space (1/6-em)]0.1, (c) Ti/Ce = 4.85[thin space (1/6-em)]:[thin space (1/6-em)]0.15, and (d) Ti/Ce = 4.8[thin space (1/6-em)]:[thin space (1/6-em)]0.2.
Table 1 Potential differences between the anodic and cathodic peaks and lithium ion diffusion coefficients (DLi) of the as-prepared Li4Ti5O12 and Ce-doped Li4Ti5O12–CeO2 samples with different molar ratios between Ti and Ce
Samples with different molar ratios φpa (V) φpc (V) Δφp (mV) DLi (cm2 s−1)
Ti/Ce = 5[thin space (1/6-em)]:[thin space (1/6-em)]0 1.816 1.359 457 3.03 × 10⁻¹⁶
Ti/Ce = 4.9[thin space (1/6-em)]:[thin space (1/6-em)]0.1 1.722 1.472 250 6.78 × 10⁻¹⁶
Ti/Ce = 4.85[thin space (1/6-em)]:[thin space (1/6-em)]0.15 1.728 1.453 275 8.68 × 10⁻¹⁶
Ti/Ce = 4.8[thin space (1/6-em)]:[thin space (1/6-em)]0.2 1.722 1.366 356 4.11 × 10⁻¹⁵


To clarify the effects of the Ce and CeO2 modification on the kinetic properties of Li4Ti5O12, EIS (Electrochemical impedance spectroscopy) were further measured as shown in Fig. 7. Models used to fit the EIS of Li4Ti5O12 have also been reported in many references, such as Li4Ti5O12,45 Au-coated Li4Ti5O12,46 and TiO2-coated Li4Ti5O12.47 The inset shows the selected equivalent circuit used to fit the EIS and the enlarged Nyquist plots of all anode materials. In the Niquist plot, the high frequency intercept at the real axis corresponding to the ohmic resistance of the cell is caused by the electrolyte. The capacitive loop is mainly contributed by the charge transfer resistance (Rct) at the electrode–electrolyte interfaces. The linear Warburg (ZW) region in the low-frequency region is associated with the lithium-ion diffusion process in Li4Ti5O12.45–47 From the enlarged Nyquist plots, it can be seen that the pristine Li4Ti5O12 electrode exhibits a higher charge transfer resistance than those of the Ce-doped Li4Ti5O12–CeO2 composite electrodes. This indicates that the Ce and CeO2 modification can enhance the conductivity of the active materials, and then decrease the charge transfer resistance at the electrode–electrolyte interface, suggesting that the Ce-doped Li4Ti5O12–CeO2 composites may have a higher electrochemical activity than that of pristine Li4Ti5O12 during cycling. The reason may be that CeO2 with a high electrical conductivity enhances the total electrical conductivities of the Ce-doped Li4Ti5O12–CeO2 composite electrodes. The lithium ion diffusion coefficient (DLi) can be calculated from the plots in the low-frequency region according to the following eqn (4) and (5) (similar approaches have also been applied to various electrode materials like LiFePO4,48 LiNi0.5Mn1.5O4,49 LiMn2SiO4,50 and Li4Ti5O1251 electrode materials):48–51

 
image file: c5ra00523j-t3.tif(4)
 
image file: c5ra00523j-t4.tif(5)
where T is the absolute temperature, R is the gas constant, A is the surface area of the electrode, F is the Faraday constant, n is the number of electrons per molecule during oxidation, CLi is the concentration of lithium ions, and σ is the Warburg factor which is related to Zre obtained from the slope of the lines in Fig. 8.


image file: c5ra00523j-f7.tif
Fig. 7 Electrochemical impedance spectra of the as-prepared Li4Ti5O12 and Ce-doped Li4Ti5O12–CeO2 samples with different molar ratios between Ti and Ce: (a) Ti/Ce = 5[thin space (1/6-em)]:[thin space (1/6-em)]0, (b) Ti/Ce = 4.9[thin space (1/6-em)]:[thin space (1/6-em)]0.1, (c) Ti/Ce = 4.85[thin space (1/6-em)]:[thin space (1/6-em)]0.15, and (d) Ti/Ce = 4.8[thin space (1/6-em)]:[thin space (1/6-em)]0.2. Insets: Equivalent circuit and enlarged Niquist plots.

image file: c5ra00523j-f8.tif
Fig. 8 Graph of Zre plotted against ω−1/2 in the low-frequency region for the as-prepared Li4Ti5O12 and Ce-doped Li4Ti5O12–CeO2 samples with different molar ratios between Ti and Ce: (a) Ti/Ce = 5[thin space (1/6-em)]:[thin space (1/6-em)]0, (b) Ti/Ce = 4.9[thin space (1/6-em)]:[thin space (1/6-em)]0.1, (c) Ti/Ce = 4.85[thin space (1/6-em)]:[thin space (1/6-em)]0.15, and (d) Ti/Ce = 4.8[thin space (1/6-em)]:[thin space (1/6-em)]0.2.

The DLi parameters of pristine Li4Ti5O12 and the Ce-doped Li4Ti5O12–CeO2 electrodes obtained from the EIS are recorded in Table 1. The calculated DLi values of the samples are 3.03 × 10⁻¹⁶, 6.78 × 10⁻¹⁶, 8.68 × 10⁻¹⁶ and 4.11 × 10⁻¹⁵ cm2 s−1. It can be found that the lithium diffusion coefficient values of the Ce-doped Li4Ti5O12–CeO2 electrodes are higher than that of pristine Li4Ti5O12. The enhancement of the diffusion coefficient may be mainly attributed to the Ce and CeO2 modification. The substitution of Ti4+ by Ce4+ can increase the proportion between Ti3+ and Ti4+, and then improve the lithium diffusion coefficient.

Fig. 9 shows the initial charge–discharge profiles of pristine Li4Ti5O12 and the Ce-doped Li4Ti5O12–CeO2 anode materials between 0.0–2.5 V at an 0.1 C rate. All discharge profiles present two flat plateaus near 1.55 and 0.7 V, and an inclined curve from 0.6 to 0.0 V, indicating a new electrochemical insertion processes below 1.0 V. It may be a two-phase reaction between Li7Ti5O12 and Li8.5Ti5O12. All samples deliver specific capacities of 280–300 mA h g−1 at an 0.1 C rate, and exceed the theoretical capacity (260 mA h g−1) of Li4Ti5O12.33 The extra capacity is from the formation of a solid electrolyte interface (SEI) film and the discharge of carbon black.52 As we know, the insertion/extraction of lithium ions is rather sufficient even in bulk materials during the low charge–discharge current density.53 However, the potential difference (ΔE) between the charge and discharge plateaus of all samples is different, as shown in Fig. 10, suggesting different polarization for all electrodes. It can be found that the Ce-doped Li4Ti5O12–CeO2 anodes show a smaller potential difference than that of pristine Li4Ti5O12. In addition, the Ce-doped Li4Ti5O12–CeO2 anodes show a higher plateau voltage than that of pristine Li4Ti5O12, suggesting increased energy densities for the modified electrodes. Fig. 11 shows the differential capacity curves of pristine Li4Ti5O12 and the Ce-doped Li4Ti5O12–CeO2 samples in the first cycle between 0 and 2.5 V. It can be found that all the peaks exhibit similar shapes. The peak heights decrease sequentially in the order of pristine Li4Ti5O12 and the Ce-doped Li4Ti5O12–CeO2 samples with increasing Ce content, indicating a sequential decrease in initial capacity. The reason may be due to the decrease of active Ti4+. However, the potential differences between the anode and cathode peaks also decrease in the same order. This reveals that the Ce-doped Li4Ti5O12–CeO2 samples possess a lower polarization of the charge transfer reaction and higher diffusivity of lithium ions inside the electrode than those of pristine Li4Ti5O12.


image file: c5ra00523j-f9.tif
Fig. 9 Initial galvanostatic charge–discharge curves of the as-prepared Li4Ti5O12 and Ce-doped Li4Ti5O12–CeO2 samples with different molar ratios between Ti and Ce at a rate of 0.1 C: (a) Ti/Ce = 5[thin space (1/6-em)]:[thin space (1/6-em)]0, (b) Ti/Ce = 4.9[thin space (1/6-em)]:[thin space (1/6-em)]0.1, (c) Ti/Ce = 4.85[thin space (1/6-em)]:[thin space (1/6-em)]0.15, and (d) Ti/Ce = 4.8[thin space (1/6-em)]:[thin space (1/6-em)]0.2.

image file: c5ra00523j-f10.tif
Fig. 10 Enlarged potential plateaus of the as-prepared Li4Ti5O12 and Ce-doped Li4Ti5O12–CeO2 samples from Fig. 9 with different molar ratios between Ti and Ce at a rate of 0.1 C: (a) Ti/Ce = 5[thin space (1/6-em)]:[thin space (1/6-em)]0, (b) Ti/Ce = 4.9[thin space (1/6-em)]:[thin space (1/6-em)]0.1, (c) Ti/Ce = 4.85[thin space (1/6-em)]:[thin space (1/6-em)]0.15, and (d) Ti/Ce = 4.8[thin space (1/6-em)]:[thin space (1/6-em)]0.2.

image file: c5ra00523j-f11.tif
Fig. 11 Differential capacity vs. voltage plots of the as-prepared Li4Ti5O12 and Ce-doped Li4Ti5O12–CeO2 samples with different molar ratios between Ti and Ce at a rate of 0.1 C: (a) Ti/Ce = 5[thin space (1/6-em)]:[thin space (1/6-em)]0, (b) Ti/Ce = 4.9[thin space (1/6-em)]:[thin space (1/6-em)]0.1, (c) Ti/Ce = 4.85[thin space (1/6-em)]:[thin space (1/6-em)]0.15, and (d) Ti/Ce = 4.8[thin space (1/6-em)]:[thin space (1/6-em)]0.2.

Cycling performance curves of all samples at a charge–discharge rate of 0.1 C are given in Fig. 12. Compared with the initial discharge capacity, all samples show a big irreversible capacity loss for the second cycle. This can be ascribed to the formation of a solid electrolyte interface (SEI) film below 0.7 V (vs. Li/Li+), and irreversible reactions at the surface with e.g. organic lithium alkylcarbonates. It is well known that it is difficult to obtain the theoretical capacity of a bulk or micrometer sized particles. All electrode materials synthesized by the solid-state method have a lower homogeneity than that of materials prepared by a soft chemical method.54 However, the Ce-doped Li4Ti5O12–CeO2 samples also show high discharge capacities. This indicates that moderate Ce and CeO2 modification can improve the discharge capacity of Li4Ti5O12 at a low rate.


image file: c5ra00523j-f12.tif
Fig. 12 Cycling performances of the as-prepared Li4Ti5O12 and Ce-doped Li4Ti5O12–CeO2 samples with different molar ratios between Ti and Ce at a rate of 0.1 C: (a) Ti/Ce = 5[thin space (1/6-em)]:[thin space (1/6-em)]0, (b) Ti/Ce = 4.9[thin space (1/6-em)]:[thin space (1/6-em)]0.1, (c) Ti/Ce = 4.85[thin space (1/6-em)]:[thin space (1/6-em)]0.15 and (d) Ti/Ce = 4.8[thin space (1/6-em)]:[thin space (1/6-em)]0.2.

As we know, a high rate performance is important for applications in which a fast charge and discharge are needed, such as in HEV and PHEV applications. Simultaneously, a high cyclability with a fast charge–discharge process contributes to the commercial success of lithium-ion batteries as power sources. It has been reported that fast charging often induces severe underpotential deposition, resulting in hazardous Li plating and subsequent deterioration of the cell performance.53 To provide more information about the electrochemical performance difference of Ce- and CeO2-modified Li4Ti5O12, fast charge–discharge measurements carried out at a 10 C charge–discharge rate, are presented in Fig. 13. Compared with the discharge capacity shown in Fig. 12, the discharge capacity of Li4Ti5O12 decreases quickly with increasing discharge rate due to the large polarization at the high rate, whereas those of Ce- and CeO2-modified Li4Ti5O12 decrease slowly at the same rate. Although the synthesis method of the Ce- and CeO2-modified Li4Ti5O12 samples is a facile solid-state method, they show high discharge capacities at a 10 C charge–discharge rate. After 50 cycles, the discharge capacities of Ce- and CeO2-modified Li4Ti5O12 with Ti/Ce = 4.9[thin space (1/6-em)]:[thin space (1/6-em)]0.1, Ti/Ce = 4.85[thin space (1/6-em)]:[thin space (1/6-em)]0.15, and Ti/Ce = 4.8[thin space (1/6-em)]:[thin space (1/6-em)]0.2 are 91, 161 and 113 mA h g−1, respectively, and it can still retain 100% of the initial capacity, exhibiting an excellent cycling stability at a high charge–discharge rate. However, pristine Li4Ti5O12 only delivers a capacity of 32 mA h g−1 after 50 cycles, revealing a poor rate capability at a high charge–discharge rate. The higher discharge capacity of the cell based on the Ce- and CeO2-modified Li4Ti5O12 anode can be attributed to the promotion of charge transfer reactions at the electrode–electrolyte interface, decreasing the electrode polarization and improving the lithium diffusion ability.


image file: c5ra00523j-f13.tif
Fig. 13 Cycling performance of the as-prepared Li4Ti5O12 and Ce-doped Li4Ti5O12–CeO2 samples with different molar ratios between Ti and Ce at a 10 C charge–discharged rate: (a) Ti/Ce = 5[thin space (1/6-em)]:[thin space (1/6-em)]0, (b) Ti/Ce = 4.9[thin space (1/6-em)]:[thin space (1/6-em)]0.1, (c) Ti/Ce = 4.85[thin space (1/6-em)]:[thin space (1/6-em)]0.15, and (d) Ti/Ce = 4.8[thin space (1/6-em)]:[thin space (1/6-em)]0.2.

Fig. 14(a) gives the structural transformation model of Li4Ti5O12 during the charge–discharge process. In Li4Ti5O12, oxygen and lithium occupy the 32e and 8a sites, respectively, while the 16d sites are occupied by titanium and lithium with a ratio of 5[thin space (1/6-em)]:[thin space (1/6-em)]1. During discharge of the Li4Ti5O12/Li cell, the lithium atoms at the 8a sites move to the 16c sites, and the inserted Li+ ions also occupy 16c sites via 8a sites. During charging of the Li4Ti5O12/Li cell, the lithium atoms are extracted out from the 16c sites via 8a sites, and the other lithium atoms move back to the 8a sites from 16c sites. Hence, it can be concluded that the occupation of Li+ ions at 16c sites can impede the Li+ insertion and extraction. According to our synthesis process, a model of the Li4Ti5O12–CeO2 composites is shown in Fig. 14(b). In the Li4Ti5O12–CeO2 composites, in situ generated CeO2 is tightly combined with Li4Ti5O12, and then many Li4Ti5O12–CeO2 phase interfaces can be formed. These interfaces can store electrolyte and provide more places for the reactions of lithium ion insertion/extraction,55 leading to the improved reaction kinetics in polycrystalline materials or the liquid electrolyte at the solid/liquid interface, and then reduce the electrochemical polarization during the charge–discharge process. In addition, it has been reported that an internal adsorption of ions at the CeO2 surface can cause space-charge effects.56 The increased cation vacancy concentration at the interface can form highly conducting interfacial layers between Li4Ti5O12 and CeO2. Hence, these additional defects are responsible for the decreased charge transfer resistance and enhanced conductivity (see Fig. 7). Hence, it can be concluded that the CeO2 modification enhances the conductivity of Li4Ti5O12 and produces a good electrical contact between the oxides which facilitates the electron transfer between cerium oxide and the supported Li4Ti5O12. In addition, it has been reported that there is an interfacial reaction between Li4Ti5O12 and the surrounding alkyl carbonate solvents, which results in the formation of anatase TiO2.57 Hence, the CeO2 can also prevent the direct contact between the active material and electrolyte, and improve the rate capability of Li4Ti5O12 at a high charge–discharge rate. This is why the Ce- and CeO2-modified Li4Ti5O12 composites show a higher rate capacity and cycling stability than those of pristine Li4Ti5O12 during the fast charge–discharge process (see Fig. 13). Hence, the Ce and CeO2 in situ modification is an effective way to improve the electrochemical performance of Li4Ti5O12.


image file: c5ra00523j-f14.tif
Fig. 14 (a) Structural transformation model of Li4Ti5O12 during the charge–discharge process, and (b) model of the Li4Ti5O12–CeO2 composites.

4. Conclusions

Ce- and CeO2-modified Li4Ti5O12 were successfully prepared by a solid-state method. Ce and CeO2 modification does not affect the structure and particle size of the Li4Ti5O12 powder. However, the Ce and CeO2-modified Li4Ti5O12 electrodes exhibit larger discharge capacities and cycling stabilities during the fast charge–discharge process. In comparison, the modified sample with Ti/Ce = 4.85[thin space (1/6-em)]:[thin space (1/6-em)]0.15 shows the optimal cycle stability and high-rate discharge capability. CV measurements provide strong evidence that the Ce and CeO2 modification can improve the reversibility of lithium ion intercalation and de-intercalation, and then decrease the polarization degrees of the electrodes. Correspondingly, EIS tests prove that the Ce and CeO2 modification can decrease the charge transfer resistance, and increase the lithium diffusion coefficient of the electrodes. Ce and CeO2 modification is an effective way to improve the electrochemical properties of the Li4Ti5O12 anode material by producing a good electrical contact between the oxides and Li4Ti5O12, resulting in an improved conductivity, lithium diffusion coefficient and fast charge–discharge performance.

Acknowledgements

This work was financially supported by the National Natural Science Foundation of China (nos 51274002 and 51404002), Anhui Provincial Natural Science Foundation (no. 1508085MB25), the Postdoctoral Science-research Developmental Foundation of Heilongjiang Province (no. LBH-Q13138), and the Program for Innovative Research Team in Anhui University of Technology (no. TD201202).

References

  1. Y. Li, J. Song and J. Yang, Renewable Sustainable Energy Rev., 2014, 37, 627–633 CrossRef PubMed.
  2. K. Zaghib, M. Dontigny, P. Perret, A. Guerfi, M. Ramanathan, J. Prakash, A. Mauger and C. M. Julien, J. Power Sources, 2014, 248, 1050–1057 CrossRef CAS PubMed.
  3. Y. Q. Wang, L. Gu, Y. G. Guo, H. Li, X. Q. He, S. Tsukimoto, Y. Ikuhara and L. J. Wan, J. Am. Chem. Soc., 2012, 134, 7874–7879 CrossRef CAS PubMed.
  4. H. Kageyama, Y. Oaki and H. Imai, RSC Adv., 2014, 4, 44124–44129 RSC.
  5. C. Cheng, H. Liu, X. Xue, S. Cao, H. Cao and L. Shi, RSC Adv., 2014, 4, 63105–63109 RSC.
  6. C. W. Xiao, Y. Ding, J. T. Zhang, X. Q. Su, G. R. Li, X. P. Gao and P. W. Shen, J. Power Sources, 2014, 248, 323–329 CrossRef CAS PubMed.
  7. W. Wang, B. Jiang, W. Xiong, Z. Wang and S. Jiao, Electrochim. Acta, 2013, 114, 198–204 CrossRef CAS PubMed.
  8. T. F. Yi, H. P. Liu, Y. R. Zhu, L. J. Jiang, Y. Xie and R. S. Zhu, J. Power Sources, 2012, 215, 258–265 CrossRef CAS PubMed.
  9. Q. Y. Zhang, C. L. Zhang, B. Li, S. F. Kang, X. Li and Y. G. Wang, Electrochim. Acta, 2013, 98, 146–152 CrossRef CAS PubMed.
  10. H. Zhao, Y. Li, Z. Zhu, J. Lin, Z. Tian and R. Wang, Electrochim. Acta, 2008, 53, 7079–7083 CrossRef CAS PubMed.
  11. D. Wang, C. M. Zhang, Y. Y. Zhang, J. Wang and D. N. He, Ceram. Int., 2013, 39, 5145–5149 CrossRef CAS PubMed.
  12. X. Li, S. H. Tang, M. Z. Qu, P. X. Huang, W. Li and Z. L. Yu, J. Alloys Compd., 2014, 58, 817–824 Search PubMed.
  13. W. Wang, H. Wang, S. Wang, Y. Hu, Q. Tian and S. Jiao, J. Power Sources, 2013, 228, 244–249 CrossRef CAS PubMed.
  14. P. Kubiak, A. Garcia, M. Womes, L. Aldon, J. O. Fourcade, P. E. Lippens and J. C. Jumas, J. Power Sources, 2003, 119, 626–630 CrossRef.
  15. J. Wolfenstine and J. L. Allen, J. Power Sources, 2008, 180, 582–585 CrossRef CAS PubMed.
  16. Q. Y. Zhang, C. L. Zhang, B. Li, D. D. Jiang, S. F. Kang, X. Li and Y. G. Wang, Electrochim. Acta, 2013, 107, 139–146 CrossRef CAS PubMed.
  17. X. Han, Z. Zhao, Y. Xu, D. Liu, H. Zhang and C. Zhao, RSC Adv., 2014, 4, 41968–41975 RSC.
  18. J. Q. Wang, Z. Z. Yang, W. H. Li, X. W. Zhong, L. Gu and Y. Yu, J. Power Sources, 2014, 266, 323–331 CrossRef CAS PubMed.
  19. Z. M. Liu, N. Q. Zhang, Z. J. Wang and K. N. Sun, J. Power Sources, 2012, 205, 479–482 CrossRef CAS PubMed.
  20. C. C. Li, Q. H. Li, L. B. Chen and T. H. Wang, ACS Appl. Mater. Interfaces, 2012, 4, 1233–1238 CAS.
  21. J. Shu, L. Hou, R. Ma, M. Shui, L. Shao, D. Wang, Y. Ren and W. Zheng, RSC Adv., 2012, 2, 10306–10309 RSC.
  22. Y. Ding, G. R. Li, C. W. Xiao and X. P. Gao, Electrochim. Acta, 2013, 102, 282–289 CrossRef CAS PubMed.
  23. H. Yu, X. Zhang, A. F. Jalbout, X. Yan, X. Pan, H. Xie and R. Wang, Electrochim. Acta, 2008, 53, 4200–4204 CrossRef CAS PubMed.
  24. H. Park, T. Song, H. Han and U. Paik, J. Power Sources, 2013, 244, 726–730 CrossRef CAS PubMed.
  25. J. Liu, X. Li, M. Cai, R. Li and X. Sun, Electrochim. Acta, 2013, 93, 195–201 CrossRef CAS PubMed.
  26. X.-P. Li and J. Mao, Ceram. Int., 2014, 40, 13553–13558 CrossRef CAS PubMed.
  27. L. Daza, C. M. Rangel, J. Baranda, M. T. Casais, M. J. Martinez and J. A. Alonso, J. Power Sources, 2000, 86, 329 CrossRef CAS.
  28. D. Arumugam and G. P. Kalaignan, Electrochim. Acta, 2010, 55, 8709–8716 CrossRef CAS PubMed.
  29. J. W. Yao, F. Wu, X. P. Qiu, N. Li and Y. F. Su, Electrochim. Acta, 2011, 56, 5587–5592 CrossRef CAS PubMed.
  30. F. Wu, M. Wang, Y. F. Su, L. Y. Bao and S. Chen, Electrochim. Acta, 2009, 54, 6803–6807 CrossRef CAS PubMed.
  31. W. Yuan, H. Z. Zhang, Q. Liu, G. R. Li and X. P. Gao, Electrochim. Acta, 2014, 135, 199–207 CrossRef CAS PubMed.
  32. X. J. Yang, Y. D. Huang, X. C. Wang, D. Z. Jia, W. K. Pang, Z. P. Guo and X. C. Tang, J. Power Sources, 2014, 257, 280–285 CrossRef CAS PubMed.
  33. Z. Zhong, C. Ouyang, S. Shi and M. Lei, ChemPhysChem, 2008, 9, 2104–2108 CrossRef CAS PubMed.
  34. J. Shu, Electrochem. Solid-State Lett., 2008, 11, A238–A240 CrossRef CAS PubMed.
  35. R. D. Shannon, Acta Crystallogr., Sect. A: Cryst. Phys., Diffr., Theor. Gen. Crystallogr., 1976, 32, 751–767 CrossRef.
  36. T.-F. Yi, J. Shu, Y.-R. Zhu, X.-D. Zhu, C.-B. Yue, A.-N. Zhou and R.-S. Zhu, Electrochim. Acta, 2009, 54, 7464–7470 CrossRef CAS PubMed.
  37. T. Ohzuku, A. Ueda and N. Yamamoto, J. Electrochem. Soc., 1995, 142, 1431–1435 CrossRef CAS PubMed.
  38. T. Ohzuku, K. Ariyoshi, S. Takeda and Y. Sakai, Electrochim. Acta, 2001, 46, 2327–2336 CrossRef CAS.
  39. T.-F. Yi, C.-Y. Li, Y.-R. Zhu, J. Shu and R.-S. Zhu, J. Solid State Electrochem., 2009, 13, 913–919 CrossRef CAS PubMed.
  40. C. K. Lan, S. I. Chuang, Q. Bao, Y. T. Liao and J. G. Duh, J. Power Sources, 2015, 275, 660–667 CrossRef CAS PubMed.
  41. R. B. Hadjean and J. P. P. Ramos, Chem. Rev., 2010, 110, 1278–1319 CrossRef PubMed.
  42. G. Yan, H. Fang, H. Zhao, G. Li, Y. Yang and L. Li, J. Alloys Compd., 2009, 470, 544–547 CrossRef CAS PubMed.
  43. L. Aldon, P. Kubiak, M. Womes, J. C. Jumas, J. O. Fourcade, J. L. Tirado, J. I. Corredor and C. P. Vicente, Chem. Mater., 2004, 16, 5721–5725 CrossRef CAS.
  44. G. Balakrishnan, C. M. Raghavan, C. Ghosh, R. Divakar, E. Mohandas, J. I. Song, S. I. Bae and T. G. Kim, Ceram. Int., 2013, 39, 8327–8333 CrossRef CAS PubMed.
  45. W. Fang, P. J. Zuo, Y. L. Ma, X. Q. Cheng, L. X. Liao and G. P. Yin, Electrochim. Acta, 2013, 94, 294–299 CrossRef CAS PubMed.
  46. W. Wang, Y. Y. Guo, L. X. Liu, S. X. Wang, X. G. Yang and H. Guo, J. Power Sources, 2014, 245, 624–629 CrossRef CAS PubMed.
  47. J. Y. Liao, X. C. Xiao, D. Higgins and D. G. Lee, Electrochim. Acta, 2013, 108, 104–111 CrossRef CAS PubMed.
  48. H. Liu, Q. Cao, L. J. Fu, C. Li, Y. P. Wu and H. Q. Wu, Electrochem. Commun., 2006, 8, 1553–1557 CrossRef CAS PubMed.
  49. J. Wang, W. Lin, B. Wu and J. Zhao, Electrochim. Acta, 2014, 145, 245–253 CrossRef CAS PubMed.
  50. S. Liu, J. Xu, D. Li, Y. Hu, X. Liu and K. Xie, J. Power Sources, 2013, 232, 258–263 CrossRef CAS PubMed.
  51. B. Li, C. Han, Y. B. He, C. Yang, H. Du, Q. H. Yang and F. Kang, Energy Environ. Sci., 2012, 5, 9595–9602 CAS.
  52. J. Shu, J. Solid State Electrochem., 2009, 13, 1535–1539 CrossRef CAS.
  53. G. G. Amatucci, F. Badway, A. D. Pasquier and T. Zheng, J. Electrochem. Soc., 2001, 148, A930–A939 CrossRef CAS PubMed.
  54. C. Zhang, Y. Zhang, J. Wang, D. Wang, D. He and Y. Xia, J. Power Sources, 2013, 236, 118–125 CrossRef CAS PubMed.
  55. M. M. Rahman, J. Z. Wang, M. F. Hassan, D. Wexler and H. K. Liu, Adv. Energy Mater., 2011, 1, 212–220 CrossRef CAS PubMed.
  56. M. M. E. Jacob, S. Rajendran, R. Gangadharan, M. S. Michael and S. R. S. Prabaharan, Solid State Ionics, 1996, 86, 595–602 CrossRef.
  57. Y. B. He, B. H. Li, M. Liu, C. Zhang, W. Lv, C. Yang, J. Li, H. D. Du, B. Zhang, Q. H. Yang, J. K. Kim and F. Y. Kang, Sci. Rep., 2012, 2, 9 Search PubMed.

This journal is © The Royal Society of Chemistry 2015
Click here to see how this site uses Cookies. View our privacy policy here.