Lithium metatitanate enhanced solid–solid reaction in a lithium–nitrogen–hydrogen system

Tengfei Zhang*a, Shigehito Isobe*ab, Yongming Wanga, Naoyuki Hashimotoa and Somei Ohnukia
aGraduate School of Engineering, Hokkaido University, N-13, W-8, Sapporo 060-8628, Japan. E-mail: zhangtengfei@eng.hokudai.ac.jp; isobe@eng.hokudai.ac.jp
bCreative Research Institution, Hokkaido University, N-21, W-10, Sapporo, 001-0021, Japan

Received 7th January 2015 , Accepted 3rd February 2015

First published on 3rd February 2015


Abstract

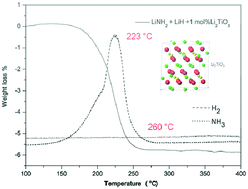
We have decreased the end temperature of the Li–N–H system, a hydrogen storage material developed in 2002, to below 260 °C, and obtained a lowest peak temperature of 223 °C.

Lithium metatitanate (Li2TiO3) is a technologically important material with many practical applications. It has been used as a double-layer cathode material in molten carbonate fuel cells,1 and as an electrode material in lithium-ion batteries.2,3 In lithium-ion batteries, Li2TiO3 is usually combined with LiMO2 (M = Fe, Mn, Cr, Ni) to create a solid-solution, with formulas xLiMO2 − (1 − x)Li2TiO3. This can stabilize the structure of high-capacity cathode materials.4–7 Li2TiO3 is a candidate for solid breeder materials in the blankets of fusion reactors,8 and is the preferred material for test blanket modules because of its attractive characteristics, such as high thermal stability, high lithium density, and tritium recovery at low temperatures, compared with lithium zirconate (Li2ZrO3) and lithium silicate (Li2SiO3).9–11 Because of its many important applications, the mechanical and thermal properties of Li2TiO3 have been thoroughly investigated.

Recently, the diffusion pathways of lithium in the bulk, the occupancy of lithium in the lattice, and the effects of the defects have been investigated by Vijayakumar et al.12 The lithium diffusion properties of Li2TiO3 have been measured by NMR and simulated by potential-based molecular dynamics. Lithium conduction in monoclinic Li2TiO3 is three-dimensional, which can provide suitable nearby vacancies. Li2TiO3 has been extensively investigated due to its many important applications. Herein, we use Li2TiO3 in another area as a catalyst because of its structural characteristics.

Titanium compounds have been doped as catalysts in hydrogen storage materials. Bogdanović and Schwickardi13 reported that NaAlH4 can be used as a solid reversible hydrogen storage material after doping with Ti(Obutyl)4, reawakening interest in using complex metal hydrides as hydrogen storage materials.14 One of the most frequently used catalysts is TiCl3. The active catalytic species is produced during high-energy ball-milling,14–17 and is highly dispersed within the materials. This is indicates that Ti is suitable for solid-state hydrogen storage materials. Since Chen et al.18 first reported Li–N–H systems, the reversibility and relatively high H2 storage capacity of the systems have been investigated. Theoretically, a large amount (6.5 wt%, based on the reaction under experimental conditions, not a tank system) of hydrogen is accessible in this reaction. Hydrogen can be desorbed through the solid–solid reaction in eqn (1).

 
LiNH2 + LiH ↔ Li2NH + H2 (1)

However, the system is still limited for practical applications because a high desorption temperature is required and the reaction suffers from slow kinetics. Furthermore, NH3 is a subsidiary product in the dehydrogenation process according to eqn (2). The main reason is LiNH2 decomposition at higher temperatures.

 
2LiNH2 → Li2NH + NH3 (2)

Lithium diffusion plays an important role in this solid–solid reaction.19–21 The kinetics of this reaction are strongly dependent on the crystal structure and its defects. The mobility of lithium ions can be enhanced as the temperature increases.22 In this study, we introduce the structural characteristics of Li2TiO3 to the lithium–nitrogen–hydrogen system, which is expected to improve the reaction kinetics. We present X-ray diffraction (XRD), thermogravimetry differential thermal analysis (TG-DTA), and thermal gas desorption mass spectrometry (TDMS) using Li2TiO3 as a catalyst in the Li–N–H system.

LiNH2 (95%), LiH (95%), LiCO3 (99.997%), and TiO2 (99%) were purchased from Sigma-Aldrich. Single-phase Li2TiO3 was synthesized by the solid-state reaction in eqn (3).23

 
Li2CO3 + TiO2 → Li2TiO3 + CO2 (3)

Typically, to ensure homogeneous mixing between the starting materials and the additive, LiNH2 and LiH powders (300 mg, 1[thin space (1/6-em)]:[thin space (1/6-em)]1.1 molar ratio) and Li2TiO3 (1 mol%) were ball milled for 2 h (Fritsch P7). Different molar ratios of Li2TiO3 (1, 2 and 5 mol%) were doped into the mixtures. During high-energy ball milling, samples were milled at 400 rpm for 2 h under hydrogen gas (99.9999% purity) at a pressure of 1 MPa at room temperature. The milling was interrupted every 30 min for 15 min to prevent frictional heat during the milling process.

The samples were measured by TG-DTA (Bruker TAPS3000S) combined with TDMS upon heating to 400 °C at a rate of 5 °C min−1. TG-DTA equipment was installed in a glovebox to avoid exposing the sample to air during the measurements. Furthermore, the structural properties were characterized by XRD.

Li2TiO3 was synthesized by sintering a mixture of Li2CO3 and TiO2 at 700 °C. The powder XRD profile is shown in Fig. 1. The XRD pattern showed no apparent impurities in single-phase Li2TiO3. Single-phase Li2TiO3 was off-white, which is consistent with previous results.24 The stability of Li2TiO3 is also reflected by the XRD patterns in Fig. 1. After high-energy ball milling and dehydrogenation, the structure of Li2TiO3 was the same as that of the single phase of raw Li2TiO3. This indicates that the Li2TiO3 in the cycled sample remains unchanged.


image file: c5ra00285k-f1.tif
Fig. 1 XRD patterns for the single phase of Li2TiO3 and LiNH2 + LiH with 1 mol% Li2TiO3, ball-milled for 2 h after TG measurements up to 400 °C.

To clarify the thermal desorption properties of the mixture with additives, the desorption gas and weight loss were determined by TG-DTA-TDMS. The TDMS result from the sample with catalyst is shown in Fig. 2. The LiH + LiNH2 composite with catalyst showed only a sharp H2 peak. The peak temperature was at 223 °C. No NH3 was detected by TDMS. Compared with the sample with no catalyst, which released H2 and NH3 at higher temperatures,20 this clearly demonstrates that doping Li2TiO3 had an effect on the whole system. The results of the sample with no catalyst are shown in ref. 20. Furthermore, the doping of Li2TiO3 led to full desorption within the temperature range of 150 to 260 °C. The DTA peak temperature of the Li2TiO3-doped sample is lower (223 °C) than other common catalysts, such as TiCl3, LiTi2O4 (Fig. 3), TiNano, TiO2,25 BN and TiN.26 Accordingly, the lower dehydrogenation temperature showed that the properties of desorption can be improved greatly by doping with Li2TiO3. The temperature of reaction range is also shorter (150–260 °C) than that of TiCl3 (150–300 °C) and LiTi2O4 (150–310 °C). Based on these results, Li2TiO3 has the highest catalytic efficiency for the Li–N–H system, and this is the first system to have an end temperature below 260 °C.18


image file: c5ra00285k-f2.tif
Fig. 2 TDMS and corresponding TG results for the LiNH2 + LiH mixture ball milled for 2 h with 1 mol% Li2TiO3 during dehydrogenation.

image file: c5ra00285k-f3.tif
Fig. 3 DTA results for the dehydrogenation of samples (left) LiNH2 + LiH + 1 mol% Li2TiO3; LiNH2 + LiH + 1 mol% TiCl3; LiNH2 + LiH + 0.5 mol% LiTi2O4. (Right) Details of the peak temperature.

Different amounts of Li2TiO3 were doped into the mixtures to identify the optimum amount of Li2TiO3 (Fig. 4). According to the TG-DTA data, the peak temperature for H2 desorption of the 1, 2, and 5 mol% Li2TiO3-doped samples was 223 °C. The DTA curves of the samples were similar. The weight losses for the 1, 2 and 5 mol% Li2TiO3-doped samples were 5.8, 5.1 and 4.4 wt%, respectively. These values were based on the reaction of materials during experimental conditions. Minor contamination with the starting materials, such as Li2O, could explain why the experimental hydrogen storage capacity is lower than the theoretical value. These results indicate that there is no simple linear correlation between the catalytic effect and the amount of catalyst. The optimum amount of Li2TiO3 is 1 mol% for achieving maximum storage capacity.


image file: c5ra00285k-f4.tif
Fig. 4 TG and DTA results for mixtures milled for 2 h with different amounts of Li2TiO3.

To clarify the catalytic effect on hydrogenation, the reversibility, recyclability, and the hydrogenation rate were investigated. The effect of the addition of Li2TiO3 on hydrogen absorption was examined in a series of experiments. The dehydrogenated samples were hydrogenated at 200 °C and a hydrogen pressure of 1 MPa for 10, 100, 200, and 500 min. Fig. 5 shows the corresponding hydrogen uptake for samples. The hydrogenation rate of the samples with and without Li2TiO3 is shown in Table 1. The results of the sample without the catalyst are shown in ref. 27. The hydrogenation rate of the sample with Li2TiO3 addition is 4.8 times higher than that of the reference sample for 10 min, 2.5 times for 100 min, and 2.0 times for 200 min.


image file: c5ra00285k-f5.tif
Fig. 5 Extent of rehydrogenation reaction for samples with Li2TiO3 at 200 °C, 1 MPa H2 for 10, 100, 200, and 500 min.
Table 1 Hydrogenation rate, demonstrating the catalytic effect of hydrogenation
Temperature and pressure 200 °C, 1 MPa H2
Hydrogenation time (min) 10 100 200
Hydrogenation rate (%) W/o catalyst 9 23 34
W/ catalyst 44 59 70


Furthermore, the recyclability and durability of the catalytic effect of Li2TiO3 was examined by a 10-cycle test (Fig. 6). The weight loss (5.8%) and peak temperature (223 °C) are the same as the first cycle. These results show that the catalyst affects the dehydrogenation and hydrogenation.


image file: c5ra00285k-f6.tif
Fig. 6 Weight loss of LiNH2 + LiH + 1 mol% Li2TiO3 mixture after 10 cycles of dehydrogenation/hydrogenation (solid line) and differential thermal analysis (dashed line).

Based on these results, Li2TiO3 effectively catalyzes the solid–solid reaction between LiH and LiNH2 upon dehydrogenation and hydrogenation. The catalytic mechanism of Li2TiO3 in the Li–N–H system was investigated. During the temperature increase in dehydrogenation, the thermal vibration of the ions and the density of the vacancies increased. This would also increase the lithium-ion mobility. It has been proposed that the solid–solid reaction between LiH and LiNH2 occurs via Li+ migration across the reactive interfaces between the LiH particles and the LiNH2 particles during high temperature dehydrogenation.19,20,28 In this study, Li2TiO3 was doped into the Li–N–H system. According to the structural characteristics of Li2TiO3 (Fig. 7), nonstoichiometric Li2TiO3 can cause lithium vacancies in both the LiTi2 layers and pure Li, and thus lithium diffusion should happen in the xy-plane and along the z-axis. Lithium mobility in monoclinic Li2TiO3 is three-dimensional which could provide suitable nearby vacancies during the temperature increase in dehydrogenation.12 Doping LiNH2 and LiH with Li2TiO3 creates vacancies that help destabilize the lithium ions in the crystal-lattice of LiNH2 and LiH, which could increase the mobility of lithium ions and make the reaction happen at a lower temperature. Furthermore, the improvement in the kinetics could consume LiNH2, and restrict the emission of ammonia at high temperatures.


image file: c5ra00285k-f7.tif
Fig. 7 Crystal structure of monoclinic LiTi2O3 (as reported in ref. 29). Lithium atoms are shown in green, oxygen atoms in red, and titanium atoms in yellow.

Conclusions

In summary, we have reported the discovery of Li2TiO3 as a catalyst in a solid–solid reaction for hydrogen storage materials. The catalytic effect, appropriate amount and stability of Li2TiO3 in the system were confirmed by TG-DTA, TDMS and XRD. This is the first time that the end temperature of the Li–N–H system has been decreased to under 260 °C and the lowest peak temperature occurred at 223 °C. A storage capacity of 5.8 wt% H2 was obtained during dehydrogenation. The catalytic effect on the hydrogenation was also investigated. The catalytic effect of Li2TiO3 probably results from an increase in the mobility of the lithium ions between the LiNH2 and LiH solid phases. Our results are expected to help achieve deeper insight into solid–solid reactions catalyzed by metal oxide nanoparticles for hydrogen storage.

Notes and references

  1. V. Chauvaut and M. Cassir, J. Electroanal. Chem., 1999, 474, 9 CrossRef CAS.
  2. L. Zhang, X. Wang, H. Noguchi, M. Yoshio, K. Takada and T. Sasaki, Electrochim. Acta, 2004, 49, 3305 CrossRef CAS PubMed.
  3. C. S. Johnson, J. S. Kim, A. J. Kropf, A. J. Kahaian, J. T. Vaughey and M. M. Thackeray, J. Power Sources, 2003, 119–121, 139 CrossRef CAS.
  4. H. Shigemura, M. Tabuchi, H. Sakaebe, H. Kobayashi and H. Kageyama, J. Electrochem. Soc., 2003, 150, A638 CrossRef CAS PubMed.
  5. J. S. Kim, C. S. Johnson and M. M. Thackeray, Electrochem. Commun., 2002, 4, 205 CrossRef CAS.
  6. L. Zhang, T. Muta, H. Noguchi, X. Wang, M. Zhou and M. Yoshio, J. Power Sources, 2003, 117, 137 CrossRef CAS.
  7. L. Zhang and H. Noguchi, J. Electrochem. Soc., 2003, 150, A601 CrossRef CAS PubMed.
  8. N. Roux, J. Avon, A. Floreancing, J. Mougin, B. Rasneur and S. Ravel, J. Nucl. Mater., 1996, 233–237, 1431 CrossRef CAS.
  9. C. E. Johnson, K. R. Kummerer and E. Roth, J. Nucl. Mater., 1988, 155–157, 188 CrossRef.
  10. C. E. Johnson, G. W. Hollenberg, N. Roux and H. Watanabe, Fusion Eng. Des., 1989, 8, 145 CrossRef CAS.
  11. J. G. van der Laan, H. Kawamura, N. Roux and D. Yamaki, J. Nucl. Mater., 2000, 367–370, 1281 Search PubMed.
  12. M. Vijayakumar, S. kerisit, Z. Yang, G. L. Graff, J. Liu, J. A. Sears, S. D. Burton, K. M. Rosso and J. Hu, J. Phys. Chem. C, 2009, 113, 20108 CAS.
  13. B. Bogdanović and M. Schwickardi, J. Alloys Compd., 1997, 253–254, 1 CrossRef.
  14. U. Eberle, M. Felderhoff and F. Schüth, Angew. Chem., Int. Ed., 2009, 48, 6608 CrossRef CAS PubMed.
  15. L. Zaluski, A. Zaluska and J. O. Ström-Olsen, J. Alloys Compd., 1999, 290, 71 CrossRef CAS.
  16. J. Huot, G. Liang and R. Schultz, Appl. Phys. A, 2001, 72, 187 CrossRef CAS.
  17. C. M. Jensen, R. Zidan, N. Mariels, A. Hee and C. Hagen, Int. J. Hydrogen Energy, 1999, 24, 461 CrossRef CAS.
  18. P. Chen, Z. Xiong, J. Z. Luo, J. Y. Lin and K. L. Tan, Nature, 2002, 420, 302 CrossRef CAS PubMed.
  19. T. Zhang, S. Isobe, Y. Wang, N. Hashimoto and S. Ohnuki, RSC Adv., 2013, 3, 6311 RSC.
  20. T. Zhang, S. Isobe, Y. Wang, N. Hashimoto and S. Ohnuki, ChemCatChem, 2014, 6, 724 CrossRef CAS.
  21. T. Zhang, S. Isobe, Y. Wang, H. Oka, N. Hashimoto and S. Ohnuki, J. Mater. Chem. A, 2014, 2, 4361 CAS.
  22. T. Zhang, S. Isobe, Y. Wang, N. Hashimoto, S. Ohnuki, M. Matsuo and S. Orimo, MH2014, 2014, p. 174 Search PubMed.
  23. D. Mandal, M. R. K. Shenoi and S. K. Ghosh, Fusion Eng. Des., 2010, 85, 819 CrossRef CAS PubMed.
  24. http://www.en.wikipedia.org/wiki/Lithium_titanate.
  25. S. Isobe, T. Ichikawa, N. Hanada, H. Y. Leng, M. Fichtner, O. Fuhr and H. Fujii, J. Alloys Compd., 2005, 404–406, 439 CrossRef CAS PubMed.
  26. K. F. Aguey-Zinson, J. Yao and Z. Xiao Guo, J. Phys. Chem. B, 2007, 111, 12531 CrossRef PubMed.
  27. T. Zhang, S. Isobe, M. Matsuo, S. Orimo, Y. Wang, N. Hashimoto and S. Ohnuki, ACS Catal., 2015, 5, 1552 CrossRef.
  28. W. I. F. David, M. O. Jones, D. H. Gregory, C. M. Jewell, S. R. Johnson, A. Walton and P. P. Edwards, J. Am. Chem. Soc., 2007, 129, 1594 CrossRef CAS PubMed.
  29. J. F. Dorrian and R. E. Newnham, Mater. Res. Bull., 1969, 4, 179 CrossRef CAS.

This journal is © The Royal Society of Chemistry 2015
Click here to see how this site uses Cookies. View our privacy policy here.